

Total health inspections
9
Pennsylvania average 6.7
Last Health inspection on May 2025

We arrange tours, appointments, and even moving support so you don’t have to
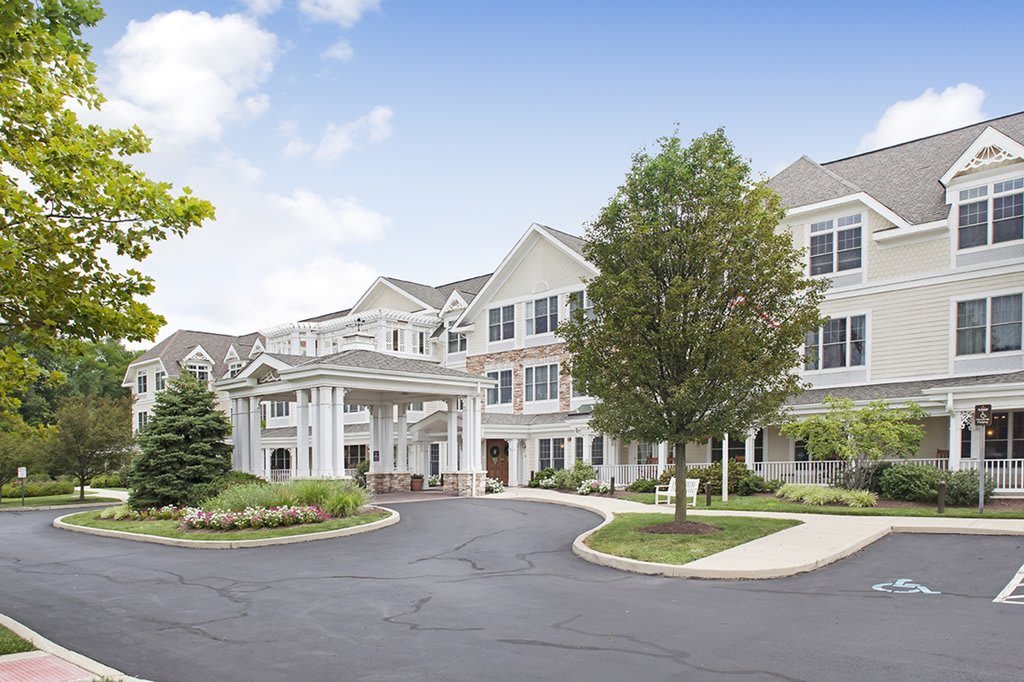

Holland Village offers independent living, assisted living, memory care, and skilled nursing where exceptional lifestyle is found in Philadelphia. They boast a nurturing and stimulating atmosphere that contribute to the respected experience discovered at Holland Village. They proudly excel with their approach in having a seamless transition for every resident; as they are a community that understands how unique their seniors are and may need specific care for every individual. Holland Village proudly welcomes all differences of every senior who comes from a variety of backgrounds. Holland Village ensures that every senior residing in their community loves the place they live.
A stunning location for a serene senior living community is tucked in by neighboring nature areas; their Five-Star dining is a testimony to the savory delicious and healthy meals; a complimentary transportation for appointments, shopping, and the like; their personalized care and all-year round of activities promote a balanced lifestyle for the residents to stay active. Holland Village prides itself on the comfort and nurturing environment, which is provided and prioritized by their caring staff and the nursing home itself.
 Official CMS rating based on health inspections, staffing and quality measures.
Official CMS rating based on deficiencies found during state health inspections.
Official CMS rating based on nurse staffing hours per resident per day.
Official CMS rating based on clinical outcomes for residents.
Average daily nursing hours per resident (adjusted for acuity). Higher values indicate more nursing time per resident.
Official CMS rating based on health inspections, staffing and quality measures.
Official CMS rating based on deficiencies found during state health inspections.
Official CMS rating based on nurse staffing hours per resident per day.
Official CMS rating based on clinical outcomes for residents.
Average daily nursing hours per resident (adjusted for acuity). Higher values indicate more nursing time per resident.
May offer a more intimate, personalized care environment.
Lower occupancy suggests more openings may be available.
Most residents typically stay for a few weeks or months before returning home or moving on.
96% of new residents, usually for short-term rehab.
4% of new residents, often for short stays.
The portion of the home's budget spent on staff, including nurses, caregivers, and other employees who support care and operations.
All remaining costs needed to run the home, such as food, utilities, building maintenance, supplies and administrative expenses.
Pets Allowed: Yes, Pets Allowed
Transportation Services
Assisted Living For seniors needing help with daily tasks but not full-time nursing.
Memory Care Specialized care for those with Memory Loss, Alzheimer's, or dementia, ensuring safety and support.
Assisted Living For seniors needing help with daily tasks but not full-time nursing.
Independent Living For self-sufficient seniors seeking community and minimal assistance.
Memory Care Specialized care for those with Memory Loss, Alzheimer's, or dementia, ensuring safety and support.
Nursing Homes 24/7 care needed
Nursing Home 24/7 care needed
Assisted Living For seniors needing help with daily tasks but not full-time nursing.
Assisted Living For seniors needing help with daily tasks but not full-time nursing.
Independent Living For self-sufficient seniors seeking community and minimal assistance.
Memory Care Specialized care for those with Memory Loss, Alzheimer's, or dementia, ensuring safety and support.
Nursing Homes 24/7 care needed
Assisted Living For seniors needing help with daily tasks but not full-time nursing.
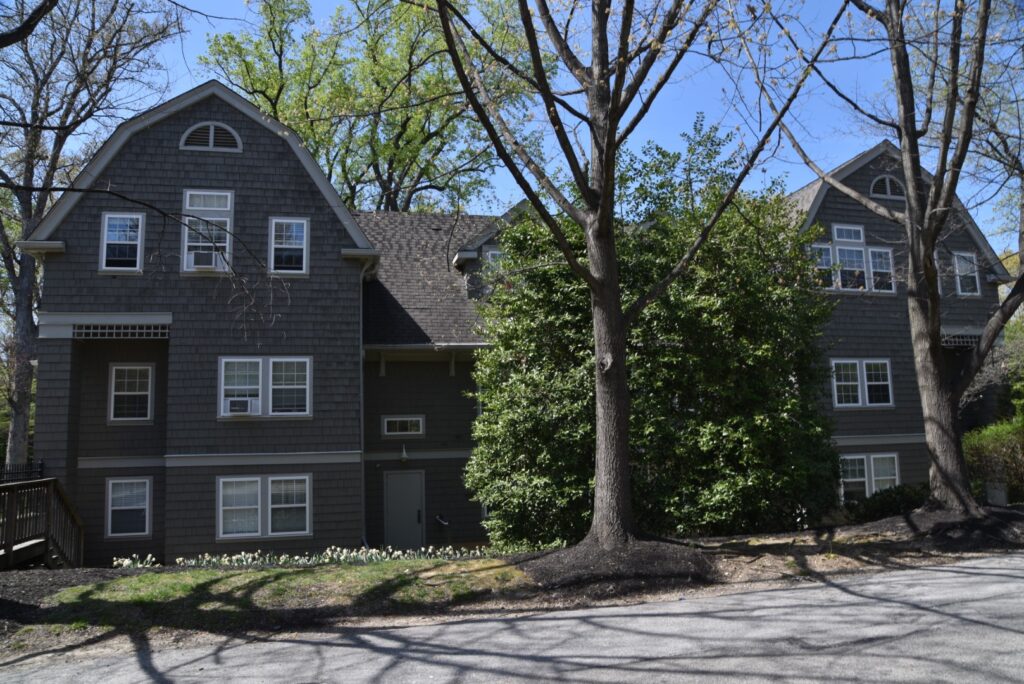
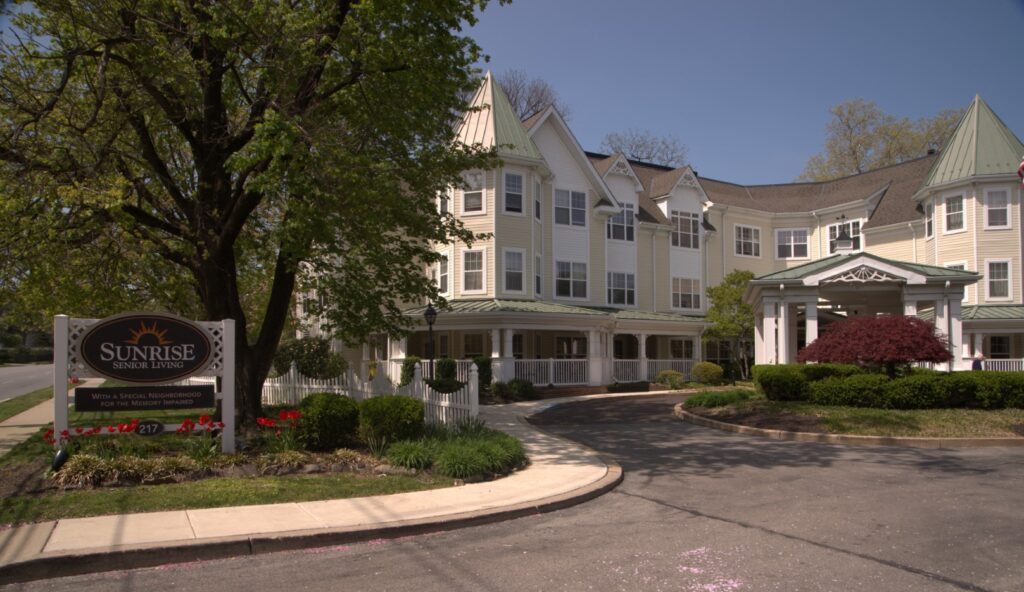
Holland Village
![]() 34.3 miles from city center — 8.82 miles to nearest hospital (Holy Redeemer Hospital)
34.3 miles from city center — 8.82 miles to nearest hospital (Holy Redeemer Hospital)
![]() 280 Middle Holland Rd, Holland, PA 18966
280 Middle Holland Rd, Holland, PA 18966
Add your location
Source: CMS Payroll-Based Journal (Q2 2025)
| Role ⓘ | Count ⓘ | Avg Shift (hrs) ⓘ | Uses Contractors? ⓘ |
|---|---|---|---|
| Registered Nurse | 47 | 7.6 | Yes |
| Licensed Practical Nurse | 17 | 8.9 | Yes |
| Certified Nursing Assistant | 84 | 7.8 | Yes |
| Role ⓘ | Employees ⓘ | Contractors ⓘ | Total Staff ⓘ | Total Hours ⓘ | Days Worked ⓘ | % of Days ⓘ | Avg Shift (hrs) ⓘ |
|---|---|---|---|---|---|---|---|
| Certified Nursing Assistant | 14 | 70 | 84 | 6,238 | 91 | 100% | 7.8 |
| Licensed Practical Nurse | 8 | 9 | 17 | 3,259 | 91 | 100% | 8.9 |
| Registered Nurse | 4 | 43 | 47 | 2,183 | 91 | 100% | 7.6 |
| Other Dietary Services Staff | 5 | 0 | 5 | 1,711 | 89 | 98% | 7.6 |
| Physical Therapy Assistant | 4 | 0 | 4 | 938 | 73 | 80% | 7.5 |
| Clinical Nurse Specialist | 2 | 0 | 2 | 880 | 66 | 73% | 9 |
| Respiratory Therapy Technician | 4 | 0 | 4 | 877 | 70 | 77% | 7.5 |
| Respiratory Therapist | 2 | 0 | 2 | 592 | 57 | 63% | 7.7 |
| Therapeutic Recreation Specialist | 2 | 0 | 2 | 505 | 65 | 71% | 7.4 |
| Qualified Activities Professional | 1 | 0 | 1 | 504 | 63 | 69% | 8 |
| Administrator | 1 | 0 | 1 | 488 | 61 | 67% | 8 |
| Nurse Practitioner | 1 | 0 | 1 | 488 | 61 | 67% | 8 |
| Mental Health Service Worker | 1 | 0 | 1 | 480 | 60 | 66% | 8 |
| Dietitian | 1 | 0 | 1 | 456 | 57 | 63% | 8 |
| Qualified Social Worker | 1 | 0 | 1 | 420 | 64 | 70% | 6.6 |
| Occupational Therapy Aide | 0 | 1 | 1 | 170 | 24 | 26% | 7.1 |
| Medical Director | 0 | 1 | 1 | 36 | 3 | 3% | 12 |
| Occupational Therapy Assistant | 0 | 1 | 1 | 28 | 3 | 3% | 9.2 |
Pennsylvania average 6.7
Last Health inspection on May 2025
Health citations are formal notices following inspections when they fail to comply with safety and care standards.
34 of 43 citations resulted from standard inspections; 8 of 43 resulted from complaint investigations; and 1 of 43 came from combined inspections (standard and complaint).
Pennsylvania average: 0.3
Pennsylvania average: 0.6
Data sourced from CMS Health Deficiencies reports. Citation severity codes range from A (least serious) to L (most serious). Immediate Jeopardy (J-L) citations indicate situations where the facility's noncompliance has placed residents at risk of death or serious harm.
Source: CMS Long-Term Care Facility Characteristics (Data as of Jan 2026)
Active councils help families stay involved in care decisions and facility operations.
These measures show how residents usually do over time at this home, based on health outcomes and preventive care.
Pennsylvania average: 11.0
Pennsylvania average: 22.2
Pennsylvania average: 19.0%
Pennsylvania average: 21.1%
Pennsylvania average: 26.7%
Pennsylvania average: 3.2%
Pennsylvania average: 5.5%
Pennsylvania average: 1.8%
Pennsylvania average: 6.6%
Pennsylvania average: 5.5%
Pennsylvania average: 17.1%
Pennsylvania average: 86.9%
Pennsylvania average: 68.8%
Pennsylvania average: 1.5%
Pennsylvania average: 68.7%
Quality measures are calculated from Minimum Data Set (MDS) assessments. For most measures, lower percentages indicate better care quality.
Federal penalties imposed by CMS for regulatory violations, including civil money penalties (fines) and denials of payment for new Medicare/Medicaid admissions.
Source: CMS Penalties Database (Data as of Jan 2026)
Pennsylvania average: $59K
Pennsylvania average: 2.1
Pennsylvania average: 0.2
Penalties are imposed by CMS for violations of federal nursing home regulations.
Last updated: Jan 2026
Historical financial and operational data for Holland Village based on CMS SNF Cost Reports.
Loading trend charts...
Care Cost Calculator: See Prices in Your Area
Nursing Home Data Explorer
Don’t Wait Too Long: 7 Red Flag Signs Your Parent Needs Assisted Living Now
The True Cost of Assisted Living in 2025 – And How Families Are Paying For It
Understanding Senior Living Costs: Pricing Models, Discounts & Financial Assistance
We help families find affordable senior communities and unlock same day discounts, Medicaid, and Medicare options tailored to your needs.
Contact us Today
Touring a community? Use this expert-backed checklist to stay organized, ask the right questions, and find the perfect fit.
We'll send you a PDF version of the touring checklist.


