Holland Village
Nursing Home, Assisted Living, Independent Living & Memory Care · Philadelphia, PA
CMS overall rating Info The Overall CMS Rating is scored from 1 to 5 stars and combines results from health inspections, staffing levels, and quality measures. Health inspections carry the most weight. Staffing and quality scores can increase or decrease the final rating based on performance compared to state and national standards.

Holland Village

Nursing Home, Assisted Living, Independent Living & Memory Care · Philadelphia, PA
CMS overall rating Info The Overall CMS Rating is scored from 1 to 5 stars and combines results from health inspections, staffing levels, and quality measures. Health inspections carry the most weight. Staffing and quality scores can increase or decrease the final rating based on performance compared to state and national standards.
Calculator: See prices in your area
Holland Village accepts Medicare and private pay.

Overview of Holland Village

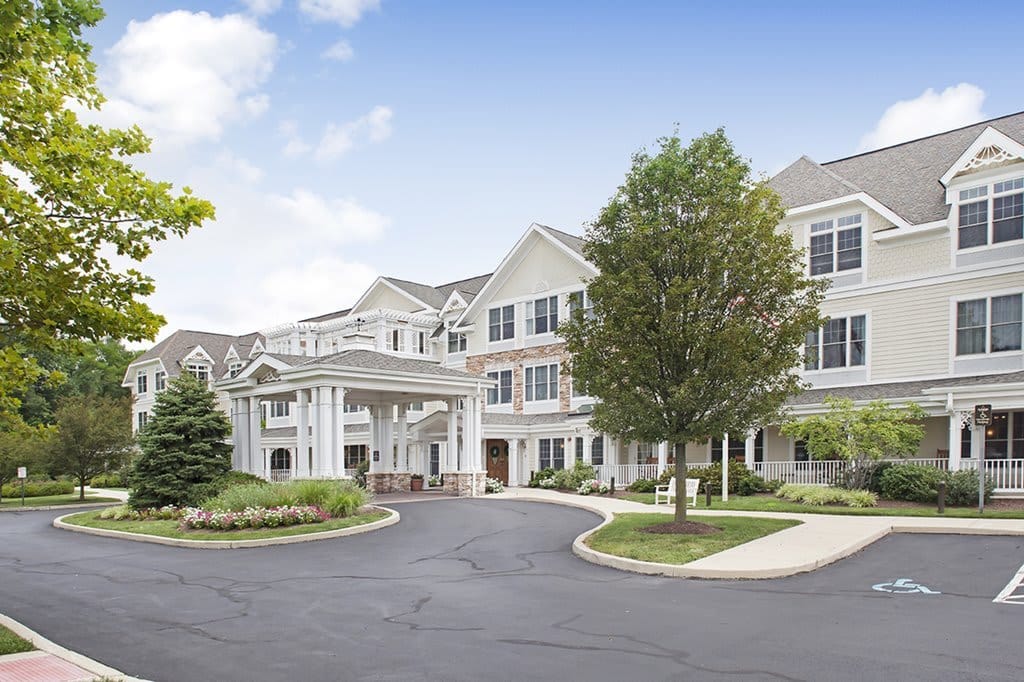
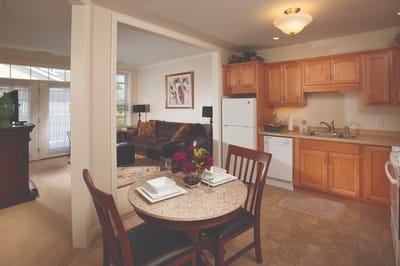
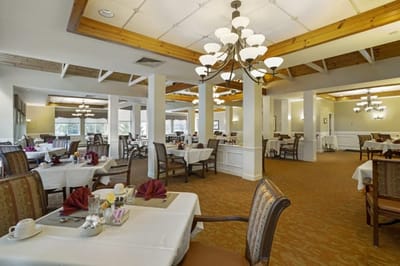
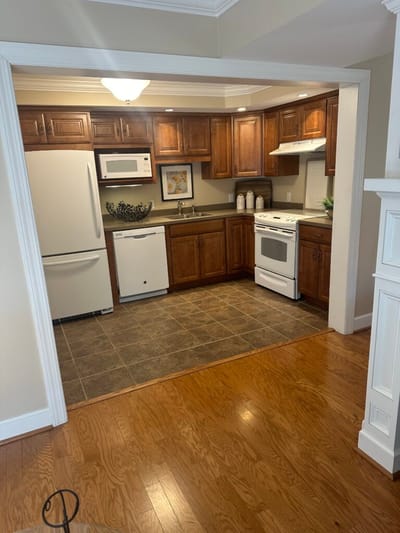
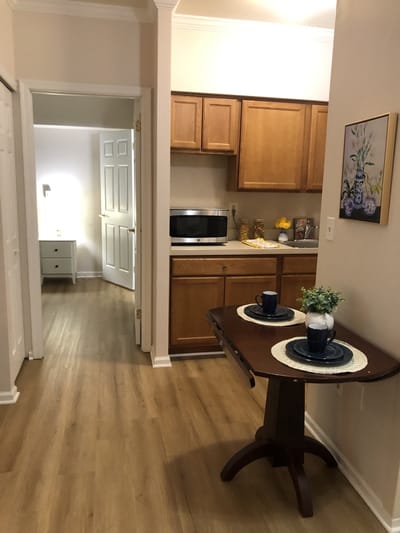
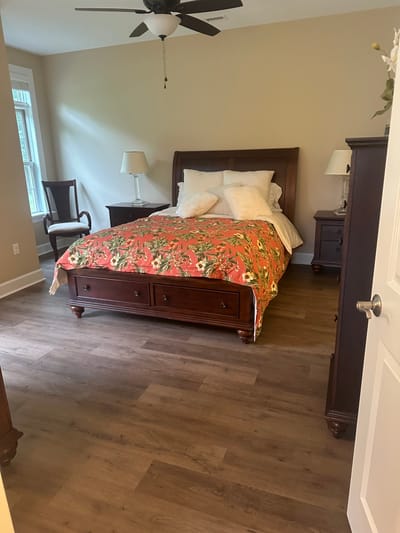
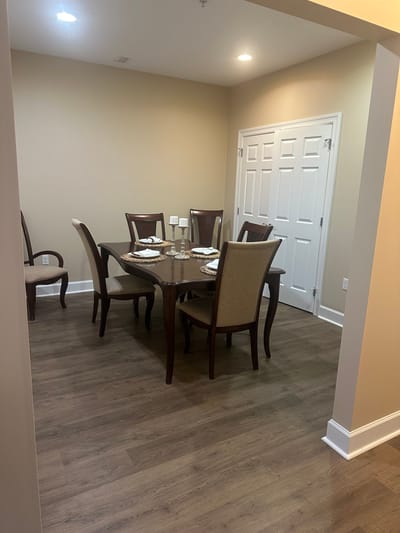
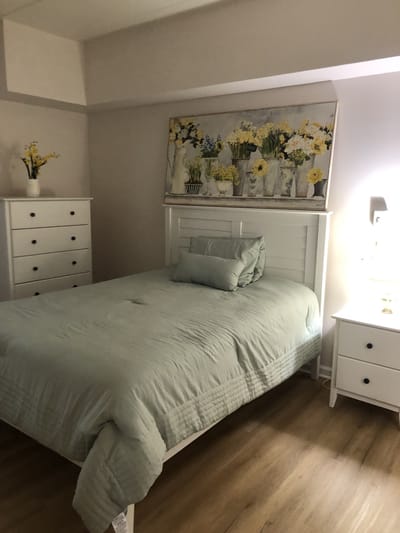
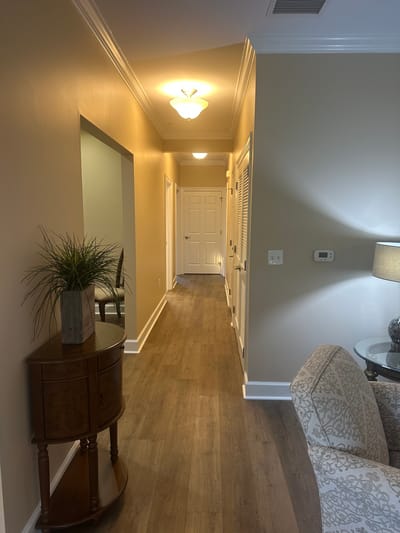
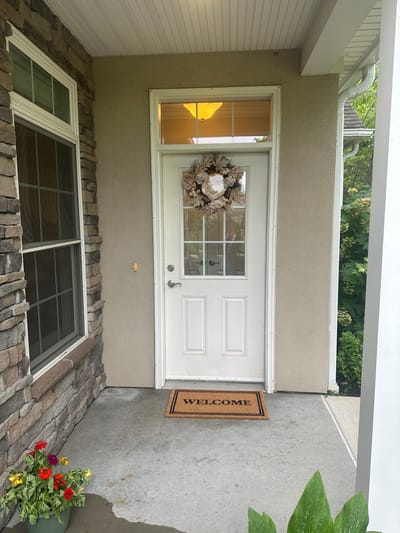
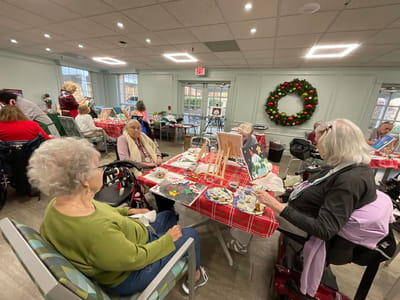
Holland Village offers independent living, assisted living, memory care, and skilled nursing where exceptional lifestyle is found in Philadelphia. They boast a nurturing and stimulating atmosphere that contribute to the respected experience discovered at Holland Village. They proudly excel with their approach in having a seamless transition for every resident; as they are a community that understands how unique their seniors are and may need specific care for every individual. Holland Village proudly welcomes all differences of every senior who comes from a variety of backgrounds. Holland Village ensures that every senior residing in their community loves the place they live. 

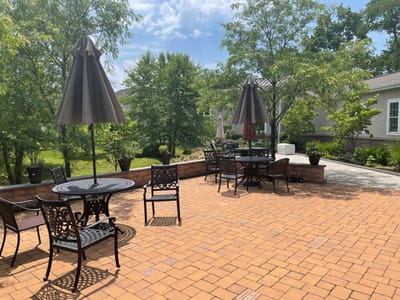
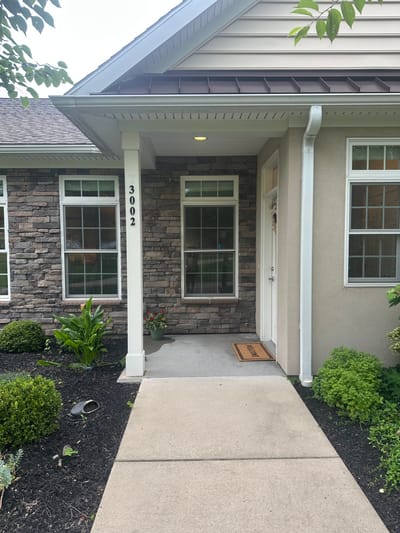
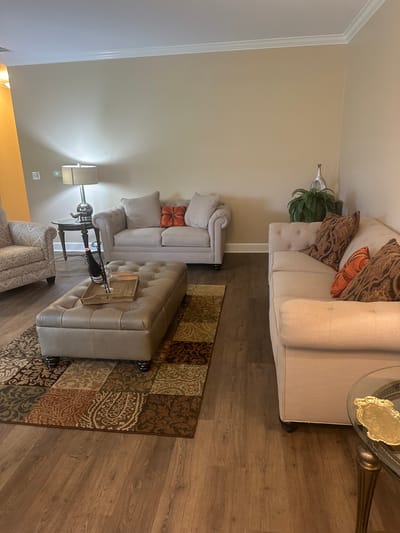
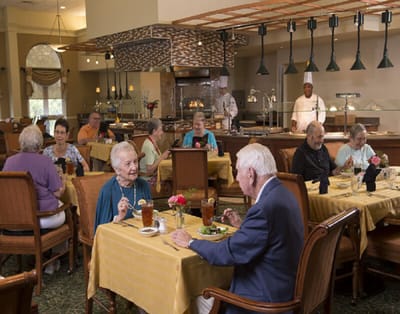
A stunning location for a serene senior living community is tucked in by neighboring nature areas; their Five-Star dining is a testimony to the savory delicious and healthy meals; a complimentary transportation for appointments, shopping, and the like; their personalized care and all-year round of activities promote a balanced lifestyle for the residents to stay active. Holland Village prides itself on the comfort and nurturing environment, which is provided and prioritized by their caring staff and the nursing home itself.

Quality ratings

Measured by Centers for Medicare & Medicaid Services (CMS)

Overall rating Info The Overall CMS Rating combines results from health inspections, staffing levels and quality measures. Health inspections carry the most weight. Staffing and quality scores can increase or decrease the final rating based on performance compared to state and national standards.
At PA avg. At PA avg.Click the badge to see the full State ranking.Click here to see the full State ranking.
Health Inspection Info Based on the results of the facility's three most recent standard inspections and any complaint investigations. CMS reviews the number, scope, and severity of deficiencies, with more recent findings weighted more heavily.
▼ 28.5% Below PA avg. ▼ 28.5% Below PA avg.Click the badge to see the full State ranking.Click here to see the full State ranking.
Staffing Info Measures average nursing staff hours per resident per day, including Registered Nurses (RNs) and total nursing staff. Ratings are adjusted based on the level of care residents require and are compared to state and national benchmarks.
▼ 11.5% Below PA avg. ▼ 11.5% Below PA avg.Click the badge to see the full State ranking.Click here to see the full State ranking.
Quality Measures Info Based on clinical and physical health indicators reported to CMS, such as hospital readmissions, falls, pressure ulcers, and improvements in mobility. These measures reflect how well residents' health needs are being managed.
▲ 47.3% Above PA avg. ▲ 47.3% Above PA avg.Click the badge to see the full State ranking.Click here to see the full State ranking.

Staffing hours breakdown

Info Daily nursing hours per resident by staff type, reported to CMS. Higher is generally better — compare this facility to state and national averages to see where staffing stands.

Hours per resident per day — compared to Pennsylvania state averages

Total nursing care / resident Info This home is ranked 109th out of 203 homes in Pennsylvania. Total adjusted nursing hours per resident per day, combining RN, LPN, and aide time. CMS adjusts this for case-mix so facilities can be fairly compared.
4h 4m per day
Rank #109 / 203Nurse hours — State benchmarkedThis home is ranked 109th out of 203 homes in Pennsylvania. Shows adjusted nurse hours per resident per day benchmarked to the Pennsylvania average, with a ranking across 203 Pennsylvania SNFs. More hours mean more direct care. The national average is about 3.5 hrs; below 3.0 is a red flag.Click the rank badge to see the full State ranking.Click here to see the full State ranking.
This facility Pennsylvania avg (4h 9m per day)
vs Pennsylvania avg
-2%

0 of 1 metrics below state avg

Staff typeHours / Day / Residentvs state avg
Weekend Total Nursing Info Combined nursing hours (RN + LPN + Nurse Aide) per resident per day on weekends. Staffing often drops on weekends — this figure reveals whether the facility maintains adequate coverage outside of weekday hours. 3h 35m per day ■ Avg State avg: 3h 32m per day · National avg: 3h 25m per day

Types of Care at Holland Village

Assisted Living Independent Living Memory Care

Capacity and availability

This home usually has availability

Lower occupancy than the Pennsylvania average: 78.7%
Occupancy rate
73.2% Rank #230 / 511Occupancy rate — State benchmarkedThis home is ranked 230th out of 511 homes in Pennsylvania. Shows this facility's occupancy rate versus the Pennsylvania average, with its Statewide rank out of 511. Higher occupancy signals strong local demand and financial stability.Click the rank badge to see the full State ranking.Click here to see the full State ranking.
Avg. Length of Stay
21 days
Walk Score
Walk Score: 8 / 100 Rank #611 / 668Walk Score — State benchmarkedThis home is ranked 611th out of 668 homes in Pennsylvania. Shows how walkable this facility's neighborhood is compared to the average Walk Score across Pennsylvania SNFs. Higher scores benefit residents, families, and staff.Click the rank badge to see the full State ranking.Click here to see the full State ranking.
Car-dependent. Most errands require a car, with limited nearby walkable options.

About this community

About the Community

Holland Village offers private suites with private bathrooms in its memory care program, along with options for private or shared suites in other areas.

Safety & Compliance

Emergency SystemsYes
Safety FeaturesAround-the-clock nursing staff, private bathrooms in suites

Therapy & Rehabilitation

3 services
Rehabilitation Services
Respite Care
Short-Term Rehab

Staffing & Medical

1 service
24-Hour Staffing

Amenities & Lifestyle

Fitness Center
Gym
Library
Dining Room
Cafe
Patio
Billiards
Transportation
Housekeeping
Wellness Center
Dining Services
Personal Care
ActivitiesHolland Village provides a monthly calendar filled with activities catering to all levels of care.
Religious ServicesYes

Pricing & Financial Information

Starting Price$2,160 per month
Entry Fee$59,000
Monthly Base Fee$2,160

Dining & Nutrition

Food DescriptionHolland Village offers on-site meals as part of its services, with flexible dining plans available.

Contact Holland Village

Staffing Data

Reporting period: October 1 – December 31, 2025 (Q4 2025). Source: CMS Payroll-Based Journal report.

Total staff 198
Employees 45
Contractors 153
Staff to resident ratio 5.50:1
200% better than Pennsylvania average
Pennsylvania average ratio: 1.83:1 Pennsylvania average ratio: 1.83:1See full Pennsylvania ranking
Avg staff/day 26
Average shift 7.8 hours
0% compared with Pennsylvania average
Pennsylvania average: 7.8 hours Pennsylvania average shift: 7.8 hoursSee full Pennsylvania ranking
Total staff hours (quarter) 18,668

Nursing staff breakdown

Q4 2025 · Oct 1 – Dec 31 More info This data comes from the CMS Payroll-Based Journal report covering October 1 – December 31, 2025.
Registered Nurse

Manages medical care and health needs.

RN Staff 41
Average shift length Info Average shift length. Calculated as total hours divided by days worked and average staff per day. 7.9 hours

This role is partially covered by contractors.

Licensed Practical Nurse

Assists with medical care and medications.

LPN Staff 29
Average shift length Info Average shift length. Calculated as total hours divided by days worked and average staff per day. 9.2 hours

This role is partially covered by contractors.

Certified Nursing Assistant

Helps with daily care and mobility.

CNA Staff 101
Average shift length Info Average shift length. Calculated as total hours divided by days worked and average staff per day. 7.7 hours

This role is partially covered by contractors.

Contractor staffing

Q4 2025 · Oct 1 – Dec 31 More info This data comes from the CMS Payroll-Based Journal report covering October 1 – December 31, 2025.

Total hours from contractors

30.7%

5,735 contractor hours this quarter

Certified Nursing Assistant: 88 Registered Nurse: 37 Licensed Practical Nurse: 24 Occupational Therapy Aide: 2 Medical Director: 1 Occupational Therapy Assistant: 1

Staff by category

Q4 2025 · Oct 1 – Dec 31 More info This data comes from the CMS Payroll-Based Journal report covering October 1 – December 31, 2025.
Certified Nursing Assistant13881016,32892100%7.7
Licensed Practical Nurse524292,78192100%9.2
Registered Nurse437412,0529199%7.9
Other Dietary Services Staff4041,3856470%7.8
Respiratory Therapy Technician4049918188%7.5
Physical Therapy Assistant3039887582%7.5
Clinical Nurse Specialist2025734852%8.8
Therapeutic Recreation Specialist2024716368%7.1
Qualified Social Worker1014476571%6.9
Administrator1014435964%7.5
Dietitian1014435964%7.5
Nurse Practitioner1014266166%7
Mental Health Service Worker1014195661%7.5
Qualified Activities Professional1014136166%6.8
Respiratory Therapist2022674145%6.5
Occupational Therapy Aide0221912830%6.5
Medical Director011361820%2
Occupational Therapy Assistant0111822%9.1
101 Certified Nursing Assistant
% of Days 100%
29 Licensed Practical Nurse
% of Days 100%
41 Registered Nurse
% of Days 99%
4 Other Dietary Services Staff
% of Days 70%
4 Respiratory Therapy Technician
% of Days 88%
3 Physical Therapy Assistant
% of Days 82%
2 Clinical Nurse Specialist
% of Days 52%
2 Therapeutic Recreation Specialist
% of Days 68%
1 Qualified Social Worker
% of Days 71%
1 Administrator
% of Days 64%
1 Dietitian
% of Days 64%
1 Nurse Practitioner
% of Days 66%
1 Mental Health Service Worker
% of Days 61%
1 Qualified Activities Professional
% of Days 66%
2 Respiratory Therapist
% of Days 45%
2 Occupational Therapy Aide
% of Days 30%
1 Medical Director
% of Days 20%
1 Occupational Therapy Assistant
% of Days 2%

Penalties and fines

Includes penalties issued in 2024

Federal penalties imposed by CMS for regulatory violations, including civil money penalties (fines) and denials of payment for new Medicare/Medicaid admissions.

Source: CMS Penalties Database (Data as of Jan 2026)

Total fines amount $36K Rank #183 / 206Federal fines — State benchmarkedThis home is ranked 183rd out of 206 homes in Pennsylvania. Shows this facility's cumulative CMS federal fine dollars versus the Pennsylvania average among facilities with fines, and where it ranks among 206 skilled nursing facilities in the pool. Lower total dollars mean a better rank.Click the rank badge to see the full State ranking.Click here to see the full State ranking.
39% lower than Pennsylvania average

Pennsylvania average: $59K

Number of fines 1
52% fewer fines than Pennsylvania average

Pennsylvania average: 2.1

Payment Denials Info Serious action where Medicare and/or Medicaid temporarily stops payments for new residents until issues are fixed. 0
100% fewer payment denials than Pennsylvania average

Pennsylvania average: 0.2

Fines amount comparison
This facility $36K
Pennsylvania average $59K
Penalty History

Penalties are imposed by CMS for violations of federal nursing home regulations.

1 penalty in the past 3 years

Jul 12, 2024 · $36K

Civil Money Penalty Info Fines imposed for noncompliance, which can be assessed per day or per instance of violation. Jul 12, 2024
$36K

Last updated: Jan 2026

Quality of care over time

These measures show how residents usually do over time at this home, based on health outcomes and preventive care.

High-risk clinical events score Info A composite score based on pressure ulcers, falls with injury, weight loss, walking ability decline, and activities of daily living decline. 7.3
34% better than Pennsylvania average

Pennsylvania average: 11.0

Functional decline score Info A composite score based on activities of daily living decline, walking ability decline, and incontinence. 6.7
70% better than Pennsylvania average

Pennsylvania average: 22.2

Long-stay resident measures
Need for Help with Daily Activities Increased Info Percent of long-stay residents whose need for help with daily activities has increased 0.0%
100% better than Pennsylvania average

Pennsylvania average: 19.0%

Walking Ability Worsened Info Percent of long-stay residents whose ability to move independently worsened 0.0%
100% better than Pennsylvania average

Pennsylvania average: 21.1%

Low Risk Residents with Bowel/Bladder Incontinence Info Percent of low risk long-stay residents who lose control of their bowels or bladder 20.2%
25% better than Pennsylvania average

Pennsylvania average: 26.7%

Falls with Major Injury Info Percent of long-stay residents experiencing one or more falls with major injury 0.0%
100% better than Pennsylvania average

Pennsylvania average: 3.2%

High Risk Residents with Pressure Ulcers Info Percent of long-stay high risk residents with pressure ulcers 13.8%
151% worse than Pennsylvania average

Pennsylvania average: 5.5%

Urinary Tract Infection Info Percent of long-stay residents with a urinary tract infection 0.0%
100% better than Pennsylvania average

Pennsylvania average: 1.8%

Lost Too Much Weight Info Percent of long-stay residents who lose too much weight 22.5%
239% worse than Pennsylvania average

Pennsylvania average: 6.6%

Depressive Symptoms Info Percent of long-stay residents who have depressive symptoms 5.8%
5% worse than Pennsylvania average

Pennsylvania average: 5.5%

Antipsychotic Use Info Percent of long-stay residents who received an antipsychotic medication 2.0%
88% better than Pennsylvania average

Pennsylvania average: 17.1%

Pneumococcal Vaccine Info Percent of long-stay residents assessed and appropriately given the pneumococcal vaccine 88.1%
In line with Pennsylvania average

Pennsylvania average: 86.9%

Short-stay resident measures
Pneumococcal Vaccine Info Percent of short-stay residents assessed and appropriately given the pneumococcal vaccine 75.8%
10% better than Pennsylvania average

Pennsylvania average: 68.8%

Antipsychotic medication increase Info Percent of short-stay residents who newly received an antipsychotic medication 0.0%
100% better than Pennsylvania average

Pennsylvania average: 1.5%

Influenza Vaccine Info Percent of short-stay residents assessed and appropriately given the seasonal influenza vaccine 94.6%
38% better than Pennsylvania average

Pennsylvania average: 68.7%

Breakdown by payment type

Medicare

96% of new residents, usually for short-term rehab.

Typical stay 9 days

Private pay

4% of new residents, often for short stays.

Typical stay 9 - 10 months

Facility Characteristics

Source: CMS Long-Term Care Facility Characteristics (Data as of Jan 2026)

Total residents 36
Medicare
8
22.2% of residents
Private pay or other
28
77.8% of residents
Programs & Services
Residents Group

Residents meet regularly to discuss policies, care quality, and activities

CCRC

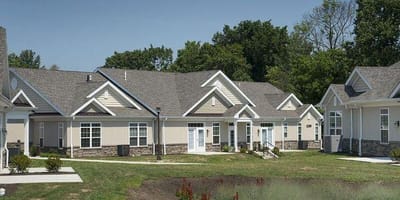
Part of a Continuing Care Retirement Community offering multiple care levels

Active Resident Council

Organized group of residents that meets regularly to discuss facility policies, quality of life, and activities.

Finances and operations

Privately-owned community
Operated by a partnership between two or more business owners.
Home revenue
$12.7M
Operating loss
-$2.9M
Privately-owned community Operated by a partnership between two or more business owners.
Home revenue
$12.7M Rank #165 / 205Revenue — State benchmarkedThis home is ranked 165th out of 205 homes in Pennsylvania. Shows this facility's annual revenue compared to the Pennsylvania SNF average. Higher revenue generally means more resources for staffing and capital — read alongside Payroll %.Click the rank badge to see the full State ranking.Click here to see the full State ranking.
Operating loss
-$2.9M
Payroll costs Info The portion of the home's budget spent on staff, including nurses, caregivers, and other employees who support care and operations. Rank #147 / 205Payroll — State benchmarkedThis home is ranked 147th out of 205 homes in Pennsylvania. Shows total annual staff payroll benchmarked to the Pennsylvania average. Higher payroll investment relative to peers often signals better staffing and less reliance on cheaper contract labor.Click the rank badge to see the full State ranking.Click here to see the full State ranking.
$7.5M
59.2% of revenue Rank #30 / 205Payroll % — State benchmarkedThis home is ranked 30th out of 205 homes in Pennsylvania. Shows payroll as a percentage of revenue versus the Pennsylvania average. Well-run Pennsylvania SNFs typically land around 53–61% — the top third Statewide. Below 25% may signal understaffing or heavy agency use — read with Staffing ratings.Click the rank badge to see the full State ranking.Click here to see the full State ranking.
Other operating costs Info All remaining costs needed to run the home, such as food, utilities, building maintenance, supplies and administrative expenses.
$8.0M
Total costs $15.6M

What does this home offer?

Pets allowed icon
Pets allowed icon

Pets Allowed

Transportation services icon

Transportation Services

Who this home usually serves

TYPE OF STAY

Mostly short-term rehab stays

Most residents typically stay for a few weeks or months before returning home or moving on.

Living Spaces & Floor Plans for Holland Village

Floor plan
Floor Plan
Floor plan
Floor Plan
Floor plan
Floor Plan
floor plan
Floor Plan
floor plan
Floor Plan
floor plans
Floor Plans
Floor plan
Floor Plan
floor plans
Floor Plans

Places of interest near Holland Village

Address 34.3 miles from city center Info Estimated distance in miles from Holland's city center to Holland Village's address, calculated via Google Maps. — 8.82 miles to nearest hospital (Holy Redeemer Hospital)

Calculate Travel Distance to Holland Village

Add your location

Address

Financial Assistance for
Nursing Home in Pennsylvania

Holland Village is located in Holland, Pennsylvania.
Here are the financial assistance programs available to residents in Pennsylvania.

Get Financial aid guidance

Community HealthChoices (CHC)

PA Medicaid CHC

Age 65+ or disabled
General Pennsylvania resident, Medicaid-eligible, nursing home-level care need.
Income Limits (2025) ~$2,829/month 300% FBR, individual
Asset Limits $2,000 (individual), $3,000 (couple) (excludes home, car).
PA

Managed care model; high urban demand (e.g., Philadelphia, Pittsburgh).

Benefits
Personal care (5-7 hours/day, e.g., bathing, dressing) Respite care (up to 240 hours/year) Adult day care ($70/day) Home modifications ($1,500 avg.)

Pennsylvania OPTIONS Program

PA OPTIONS

Age 60+
General Pennsylvania resident, at risk of nursing home placement.
Income Limits ~$2,000/month individual, varies by region
Asset Limits $8,000 individual
PA

Cost-sharing required above certain income; rural/urban balance.

Benefits
In-home care (3-5 hours/week) Respite (up to 10 days/year) Adult day care (~$70/day) Transportation (~5 trips/month)

Living Independence for the Elderly (LIFE)

Pennsylvania LIFE (PACE)

Age 55+
General PA resident (specific counties), NFLOC, safe with LIFE support.
Income Limits (2025) ~$2,829/month (Medicaid-eligible); private pay option available.
Asset Limits $2,000 (individual), $3,000 (couple) for Medicaid enrollees.
PA

16 providers in 25 counties (e.g., Allegheny, Luzerne); LIFE branding unique to PA.

Benefits
Personal care (5-7 hours/day) Medical care Meals Transportation Respite Therapies

Medicare Savings Program (MSP)

Pennsylvania Medicare Savings Program

Age 65+ or disabled
General PA resident, Medicare Part A/B.
Income Limits (2025) ~$2,510/month (QMB), ~$3,380/month (SLMB), ~$3,598/month (QI)—individual.
Asset Limits $9,430 (individual), $14,130 (couple).
PA

Three tiers; includes Extra Help for Part D; no waitlist.

Benefits
Covers Part B premiums ($174.70/month) Deductibles ($240/year) Copays (~20%)

Family Caregiver Support Program (FCSP)

Pennsylvania Family Caregiver Support Program

Age
General Caregivers of 60+ needing care or 55+ caregivers of others; PA resident; functional needs (2+ ADLs).
Income Limits (2025) No strict cap; reimbursements up to $600/month if care recipient income < ~$2,322/month 185% FPL
Asset Limits Not assessed; need-based.
PA

High demand; includes grandparent caregivers.

Benefits
Respite (4-6 hours/week or 5 days/year) Adult day care ($60/day) Supplies (~$2,000/year) Caregiver training

VA Aid and Attendance (A&A) and Housebound Benefits

Pennsylvania VA Aid and Attendance/Housebound

Age 65+ or disabled veteran/spouse
General PA resident, wartime service, need for ADL help (A&A) or homebound.
Income Limits (2025) Net income < ~$1,984/month (veteran with dependent, A&A); pension offsets income.
Asset Limits ~$155,356 net worth limit
PA

High veteran population; supports rural/urban care needs.

Benefits
Cash (~$1,433-$2,642/month veteran, ~$951-$1,318 spouse) for care costs (e.g., in-home, assisted living)

Property Tax/Rent Rebate Program (PTRR)

Pennsylvania Property Tax/Rent Rebate Program

Age 65+
General PA resident, homeowner/renter (or widow/er 50+, disabled 18+).
Income Limits (2025) ~$45,000/year individual or couple, excludes half of Social Security
Asset Limits Not assessed; income-focused.
PA

Rebates up to $1,000; ~600,000 eligible annually.

Benefits
Rebates ($250-$1,000 based on income; e.g., $1,000 if income < $8,000)

Senior Farmers’ Market Nutrition Program (SFMNP)

Pennsylvania SFMNP

Age 60+
General PA resident, low-income.
Income Limits (2025) ~$2,322/month individual, 185% FPL
Asset Limits Not assessed.
PA

Vouchers (~$50/season) via 52 AAAs; serves ~200,000 annually.

Benefits
Vouchers (~$50/season) for fresh produce at approved markets

Frequently Asked Questions about Holland Village

What neighborhood is Holland Village in?

Holland Village is in the Southampton neighborhood.

Is Holland Village in a walkable area?

Holland Village has a walk score of 8. Car-dependent. Most errands require a car, with limited nearby walkable options.

Does Holland Village have different floorplan options?

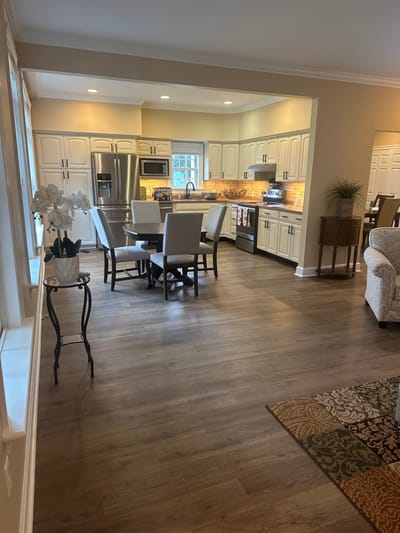
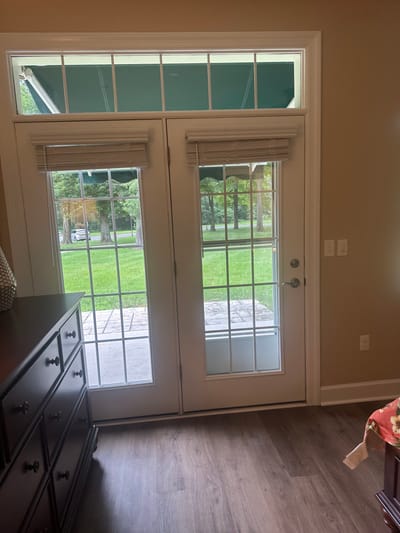
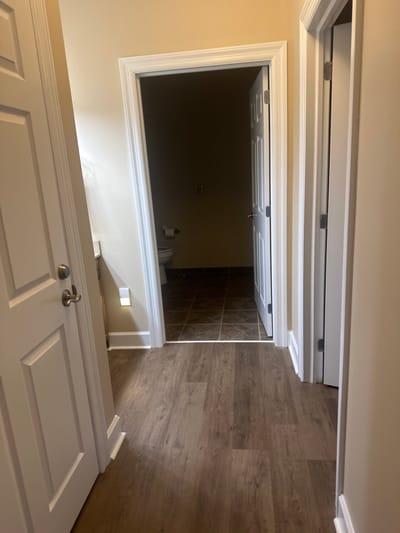
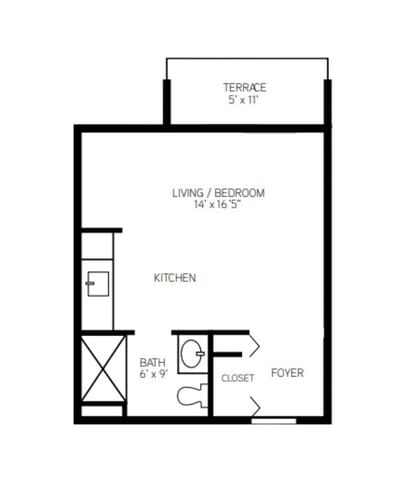
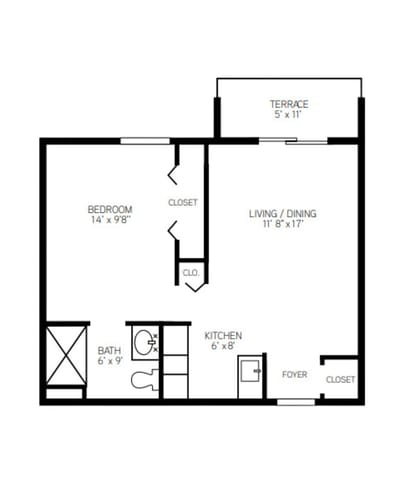
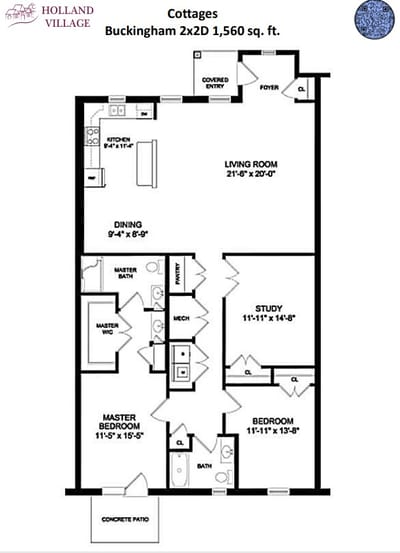
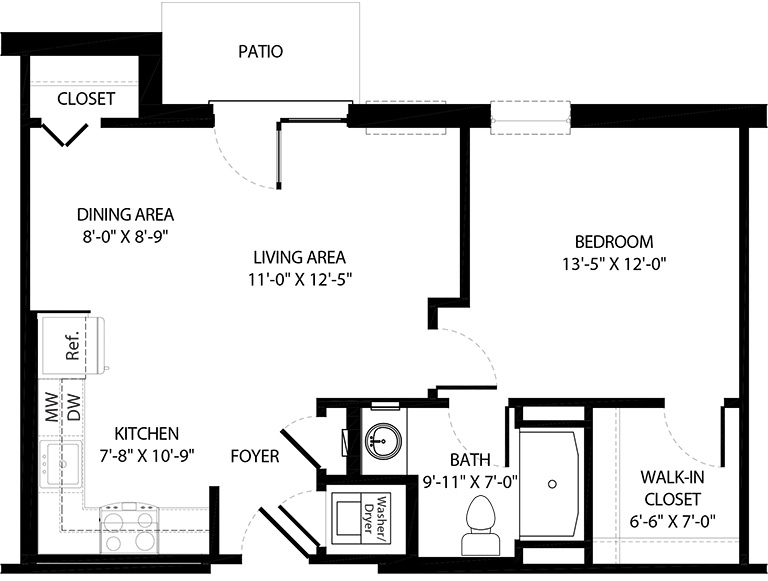
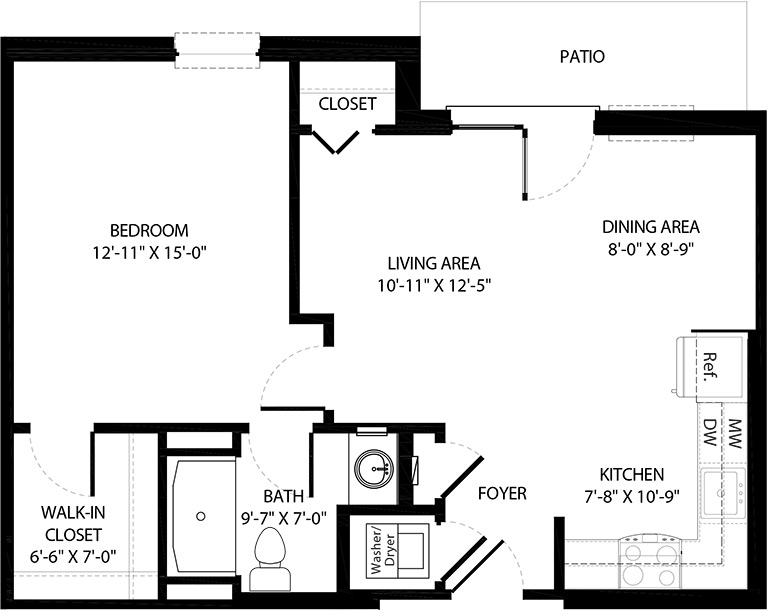
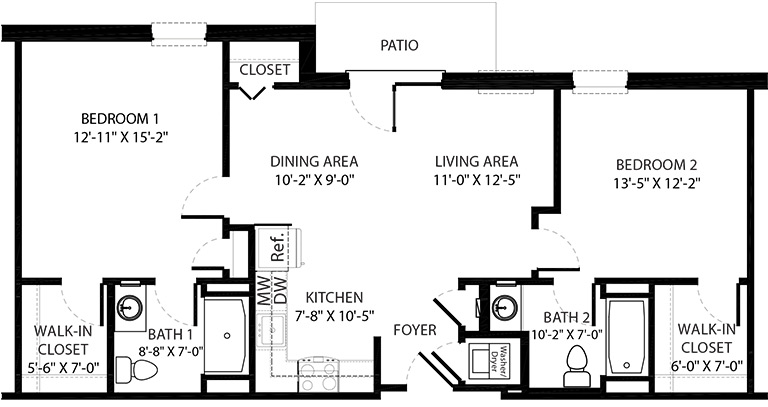
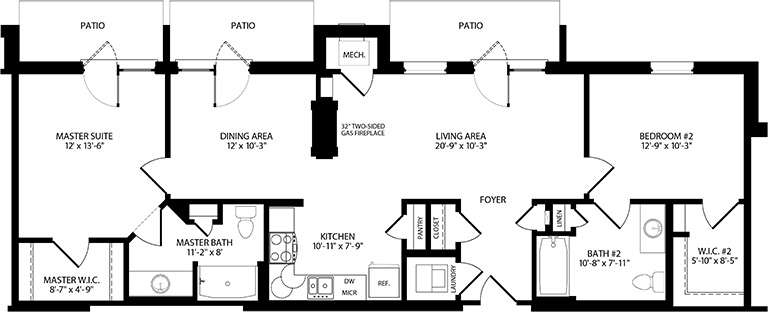
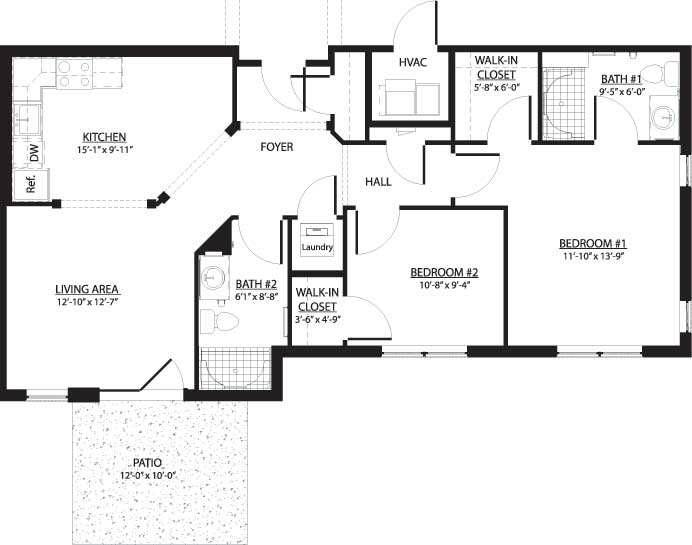
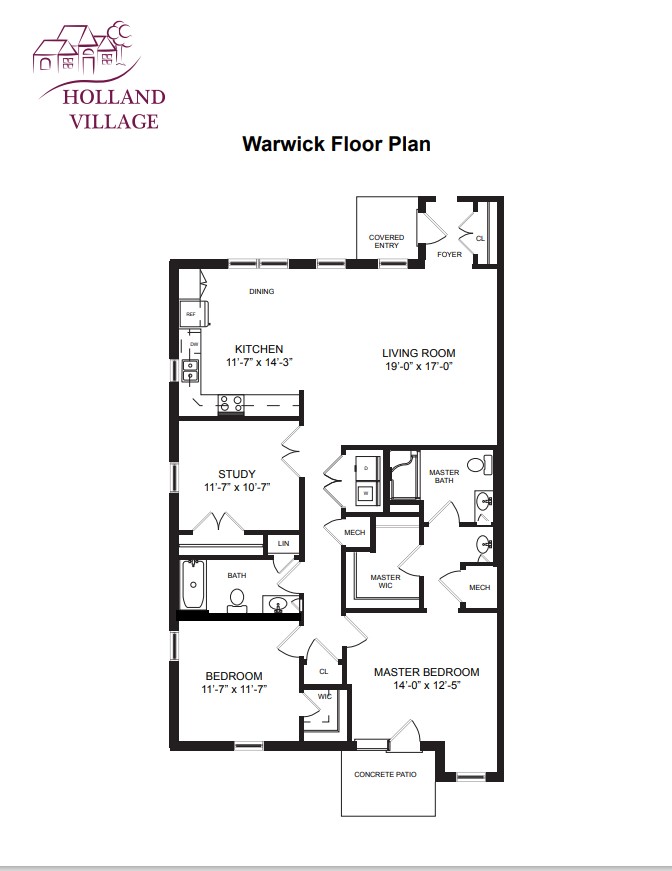
Yes — see the floorplan options available at Holland Village on this page.

Are there photos of Holland Village?

Yes — there are 34 photos of Holland Village in the photo gallery on this page.

What is the phone number of Holland Village?

(215) 322-6100 will put you in contact with the team at Holland Village.

Is Holland Village Medicare or Medicaid certified?

Yes — Holland Village is a CMS-certified provider of Medicare and Medicaid.

Guides for Better Senior Living

Care Cost Calculator: See Prices in Your Area

Nursing Home Data Explorer

Don’t Wait Too Long: 7 Red Flag Signs Your Parent Needs Assisted Living Now

The True Cost of Assisted Living in 2025 – And How Families Are Paying For It

Understanding Senior Living Costs: Pricing Models, Discounts & Financial Assistance

Explore Open Rooms
1 Contact details
2 What type of senior care service are you looking for?
3 What budget do you have in mind for senior care?
4 How soon do you need to find care?
5 Additional details

Thank you for your interest!

Our team will be in touch shortly to help with next steps.