Holly Heights Nursing Care Center
Nursing Home · Denver, CO
CMS overall rating Info The Overall CMS Rating is scored from 1 to 5 stars and combines results from health inspections, staffing levels, and quality measures. Health inspections carry the most weight. Staffing and quality scores can increase or decrease the final rating based on performance compared to state and national standards.

Holly Heights Nursing Care Center

Nursing Home · Denver, CO
CMS overall rating Info The Overall CMS Rating is scored from 1 to 5 stars and combines results from health inspections, staffing levels, and quality measures. Health inspections carry the most weight. Staffing and quality scores can increase or decrease the final rating based on performance compared to state and national standards.
Calculator: See prices in your area
Holly Heights Nursing Care Center accepts Medicare, Medicaid, and private pay.

Overview of Holly Heights Nursing Care Center

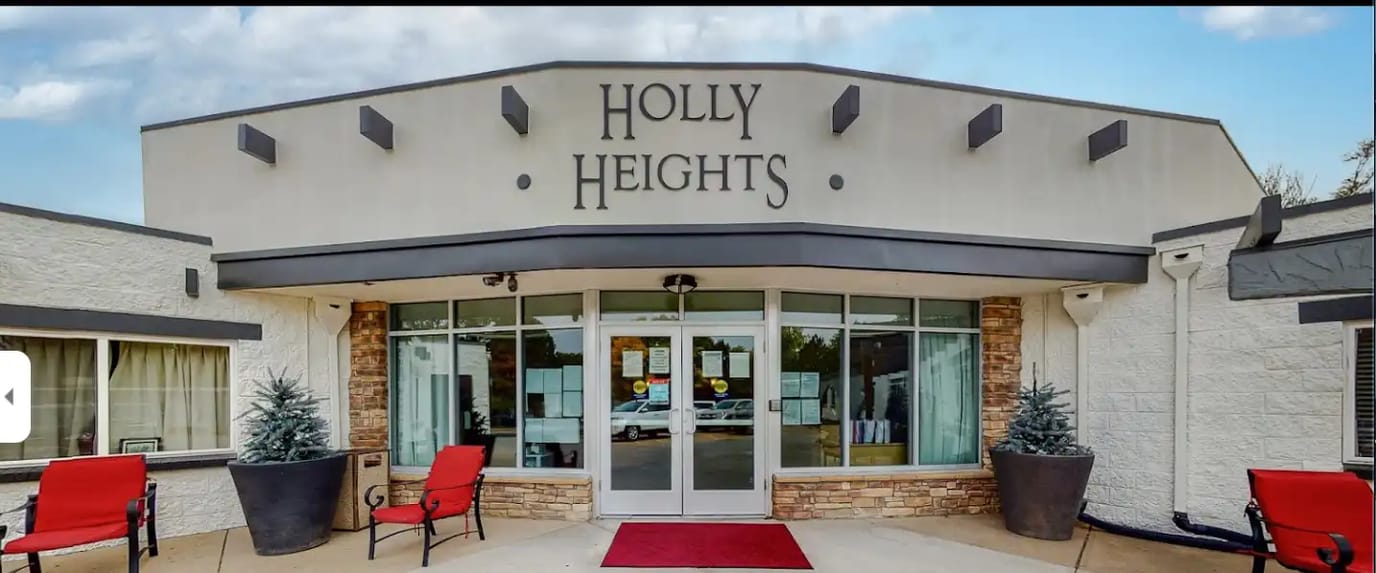
Located in Denver, Colorado, Holly Heights Care Center is dedicated to offering a warm and comforting assisted living experience to all its residents. During the transition from a family home to a nursing facility, their team goes above and beyond to ensure your loved one feels welcomed and at ease. With a focus on fostering strong relationships among staff and residents, the seniors in this assisted living community are embraced with happiness. 
At Holly Heights Care Center, a comprehensive range of on-site services caters to the physical and emotional needs of the residents. For those recovering from injuries or illnesses, the skilled nursing facility provides specialized rehabilitation therapy to aid in their journey towards recovery. Moreover, the community organizes an array of enjoyable and rejuvenating activities, including bingo, gardening, and church services, promoting an engaging and vibrant lifestyle for all residents.

Quality ratings

Measured by Centers for Medicare & Medicaid Services (CMS)

Overall rating Info The Overall CMS Rating combines results from health inspections, staffing levels and quality measures. Health inspections carry the most weight. Staffing and quality scores can increase or decrease the final rating based on performance compared to state and national standards.
▼ 36.4% Below CO avg. ▼ 36.4% Below CO avg.Click the badge to see the full State ranking.Click here to see the full State ranking.
Health Inspection Info Based on the results of the facility's three most recent standard inspections and any complaint investigations. CMS reviews the number, scope, and severity of deficiencies, with more recent findings weighted more heavily.
▼ 27.8% Below CO avg. ▼ 27.8% Below CO avg.Click the badge to see the full State ranking.Click here to see the full State ranking.
Staffing Info Measures average nursing staff hours per resident per day, including Registered Nurses (RNs) and total nursing staff. Ratings are adjusted based on the level of care residents require and are compared to state and national benchmarks.
▼ 67.1% Below CO avg. ▼ 67.1% Below CO avg.Click the badge to see the full State ranking.Click here to see the full State ranking.
Quality Measures Info Based on clinical and physical health indicators reported to CMS, such as hospital readmissions, falls, pressure ulcers, and improvements in mobility. These measures reflect how well residents' health needs are being managed.
▲ 20.5% Above CO avg. ▲ 20.5% Above CO avg.Click the badge to see the full State ranking.Click here to see the full State ranking.

Staffing hours breakdown

Info Daily nursing hours per resident by staff type, reported to CMS. Higher is generally better — compare this facility to state and national averages to see where staffing stands.

Hours per resident per day — compared to Colorado state averages

Total nursing care / resident Info This home is ranked 147th out of 177 homes in Colorado. Total adjusted nursing hours per resident per day, combining RN, LPN, and aide time. CMS adjusts this for case-mix so facilities can be fairly compared.
2h 57m per day
Rank #147 / 177Nurse hours — State benchmarkedThis home is ranked 147th out of 177 homes in Colorado. Shows adjusted nurse hours per resident per day benchmarked to the Colorado average, with a ranking across 177 Colorado SNFs. More hours mean more direct care. The national average is about 3.5 hrs; below 3.0 is a red flag.Click the rank badge to see the full State ranking.Click here to see the full State ranking.
This facility Colorado avg (3h 52m per day)
vs Colorado avg
-24%

5 of 6 metrics below state avg

Staff typeHours / Day / Residentvs state avg
Registered Nurse (RN) Info RNs hold the highest nursing license and can assess residents, interpret test results, and direct care plans. More RN hours per day often signals stronger clinical oversight and faster response to health changes. 35m per day ▼ 30% State avg: 50m per day · National avg: 41m per day
LPN / LVN Info Licensed Practical Nurses (LPNs) or Licensed Vocational Nurses (LVNs) deliver routine hands-on care — medication administration, wound dressing, and monitoring vital signs. They work under RN supervision and make up a large share of daily bedside care. 42m per day ■ Avg State avg: 41m per day · National avg: 52m per day
Nurse Aide Info Certified Nurse Aides (CNAs) provide the most direct day-to-day assistance: bathing, dressing, feeding, and mobility. Nurse aide hours are typically the largest staffing category and directly affect residents' quality of life. 1h 31m per day ▼ 32% State avg: 2h 13m per day · National avg: 2h 21m per day
Total Nursing (Weekend) Info Combined nursing hours (RN + LPN + Nurse Aide) per resident per day on weekends. Staffing often drops on weekends — this figure reveals whether the facility maintains adequate coverage outside of weekday hours. 2h 41m per day ▼ 18% State avg: 3h 17m per day · National avg: 3h 26m per day
Physical Therapist Info Hours per resident per day provided by licensed Physical Therapists (PTs) or PT Assistants. PT services help residents recover mobility after injury or illness and are especially important for post-acute (short-stay) rehabilitation. 3m per day ▼ 40% State avg: 5m per day · National avg: 4m per day
RN (Weekend) Info Registered nurse hours specifically on weekends. Facilities sometimes reduce RN presence on Saturdays and Sundays — a low weekend RN figure compared to weekday hours can indicate reduced clinical oversight when most administrative staff are absent. 30m per day ▼ 17% State avg: 36m per day · National avg: 29m per day

Capacity and availability

This home usually has availability

Occupancy lower than 85% suggests more openings may be available.

Lower occupancy than the Colorado average: 76.5%
Occupancy rate 69.7% Rank #126 / 182Occupancy rate — State benchmarkedThis home is ranked 126th out of 182 homes in Colorado. Shows this facility's occupancy rate versus the Colorado average, with its Statewide rank out of 182. Higher occupancy signals strong local demand and financial stability.Click the rank badge to see the full State ranking.Click here to see the full State ranking.
Avg. Length of Stay 143 days
Occupancy rate
69.7% Rank #126 / 182Occupancy rate — State benchmarkedThis home is ranked 126th out of 182 homes in Colorado. Shows this facility's occupancy rate versus the Colorado average, with its Statewide rank out of 182. Higher occupancy signals strong local demand and financial stability.Click the rank badge to see the full State ranking.Click here to see the full State ranking.
Avg. Length of Stay
143 days
Walk Score
Walk Score: 71 / 100 Rank #60 / 187Walk Score — State benchmarkedThis home is ranked 60th out of 187 homes in Colorado. Shows how walkable this facility's neighborhood is compared to the average Walk Score across Colorado SNFs. Higher scores benefit residents, families, and staff.Click the rank badge to see the full State ranking.Click here to see the full State ranking.
Very walkable. Most errands can be accomplished on foot, and many essentials are within a short walk.

About this community

Payment & Insurance

2 services
Accept Medicaid
Accept Medicare

Therapy & Rehabilitation

2 services
Rehabilitation Services
Short-Term Rehab

Staffing & Medical

2 services
Doctor on Staff
24-Hour Staffing

Additional Services

1 service
Short-Term Rehabilitation

Amenities & Lifestyle

Specific ProgramsIn-House Therapy, Stay Active

Dining & Nutrition

Food DescriptionNutritious satisfying menus are provided.

Contact Holly Heights Nursing Care Center

Staffing Data

Reporting period: October 1 – December 31, 2025 (Q4 2025). Source: CMS Payroll-Based Journal report.

Total staff 210
Employees 92
Contractors 118
Staff to resident ratio 2.04:1
7% better than Colorado average
Colorado average ratio: 1.91:1 Colorado average ratio: 1.91:1See full Colorado ranking
Avg staff/day 42
Average shift 8.6 hours
0% compared with Colorado average
Colorado average: 8.3 hours Colorado average shift: 8.3 hoursSee full Colorado ranking
Total staff hours (quarter) 33,103

Nursing staff breakdown

Q4 2025 · Oct 1 – Dec 31 More info This data comes from the CMS Payroll-Based Journal report covering October 1 – December 31, 2025.
Registered Nurse

Manages medical care and health needs.

Total count 20
Average shift length Info Average shift length. Calculated as total hours divided by days worked and average staff per day. 10 hours

This role is partially covered by contractors.

Licensed Practical Nurse

Assists with medical care and medications.

Total count 57
Average shift length Info Average shift length. Calculated as total hours divided by days worked and average staff per day. 9.6 hours

This role is partially covered by contractors.

Certified Nursing Assistant

Helps with daily care and mobility.

Total count 99
Average shift length Info Average shift length. Calculated as total hours divided by days worked and average staff per day. 8.2 hours

This role is partially covered by contractors.

Contractor staffing

Q4 2025 · Oct 1 – Dec 31 More info This data comes from the CMS Payroll-Based Journal report covering October 1 – December 31, 2025.

Total hours from contractors

6.2%

2,062 contractor hours this quarter

Certified Nursing Assistant: 65 Licensed Practical Nurse: 47 Registered Nurse: 4 Feeding Assistant: 1 Medical Director: 1

Staff by category

Q4 2025 · Oct 1 – Dec 31 More info This data comes from the CMS Payroll-Based Journal report covering October 1 – December 31, 2025.
Certified Nursing Assistant34659915,08892100%8.2
Licensed Practical Nurse1047575,33292100%9.6
Registered Nurse164204,51692100%10
Dental Services Staff3031,5117076%8
RN Director of Nursing2021,1318087%8.6
Other Dietary Services Staff2028947683%7.8
Nurse Practitioner1015946672%9
Administrator1015286672%8
Occupational Therapy Aide1015275459%9.8
Dietitian1015256874%7.7
Physical Therapy Assistant2024846368%7.5
Physical Therapy Aide2024836672%6.7
Speech Language Pathologist1014586166%7.5
Respiratory Therapy Technician2024276065%7.1
Qualified Social Worker8082874751%5.5
Clinical Nurse Specialist5052622830%7.5
Feeding Assistant0113255%6.3
Nurse Aide in Training1011533%5.1
Medical Director0119910%1
99 Certified Nursing Assistant
% of Days 100%
57 Licensed Practical Nurse
% of Days 100%
20 Registered Nurse
% of Days 100%
3 Dental Services Staff
% of Days 76%
2 RN Director of Nursing
% of Days 87%
2 Other Dietary Services Staff
% of Days 83%
1 Nurse Practitioner
% of Days 72%
1 Administrator
% of Days 72%
1 Occupational Therapy Aide
% of Days 59%
1 Dietitian
% of Days 74%
2 Physical Therapy Assistant
% of Days 68%
2 Physical Therapy Aide
% of Days 72%
1 Speech Language Pathologist
% of Days 66%
2 Respiratory Therapy Technician
% of Days 65%
8 Qualified Social Worker
% of Days 51%
5 Clinical Nurse Specialist
% of Days 30%
1 Feeding Assistant
% of Days 5%
1 Nurse Aide in Training
% of Days 3%
1 Medical Director
% of Days 10%

Penalties and fines

Includes penalties issued in 2023-2025

Federal penalties imposed by CMS for regulatory violations, including civil money penalties (fines) and denials of payment for new Medicare/Medicaid admissions.

Source: CMS Penalties Database (Data as of Jan 2026)

Total fines amount $20K Rank #107 / 182Federal fines — State benchmarkedThis home is ranked 107th out of 182 homes in Colorado. Shows this facility's cumulative CMS federal fine dollars versus the Colorado average among facilities with fines, and where it ranks among 182 skilled nursing facilities in the pool. Lower total dollars mean a better rank.Click the rank badge to see the full State ranking.Click here to see the full State ranking.
48% lower than Colorado average

Colorado average: $40K

Number of fines 2
10% fewer fines than Colorado average

Colorado average: 2.2

Payment Denials Info Serious action where Medicare and/or Medicaid temporarily stops payments for new residents until issues are fixed. 0
100% fewer payment denials than Colorado average

Colorado average: 0.3

Fines amount comparison
This facility $20K
Colorado average $40K
Penalty History

Penalties are imposed by CMS for violations of federal nursing home regulations.

2 penalties in the past 3 years

Multiple penalties were reported in the last 3 years.

Civil Money Penalty Info Fines imposed for noncompliance, which can be assessed per day or per instance of violation. Jun 11, 2025
$14K
Civil Money Penalty Info Fines imposed for noncompliance, which can be assessed per day or per instance of violation. Jun 15, 2023
$6K

Last updated: Jan 2026

Quality of care over time

These measures show how residents usually do over time at this home, based on health outcomes and preventive care.

High-risk clinical events score Info A composite score based on pressure ulcers, falls with injury, weight loss, walking ability decline, and activities of daily living decline. 5.6
38% better than Colorado average

Colorado average: 9.0

Functional decline score Info A composite score based on activities of daily living decline, walking ability decline, and incontinence. 16.6
12% better than Colorado average

Colorado average: 18.8

Long-stay resident measures
Significantly above average Info CMS star rating based on long-stay quality measure performance. 5 stars = significantly above average, 1 star = significantly below average.
Need for Help with Daily Activities Increased Info Percent of long-stay residents whose need for help with daily activities has increased 4.9%
69% better than Colorado average

Colorado average: 16.0%

Walking Ability Worsened Info Percent of long-stay residents whose ability to move independently worsened 11.1%
34% better than Colorado average

Colorado average: 17.0%

Low Risk Residents with Bowel/Bladder Incontinence Info Percent of low risk long-stay residents who lose control of their bowels or bladder 33.8%
45% worse than Colorado average

Colorado average: 23.2%

Falls with Major Injury Info Percent of long-stay residents experiencing one or more falls with major injury 4.9%
46% worse than Colorado average

Colorado average: 3.3%

High Risk Residents with Pressure Ulcers Info Percent of long-stay high risk residents with pressure ulcers 1.5%
61% better than Colorado average

Colorado average: 3.9%

Urinary Tract Infection Info Percent of long-stay residents with a urinary tract infection 0.0%
100% better than Colorado average

Colorado average: 1.4%

Lost Too Much Weight Info Percent of long-stay residents who lose too much weight 5.4%
In line with Colorado average

Colorado average: 5.2%

Depressive Symptoms Info Percent of long-stay residents who have depressive symptoms 5.7%
21% better than Colorado average

Colorado average: 7.2%

Antipsychotic Use Info Percent of long-stay residents who received an antipsychotic medication 18.2%
In line with Colorado average

Colorado average: 18.8%

Pneumococcal Vaccine Info Percent of long-stay residents assessed and appropriately given the pneumococcal vaccine 94.6%
In line with Colorado average

Colorado average: 93.3%

Influenza Vaccine Info Percent of long-stay residents assessed and appropriately given the seasonal influenza vaccine 85.9%
9% worse than Colorado average

Colorado average: 94.7%

Hospitalizations per 1,000 days Info Number of hospitalizations per 1,000 long-stay resident days. 0.85
35% better than Colorado average

Colorado average: 1.30

ED visits per 1,000 days Info Number of outpatient emergency department visits per 1,000 long-stay resident days. 0.71
57% better than Colorado average

Colorado average: 1.67

Short-stay resident measures
Significantly above average Info CMS star rating based on short-stay quality measure performance. 5 stars = much above average, 1 star = much below average.
Pneumococcal Vaccine Info Percent of short-stay residents assessed and appropriately given the pneumococcal vaccine 65.0%
15% worse than Colorado average

Colorado average: 76.6%

Antipsychotic medication increase Info Percent of short-stay residents who newly received an antipsychotic medication 0.8%
42% better than Colorado average

Colorado average: 1.4%

Influenza Vaccine Info Percent of short-stay residents assessed and appropriately given the seasonal influenza vaccine 31.1%
59% worse than Colorado average

Colorado average: 75.6%

Re-hospitalized after SNF stay Info Percentage of short-stay residents who were re-hospitalized after their nursing home admission. 14.9%
27% better than Colorado average

Colorado average: 20.3%

Emergency department visits Info Percentage of short-stay residents who had an outpatient emergency department visit. 14.5%
13% worse than Colorado average

Colorado average: 12.8%

Falls with major injury Info Percentage of SNF residents who experience falls with major injury during their stay. 0.0%
100% better than Colorado average

Colorado average: 0.8%

Ability to care for self at discharge Info Percentage of residents at or above expected ability to care for themselves at discharge. 52.2%
In line with Colorado average

Colorado average: 53.7%

Breakdown by payment type

Medicare

3% of new residents, usually for short-term rehab.

Typical stay 29 days

Private pay

55% of new residents, often for short stays.

Typical stay 3 months

Medicaid

42% of new residents, often for long-term daily care.

Typical stay 8 - 9 months

Facility Characteristics

Source: CMS Long-Term Care Facility Characteristics (Data as of Jan 2026)

Total residents 103
Medicare
3
2.9% of residents
Medicaid
74
71.8% of residents
Private pay or other
26
25.2% of residents
Programs & Services
Residents Group

Residents meet regularly to discuss policies, care quality, and activities

Active Resident Council

Organized group of residents that meets regularly to discuss facility policies, quality of life, and activities.

Finances and operations

Privately-owned community
Operated by a business corporation.
Home revenue
$12.6M
Operating loss
-$145.6K
Privately-owned community Operated by a business corporation.
Home revenue
$12.6M Rank #77 / 182Revenue — State benchmarkedThis home is ranked 77th out of 182 homes in Colorado. Shows this facility's annual revenue compared to the Colorado SNF average. Higher revenue generally means more resources for staffing and capital — read alongside Payroll %.Click the rank badge to see the full State ranking.Click here to see the full State ranking.
Operating loss
-$145.6K
Payroll costs Info The portion of the home's budget spent on staff, including nurses, caregivers, and other employees who support care and operations. Rank #51 / 182Payroll — State benchmarkedThis home is ranked 51st out of 182 homes in Colorado. Shows total annual staff payroll benchmarked to the Colorado average. Higher payroll investment relative to peers often signals better staffing and less reliance on cheaper contract labor.Click the rank badge to see the full State ranking.Click here to see the full State ranking.
$7.8M
62.5% of revenue Rank #41 / 182Payroll % — State benchmarkedThis home is ranked 41st out of 182 homes in Colorado. Shows payroll as a percentage of revenue versus the Colorado average. Well-run Colorado SNFs typically land around 59–66% — the top third Statewide. Below 25% may signal understaffing or heavy agency use — read with Staffing ratings.Click the rank badge to see the full State ranking.Click here to see the full State ranking.
Other operating costs Info All remaining costs needed to run the home, such as food, utilities, building maintenance, supplies and administrative expenses.
$4.9M
Total costs $12.7M

Who this home usually serves

TYPE OF STAY

Mix of rehab and long-term care

This home supports both short-term rehab and long-term care, with residents staying for a wide range of durations.

Financial Assistance for
Nursing Home in Colorado

Holly Heights Nursing Care Center is located in Denver, Colorado.
Here are the financial assistance programs available to residents in Colorado.

Get Financial aid guidance

Elderly, Blind, and Disabled Waiver

Colorado Medicaid EBD Waiver

Age 65+ or disabled
General Colorado resident, Medicaid- eligible, nursing home-level care need.
Income Limits (2025) ~$2,829/month 300% FBR, individual
Asset Limits $2,000 (individual), $3,000 (couple).
CO

Requires level-of-care assessment by case manager.

Benefits
Personal care (5-7 hours/day) Respite care (up to 240 hours/year) Adult day care ($65/day) Home modifications ($1,500 avg.)

Old Age Pension (OAP) Health Care Program

Colorado OAP

Age 60+
General Colorado resident.
Income Limits ~$1,215/month individual
Asset Limits $2,000 individual
CO

Supplements SSI; limited medical coverage.

Benefits
Cash (~$100-$800/month) Limited in-home care (2-3 hours/week) Medical assistance

Program of All-Inclusive Care for the Elderly (PACE)

Colorado Medicaid PACE

Age 55+
General Colorado resident, nursing home-level care need, safe with PACE support.
Income Limits (2025) ~$2,829/month 300% FBR
Asset Limits $2,000 (individual), $3,000 (couple).
CO

Limited to specific regions (e.g., Denver, Pueblo).

Benefits
All-inclusive care—personal care (5-7 hours/day) Meals Transportation Therapy Medical visits

Home Care Allowance (HCA)

Colorado Home Care Allowance (HCA)

Age
General Seniors typically 65+, Age 5+ with disability, Colorado resident, financial/functional need.
Income Limits (2025) ~$1,004/month individual, stricter than waivers
Asset Limits $2,000 (individual), $3,000 (couple).
CO

Must need help with ADLs; not Medicaid-waiver eligible.

Benefits
Personal care (~4-6 hours/day, paid to provider) E.g. Bathing Dressing

Compare Nursing Home around Denver

The information below is reported by the Colorado Department of Public Health and Environment, Health Facilities Division.

4 facilities compared · CMS & CO Dept. of Health data

Filter by care type
Amberwood Post Acute
NH

Nursing Home Licensed facility providing 24/7 skilled nursing care for residents with complex, ongoing medical needs. Staffed by RNs, LPNs, and CNAs. Inspected and star-rated annually by CMS. Accepts Medicare (short-term rehab) and Medicaid (long-term care).

AL

Assisted Living A licensed, long-term care setting for seniors or individuals with disabilities who need help with daily activities — like bathing, dressing, and medication management — but not 24-hour skilled nursing. Offers housing, meals, and around-the-clock support while aiming to maximize resident independence.

Denver88 87.2% +14%2.97 -48%-23%$9.6k369.0185 95 Centennial Master Tenant, LLC$12.5M$5.5M43.8%65034
Holly Heights Nursing Care Center
NH

Nursing Home Licensed facility providing 24/7 skilled nursing care for residents with complex, ongoing medical needs. Staffed by RNs, LPNs, and CNAs. Inspected and star-rated annually by CMS. Accepts Medicare (short-term rehab) and Medicaid (long-term care).

AL

Assisted Living A licensed, long-term care setting for seniors or individuals with disabilities who need help with daily activities — like bathing, dressing, and medication management — but not 24-hour skilled nursing. Offers housing, meals, and around-the-clock support while aiming to maximize resident independence.

Denver133 69.7% -9%2.95 -30%-24%$20.5k223.1397 71 Bernhard Benet$12.6M$7.8M62.5%65124
Brookdale Lowry -
NH

Nursing Home Licensed facility providing 24/7 skilled nursing care for residents with complex, ongoing medical needs. Staffed by RNs, LPNs, and CNAs. Inspected and star-rated annually by CMS. Accepts Medicare (short-term rehab) and Medicaid (long-term care).

AL

Assisted Living A licensed, long-term care setting for seniors or individuals with disabilities who need help with daily activities — like bathing, dressing, and medication management — but not 24-hour skilled nursing. Offers housing, meals, and around-the-clock support while aiming to maximize resident independence.

MC

Memory Care Secured, specialized care for people living with Alzheimer's or dementia. Staff trained in cognitive impairment, with higher staff-to-resident ratios and an environment designed to reduce confusion and wandering risk.

Denver (East)172 69.9% -9%----------- 90 #N/A$5.8M$3.5M61.1%65433
Woodland Estates Senior Living -
NH

Nursing Home Licensed facility providing 24/7 skilled nursing care for residents with complex, ongoing medical needs. Staffed by RNs, LPNs, and CNAs. Inspected and star-rated annually by CMS. Accepts Medicare (short-term rehab) and Medicaid (long-term care).

AL

Assisted Living A licensed, long-term care setting for seniors or individuals with disabilities who need help with daily activities — like bathing, dressing, and medication management — but not 24-hour skilled nursing. Offers housing, meals, and around-the-clock support while aiming to maximize resident independence.

MC

Memory Care Secured, specialized care for people living with Alzheimer's or dementia. Staff trained in cognitive impairment, with higher staff-to-resident ratios and an environment designed to reduce confusion and wandering risk.

Denver (South Roslyn Street)135 26.8% -65%----------- 18 #N/A$4.4M$2.5M56.6%65362

Frequently Asked Questions about Holly Heights Nursing Care Center

Is Holly Heights Nursing Care Center in a walkable area?

Holly Heights Nursing Care Center has a walk score of 71. Very walkable. Most errands can be accomplished on foot, and many essentials are within a short walk.

Are there photos of Holly Heights Nursing Care Center?

Yes — there are 4 photos of Holly Heights Nursing Care Center in the photo gallery on this page.

What is the phone number of Holly Heights Nursing Care Center?

(303) 757-5441 will put you in contact with the team at Holly Heights Nursing Care Center.

Is Holly Heights Nursing Care Center Medicare or Medicaid certified?

Yes — Holly Heights Nursing Care Center is a CMS-certified provider of Medicare and Medicaid.

Guides for Better Senior Living

Care Cost Calculator: See Prices in Your Area

Nursing Home Data Explorer

Don’t Wait Too Long: 7 Red Flag Signs Your Parent Needs Assisted Living Now

The True Cost of Assisted Living in 2025 – And How Families Are Paying For It

Understanding Senior Living Costs: Pricing Models, Discounts & Financial Assistance

Explore Open Rooms
1 Contact details
2 What type of senior care service are you looking for?
3 What budget do you have in mind for senior care?
4 How soon do you need to find care?
5 Additional details

Thank you for your interest!

Our team will be in touch shortly to help with next steps.