Miami Jewish Health
Nursing Home, Memory Care, Assisted Living, Independent Living & Hospice Care · Miami-Dade County, FL
CMS overall rating Info The Overall CMS Rating is scored from 1 to 5 stars and combines results from health inspections, staffing levels, and quality measures. Health inspections carry the most weight. Staffing and quality scores can increase or decrease the final rating based on performance compared to state and national standards.

Miami Jewish Health

Nursing Home, Memory Care, Assisted Living, Independent Living & Hospice Care · Miami-Dade County, FL
CMS overall rating Info The Overall CMS Rating is scored from 1 to 5 stars and combines results from health inspections, staffing levels, and quality measures. Health inspections carry the most weight. Staffing and quality scores can increase or decrease the final rating based on performance compared to state and national standards.

Overview of Miami Jewish Health

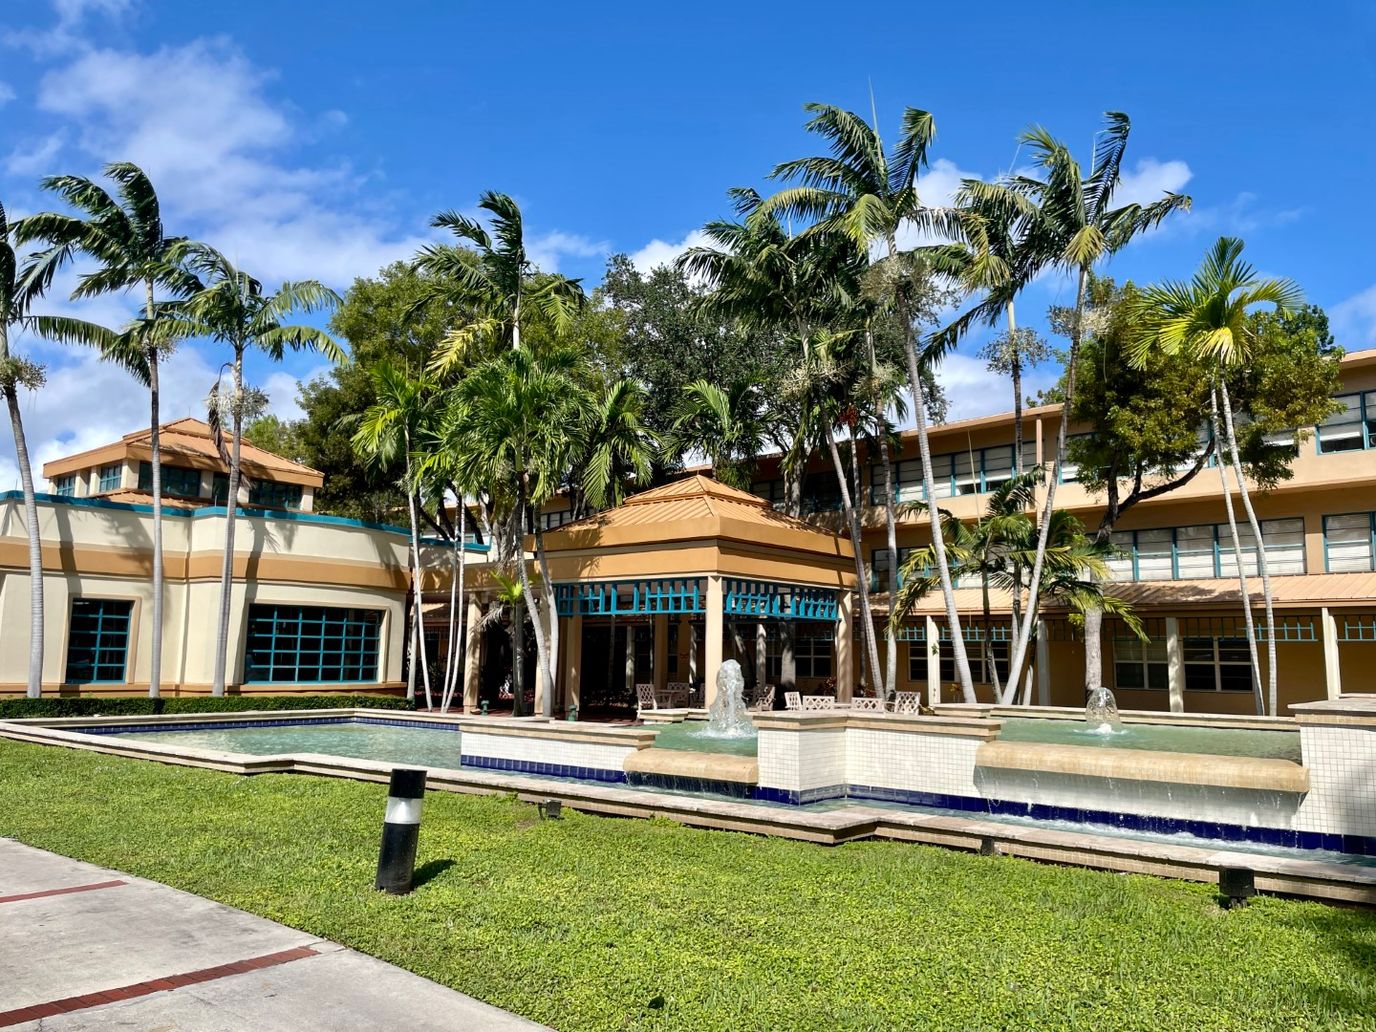
Experience the best of your golden years with Miami Jewish Health, a distinguished community in Miami, FL, offering skilled nursing and rehabilitation. Residents here experience the highest quality of care and support for their special needs with a compassionate and highly trained team available 24/7. With over 85 years of caring, the community is committed to understanding residents’ needs to provide better care and comfort.

Stimulating activities and enriching programs are also conducted so residents can enjoy an active lifestyle and remain socially engaged. Delicious and healthy meals are also served to meet residents’ dietary needs and preferences. Here, residents’ safety is prioritized, as proven by the community’s 24-hour security, emergency call system, and backup generators. The community is rated 4 stars by the Centers for Medicare & Medicaid Services (CMS) for its exceptional care.

(305) 751-8626

Quality ratings

Measured by Centers for Medicare & Medicaid Services (CMS)

Overall rating Info The Overall CMS Rating combines results from health inspections, staffing levels and quality measures. Health inspections carry the most weight. Staffing and quality scores can increase or decrease the final rating based on performance compared to state and national standards.
▲ 26.0% Above FL avg. ▲ 26.0% Above FL avg.Click the badge to see the full State ranking.Click here to see the full State ranking.
Health Inspection Info Based on the results of the facility's three most recent standard inspections and any complaint investigations. CMS reviews the number, scope, and severity of deficiencies, with more recent findings weighted more heavily.
▲ 6.7% Above FL avg. ▲ 6.7% Above FL avg.Click the badge to see the full State ranking.Click here to see the full State ranking.
Staffing Info Measures average nursing staff hours per resident per day, including Registered Nurses (RNs) and total nursing staff. Ratings are adjusted based on the level of care residents require and are compared to state and national benchmarks.
▲ 47.8% Above FL avg. ▲ 47.8% Above FL avg.Click the badge to see the full State ranking.Click here to see the full State ranking.
Quality Measures Info Based on clinical and physical health indicators reported to CMS, such as hospital readmissions, falls, pressure ulcers, and improvements in mobility. These measures reflect how well residents' health needs are being managed.
▼ 1.4% Below FL avg. ▼ 1.4% Below FL avg.Click the badge to see the full State ranking.Click here to see the full State ranking.

Staffing hours breakdown

Info Daily nursing hours per resident by staff type, reported to CMS. Higher is generally better — compare this facility to state and national averages to see where staffing stands.

Hours per resident per day — compared to Florida state averages

Total nursing care / resident Info This home is ranked 2nd out of 252 homes in Florida. Total adjusted nursing hours per resident per day, combining RN, LPN, and aide time. CMS adjusts this for case-mix so facilities can be fairly compared.
6h 48m per day
Rank #2 / 252Nurse hours — State benchmarkedThis home is ranked 2nd out of 252 homes in Florida. Shows adjusted nurse hours per resident per day benchmarked to the Florida average, with a ranking across 252 Florida SNFs. More hours mean more direct care. The national average is about 3.5 hrs; below 3.0 is a red flag.Click the rank badge to see the full State ranking.Click here to see the full State ranking.
This facility Florida avg (4h 2m per day)
vs Florida avg
+69%

1 of 6 metrics below state avg

Standout metric Nurse Aide is +93% above state avg
Staff typeHours / Day / Residentvs state avg
Registered Nurse (RN) Info RNs hold the highest nursing license and can assess residents, interpret test results, and direct care plans. More RN hours per day often signals stronger clinical oversight and faster response to health changes. 1h 3m per day ▲ 43% State avg: 44m per day · National avg: 41m per day
LPN / LVN Info Licensed Practical Nurses (LPNs) or Licensed Vocational Nurses (LVNs) deliver routine hands-on care — medication administration, wound dressing, and monitoring vital signs. They work under RN supervision and make up a large share of daily bedside care. 1h 16m per day ▲ 62% State avg: 47m per day · National avg: 52m per day
Nurse Aide Info Certified Nurse Aides (CNAs) provide the most direct day-to-day assistance: bathing, dressing, feeding, and mobility. Nurse aide hours are typically the largest staffing category and directly affect residents' quality of life. 4h 30m per day ▲ 93% State avg: 2h 20m per day · National avg: 2h 21m per day
Total Nursing (Weekend) Info Combined nursing hours (RN + LPN + Nurse Aide) per resident per day on weekends. Staffing often drops on weekends — this figure reveals whether the facility maintains adequate coverage outside of weekday hours. 5h 50m per day ▲ 66% State avg: 3h 31m per day · National avg: 3h 26m per day
Physical Therapist Info Hours per resident per day provided by licensed Physical Therapists (PTs) or PT Assistants. PT services help residents recover mobility after injury or illness and are especially important for post-acute (short-stay) rehabilitation. 3m per day ▼ 40% State avg: 5m per day · National avg: 4m per day
RN (Weekend) Info Registered nurse hours specifically on weekends. Facilities sometimes reduce RN presence on Saturdays and Sundays — a low weekend RN figure compared to weekday hours can indicate reduced clinical oversight when most administrative staff are absent. 44m per day ▲ 38% State avg: 32m per day · National avg: 29m per day

Types of Care at Miami Jewish Health

Memory Care Assisted Living Independent Living Hospice Care Nursing Home
Walk Score
Walk Score: 84 / 100 Rank #18 / 259Walk Score — State benchmarkedThis home is ranked 18th out of 259 homes in Florida. Shows how walkable this facility's neighborhood is compared to the average Walk Score across Florida SNFs. Higher scores benefit residents, families, and staff.Click the rank badge to see the full State ranking.Click here to see the full State ranking.
Very walkable. Most errands can be accomplished on foot, and many essentials are within a short walk.

About this community

License Details

AccreditationsAmerican Healthcare Association and National Center for Assisted Living (AHCA/NCA) Silver National Quality Award
Inspection Rating4 stars by the Centers for Medicare & Medicaid Services (CMS)

Therapy & Rehabilitation

3 services
Rehabilitation Services
Respite Care
Short-Term Rehab

Staffing & Medical

1 service
24-Hour Staffing

Amenities & Lifestyle

Specific ProgramsHome Care, Memory Disorder Clinic & Alzheimer’s Care, Florida PACE Centers, Skilled Nursing & Rehabilitation, Outpatient Rehabilitation, Kidney Care, Other Health Services

Contact Miami Jewish Health

Staffing Data

Reporting period: October 1 – December 31, 2025 (Q4 2025). Source: CMS Payroll-Based Journal report.

Total staff 468
Employees 463
Contractors 5
Staff to resident ratio 1.63:1
7% better than Florida average
Florida average ratio: 1.52:1 Florida average ratio: 1.52:1See full Florida ranking
Avg staff/day 262
Average shift 8.5 hours
8% better than Florida average
Florida average: 7.9 hours Florida average shift: 7.9 hoursSee full Florida ranking
Total staff hours (quarter) 204,648

Nursing staff breakdown

Q4 2025 · Oct 1 – Dec 31 More info This data comes from the CMS Payroll-Based Journal report covering October 1 – December 31, 2025.
Registered Nurse

Manages medical care and health needs.

Total count 37
Average shift length Info Average shift length. Calculated as total hours divided by days worked and average staff per day. 10.7 hours

No contractors work on this role.

Licensed Practical Nurse

Assists with medical care and medications.

Total count 87
Average shift length Info Average shift length. Calculated as total hours divided by days worked and average staff per day. 9.3 hours

No contractors work on this role.

Certified Nursing Assistant

Helps with daily care and mobility.

Total count 259
Average shift length Info Average shift length. Calculated as total hours divided by days worked and average staff per day. 8.3 hours

No contractors work on this role.

Contractor staffing

Q4 2025 · Oct 1 – Dec 31 More info This data comes from the CMS Payroll-Based Journal report covering October 1 – December 31, 2025.

Total hours from contractors

0.6%

1,160 contractor hours this quarter

Occupational Therapy Aide: 5

Staff by category

Q4 2025 · Oct 1 – Dec 31 More info This data comes from the CMS Payroll-Based Journal report covering October 1 – December 31, 2025.
Certified Nursing Assistant2590259121,76192100%8.3
Licensed Practical Nurse8708734,29792100%9.3
Registered Nurse3703716,84992100%10.7
Clinical Nurse Specialist180187,79592100%7.5
Other Social Services Staff100104,11092100%8
RN Director of Nursing6062,8806470%8
Mental Health Service Worker6062,6806672%8
Speech Language Pathologist6062,1509199%7.4
Feeding Assistant100101,9378896%7
Physical Therapy Assistant6061,6648592%6.4
Physical Therapy Aide3031,4157885%8
Occupational Therapy Aide0551,1607076%6.7
Dietitian2029516571%7.9
Respiratory Therapy Technician3039367278%8.9
Qualified Social Worker2027376368%7.4
Dental Services Staff2025817582%7.8
Other Physician1015046368%8
Other Dietary Services Staff1014715964%8
Administrator1014565762%8
Nurse Practitioner1014565762%8
Occupational Therapy Assistant1014405560%8
Medical Director1014165257%8
259 Certified Nursing Assistant
% of Days 100%
87 Licensed Practical Nurse
% of Days 100%
37 Registered Nurse
% of Days 100%
18 Clinical Nurse Specialist
% of Days 100%
10 Other Social Services Staff
% of Days 100%
6 RN Director of Nursing
% of Days 70%
6 Mental Health Service Worker
% of Days 72%
6 Speech Language Pathologist
% of Days 99%
10 Feeding Assistant
% of Days 96%
6 Physical Therapy Assistant
% of Days 92%
3 Physical Therapy Aide
% of Days 85%
5 Occupational Therapy Aide
% of Days 76%
2 Dietitian
% of Days 71%
3 Respiratory Therapy Technician
% of Days 78%
2 Qualified Social Worker
% of Days 68%
2 Dental Services Staff
% of Days 82%
1 Other Physician
% of Days 68%
1 Other Dietary Services Staff
% of Days 64%
1 Administrator
% of Days 62%
1 Nurse Practitioner
% of Days 62%
1 Occupational Therapy Assistant
% of Days 60%
1 Medical Director
% of Days 57%

Penalties and fines

Includes penalties issued in 2025

Federal penalties imposed by CMS for regulatory violations, including civil money penalties (fines) and denials of payment for new Medicare/Medicaid admissions.

Source: CMS Penalties Database (Data as of Jan 2026)

Total fines amount $16K Rank #179 / 257Federal fines — State benchmarkedThis home is ranked 179th out of 257 homes in Florida. Shows this facility's cumulative CMS federal fine dollars versus the Florida average among facilities with fines, and where it ranks among 257 skilled nursing facilities in the pool. Lower total dollars mean a better rank.Click the rank badge to see the full State ranking.Click here to see the full State ranking.
78% lower than Florida average

Florida average: $72K

Number of fines 2
24% fewer fines than Florida average

Florida average: 2.6

Payment Denials Info Serious action where Medicare and/or Medicaid temporarily stops payments for new residents until issues are fixed. 1
1212% more payment denials than Florida average

Florida average: 0.1

Fines amount comparison
This facility $16K
Florida average $72K
Penalty History

Penalties are imposed by CMS for violations of federal nursing home regulations.

1 penalty in the past 3 years

Jun 2, 2025 · 59 days

Payment Denial Info Serious action where Medicare and/or Medicaid temporarily stops payments for new residents until issues are fixed. Jun 2, 2025
59 days

Last updated: Jan 2026

Quality of care over time

These measures show how residents usually do over time at this home, based on health outcomes and preventive care.

High-risk clinical events score Info A composite score based on pressure ulcers, falls with injury, weight loss, walking ability decline, and activities of daily living decline. 7.8
6% worse than Florida average

Florida average: 7.4

Functional decline score Info A composite score based on activities of daily living decline, walking ability decline, and incontinence. 14.5
17% worse than Florida average

Florida average: 12.4

Long-stay resident measures
Above average Info CMS star rating based on long-stay quality measure performance. 5 stars = significantly above average, 1 star = significantly below average.
Need for Help with Daily Activities Increased Info Percent of long-stay residents whose need for help with daily activities has increased 12.5%
19% worse than Florida average

Florida average: 10.5%

Walking Ability Worsened Info Percent of long-stay residents whose ability to move independently worsened 14.5%
12% worse than Florida average

Florida average: 12.9%

Low Risk Residents with Bowel/Bladder Incontinence Info Percent of low risk long-stay residents who lose control of their bowels or bladder 16.4%
21% worse than Florida average

Florida average: 13.5%

Falls with Major Injury Info Percent of long-stay residents experiencing one or more falls with major injury 2.2%
15% better than Florida average

Florida average: 2.6%

High Risk Residents with Pressure Ulcers Info Percent of long-stay high risk residents with pressure ulcers 5.9%
10% worse than Florida average

Florida average: 5.4%

Urinary Tract Infection Info Percent of long-stay residents with a urinary tract infection 0.3%
67% better than Florida average

Florida average: 0.9%

Lost Too Much Weight Info Percent of long-stay residents who lose too much weight 4.1%
31% better than Florida average

Florida average: 6.0%

Depressive Symptoms Info Percent of long-stay residents who have depressive symptoms 1.9%
42% better than Florida average

Florida average: 3.3%

Antipsychotic Use Info Percent of long-stay residents who received an antipsychotic medication 9.1%
14% worse than Florida average

Florida average: 8.0%

Pneumococcal Vaccine Info Percent of long-stay residents assessed and appropriately given the pneumococcal vaccine 84.6%
13% worse than Florida average

Florida average: 97.7%

Influenza Vaccine Info Percent of long-stay residents assessed and appropriately given the seasonal influenza vaccine 100.0%
In line with Florida average

Florida average: 99.2%

Hospitalizations per 1,000 days Info Number of hospitalizations per 1,000 long-stay resident days. 3.03
44% worse than Florida average

Florida average: 2.10

ED visits per 1,000 days Info Number of outpatient emergency department visits per 1,000 long-stay resident days. 1.21
In line with Florida average

Florida average: 1.18

Short-stay resident measures
Average Info CMS star rating based on short-stay quality measure performance. 5 stars = much above average, 1 star = much below average.
Pneumococcal Vaccine Info Percent of short-stay residents assessed and appropriately given the pneumococcal vaccine 95.7%
In line with Florida average

Florida average: 94.0%

Antipsychotic medication increase Info Percent of short-stay residents who newly received an antipsychotic medication 1.2%
21% better than Florida average

Florida average: 1.5%

Influenza Vaccine Info Percent of short-stay residents assessed and appropriately given the seasonal influenza vaccine 96.0%
In line with Florida average

Florida average: 94.7%

Re-hospitalized after SNF stay Info Percentage of short-stay residents who were re-hospitalized after their nursing home admission. 30.6%
17% worse than Florida average

Florida average: 26.2%

Emergency department visits Info Percentage of short-stay residents who had an outpatient emergency department visit. 5.0%
46% better than Florida average

Florida average: 9.3%

Falls with major injury Info Percentage of SNF residents who experience falls with major injury during their stay. 0.7%
10% better than Florida average

Florida average: 0.8%

Ability to care for self at discharge Info Percentage of residents at or above expected ability to care for themselves at discharge. 50.0%
7% worse than Florida average

Florida average: 53.7%

Successful return to home or community Info Rate of successful return to home or community from a skilled nursing facility. 53.3%
5% better than Florida average

Florida average: 50.6%

Facility Characteristics

Source: CMS Long-Term Care Facility Characteristics (Data as of Jan 2026)

Total residents 287
Medicare
8
2.8% of residents
Medicaid
124
43.2% of residents
Private pay or other
155
54% of residents
Programs & Services
Residents Group

Residents meet regularly to discuss policies, care quality, and activities

Clinical Research

Conducts clinical research trials to develop and test new treatments

Active Resident Council

Organized group of residents that meets regularly to discuss facility policies, quality of life, and activities.

What does this home offer?

Total residents icon

Total Residents: 462 Residents

Housing options icon

Housing Options: Studio / 1 Bed

Building type icon
Building type icon

Building Type: 3-story

Dining services icon

Dining Services

Health Programs icon

Health Programs

Exercise program icon

Exercise Programs

Social and recreational activities icon

Social and Recreational Activities
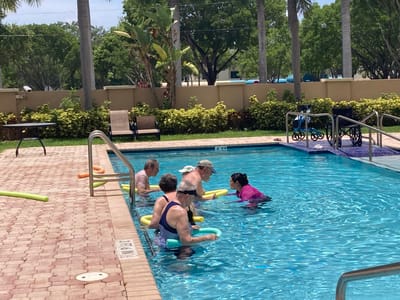
Swimming pool icon
Swimming pool icon

Swimming Pool

Places of interest near Miami Jewish Health

Address 4.5 miles from city center Info Estimated distance in miles from Miami's city center to Miami Jewish Health's address, calculated via Google Maps.

Calculate Travel Distance to Miami Jewish Health

Add your location

Address

Financial Assistance for
Nursing Home in Florida

Miami Jewish Health is located in Miami, Florida.
Here are the financial assistance programs available to residents in Florida.

Get Financial aid guidance

Long-Term Care Waiver

Florida Medicaid LTC Waiver

Age 65+ or 21+ disabled
General Florida resident, Medicaid- eligible, nursing home-level care need.
Income Limits (2025) ~$2,829/month 300% FBR, individual
Asset Limits $2,000 (individual), $3,000 (couple).
FL

High demand; waitlists common.

Benefits
In-home care (6-8 hours/day) Assisted living Respite (240 hours/year) Case management

Community Care for the Elderly (CCE)

Florida CCE

Age 60+
General Florida resident, at risk of nursing home.
Income Limits ~$2,000/month varies
Asset Limits $5,000 individual
FL

Limited funding; regional variation.

Benefits
Homemaker services (3-5 hours/week) Adult day care (~$60/day) Respite (up to 10 days/year)

Home Care for the Elderly (HCE)

Florida Home Care for the Elderly

Age 60+
General Florida resident, at risk of nursing home placement; caregiver must be approved.
Income Limits (2025) ~$2,829/month individual, aligned with Medicaid thresholds
Asset Limits ~$2,000 (individual); varies by case manager discretion.
FL

Limited funding (~3,500 served annually); prioritizes low-income frail seniors.

Benefits
Basic subsidy (~$160/month) for housing/medical costs; special subsidies for supplies/services (e.g., incontinence supplies, ~$50-$200/month)

Program of All-Inclusive Care for the Elderly (PACE)

Florida Medicaid PACE

Age 55+
General Florida resident, nursing home-level care need, safe with PACE support.
Income Limits (2025) ~$2,829/month 300% FBR
Asset Limits $2,000 (individual), $3,000 (couple).
FL

Limited to specific counties (e.g., Hillsborough, Miami-Dade); ~10 sites statewide.

Benefits
Personal care (5-7 hours/day) Medical care Meals Transportation Therapy

Optional State Supplementation (OSS)

Florida Optional State Supplementation

Age 65+ or disabled
General Florida resident, living in approved facility, receiving SSI or low-income.
Income Limits (2025) ~$1,004/month individual, including SSI
Asset Limits $2,000 (individual), $3,000 (couple).
FL

Limited to specific facility types; ~$78.40/month max supplement.

Benefits
Cash payment (~$78.40/month) for room/board or personal needs in facilities

Compare Nursing Home around Miami-dade County

The information below is reported by the Florida Agency for Health Care Administration (AHCA).

2 facilities compared · CMS & FL Dept. of Health data

Filter by care type
Miami Jewish Health
NH

Nursing Home Licensed facility providing 24/7 skilled nursing care for residents with complex, ongoing medical needs. Staffed by RNs, LPNs, and CNAs. Inspected and star-rated annually by CMS. Accepts Medicare (short-term rehab) and Medicaid (long-term care).

AL

Assisted Living A licensed, long-term care setting for seniors or individuals with disabilities who need help with daily activities — like bathing, dressing, and medication management — but not 24-hour skilled nursing. Offers housing, meals, and around-the-clock support while aiming to maximize resident independence.

HC

Home Care Professional care delivered in the person's own home — from companionship and errands to skilled nursing and therapy. Allows seniors to age in place. Medicare covers skilled home health when medically necessary.

IL

Independent Living Lifestyle-focused communities for older adults offering dining, activities, and transportation with minimal personal care. Best for active, independent seniors who want community without medical support.

MC

Memory Care Secured, specialized care for people living with Alzheimer's or dementia. Staff trained in cognitive impairment, with higher staff-to-resident ratios and an environment designed to reduce confusion and wandering risk.

Miami (Northeast 2Nd Avenue)393--6.81 -33%+69%$15.6k122.02299 84 ----105030
HarborChase of Tamarac
NH

Nursing Home Licensed facility providing 24/7 skilled nursing care for residents with complex, ongoing medical needs. Staffed by RNs, LPNs, and CNAs. Inspected and star-rated annually by CMS. Accepts Medicare (short-term rehab) and Medicaid (long-term care).

AL

Assisted Living A licensed, long-term care setting for seniors or individuals with disabilities who need help with daily activities — like bathing, dressing, and medication management — but not 24-hour skilled nursing. Offers housing, meals, and around-the-clock support while aiming to maximize resident independence.

MC

Memory Care Secured, specialized care for people living with Alzheimer's or dementia. Staff trained in cognitive impairment, with higher staff-to-resident ratios and an environment designed to reduce confusion and wandering risk.

Tamarac116 75.9% -10%3.59 +45%-11%$0379.3-123 77 Marie Eloi Desormes$28.8M$6.0M20.7%105609

Frequently Asked Questions about Miami Jewish Health

What neighborhood is Miami Jewish Health in?

Miami Jewish Health is in the Northeast 2nd Avenue neighborhood.

Is Miami Jewish Health in a walkable area?

Miami Jewish Health has a walk score of 84. Very walkable. Most errands can be accomplished on foot, and many essentials are within a short walk.

Who is the administrator of Miami Jewish Health?

field_administrator is the administrator of Miami Jewish Health.

Are there photos of Miami Jewish Health?

Yes — there are 7 photos of Miami Jewish Health in the photo gallery on this page.

What is the address of Miami Jewish Health?

Miami Jewish Health is located at 5200 NE 2nd Ave, Miami, FL 33137.

What is the phone number of Miami Jewish Health?

(305) 751-8626 will put you in contact with the team at Miami Jewish Health.

Is Miami Jewish Health Medicare or Medicaid certified?

Yes — Miami Jewish Health is a CMS-certified provider of Medicare and Medicaid.

Guides for Better Senior Living

Care Cost Calculator: See Prices in Your Area

Nursing Home Data Explorer

Don’t Wait Too Long: 7 Red Flag Signs Your Parent Needs Assisted Living Now

The True Cost of Assisted Living in 2025 – And How Families Are Paying For It

Understanding Senior Living Costs: Pricing Models, Discounts & Financial Assistance

Explore Open Rooms
1 Contact details
2 What type of senior care service are you looking for?
3 What budget do you have in mind for senior care?
4 How soon do you need to find care?
5 Additional details

Thank you for your interest!

Our team will be in touch shortly to help with next steps.