


Total health inspections
6
California average 12.5
Last Health inspection on Nov 2024

We arrange tours, appointments, and even moving support so you don’t have to
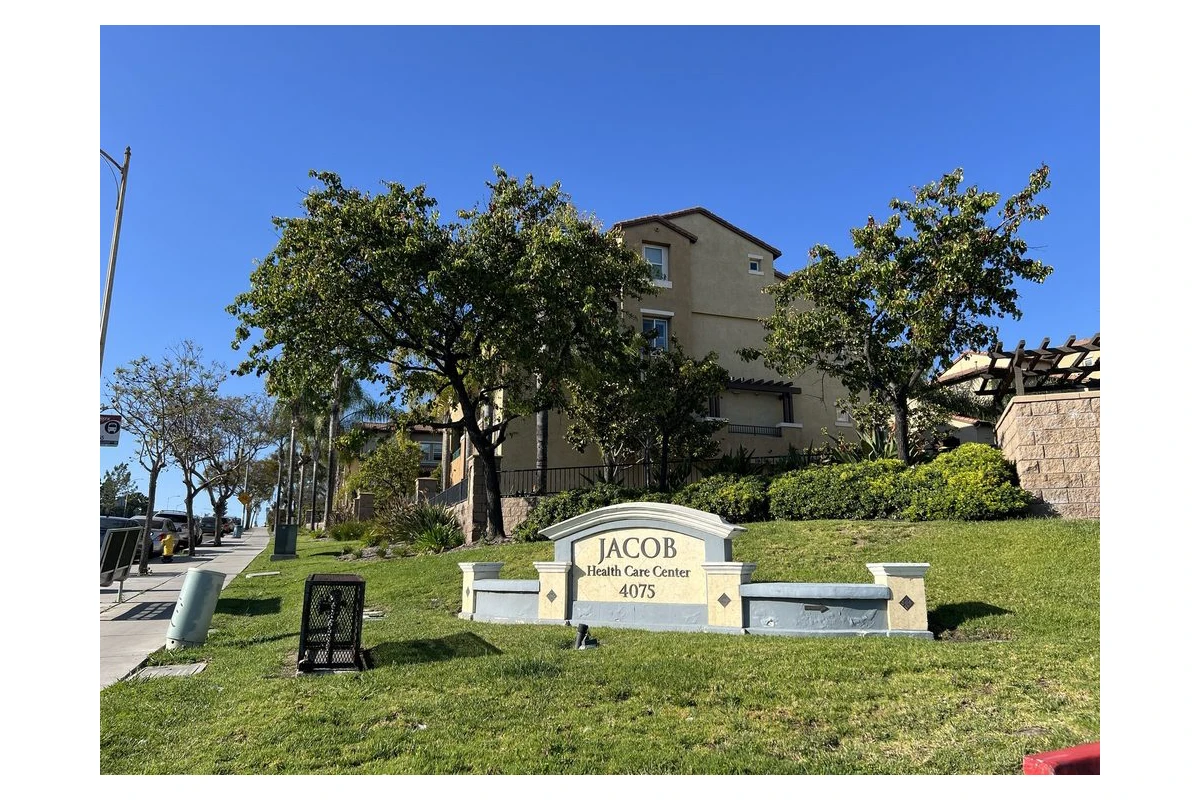
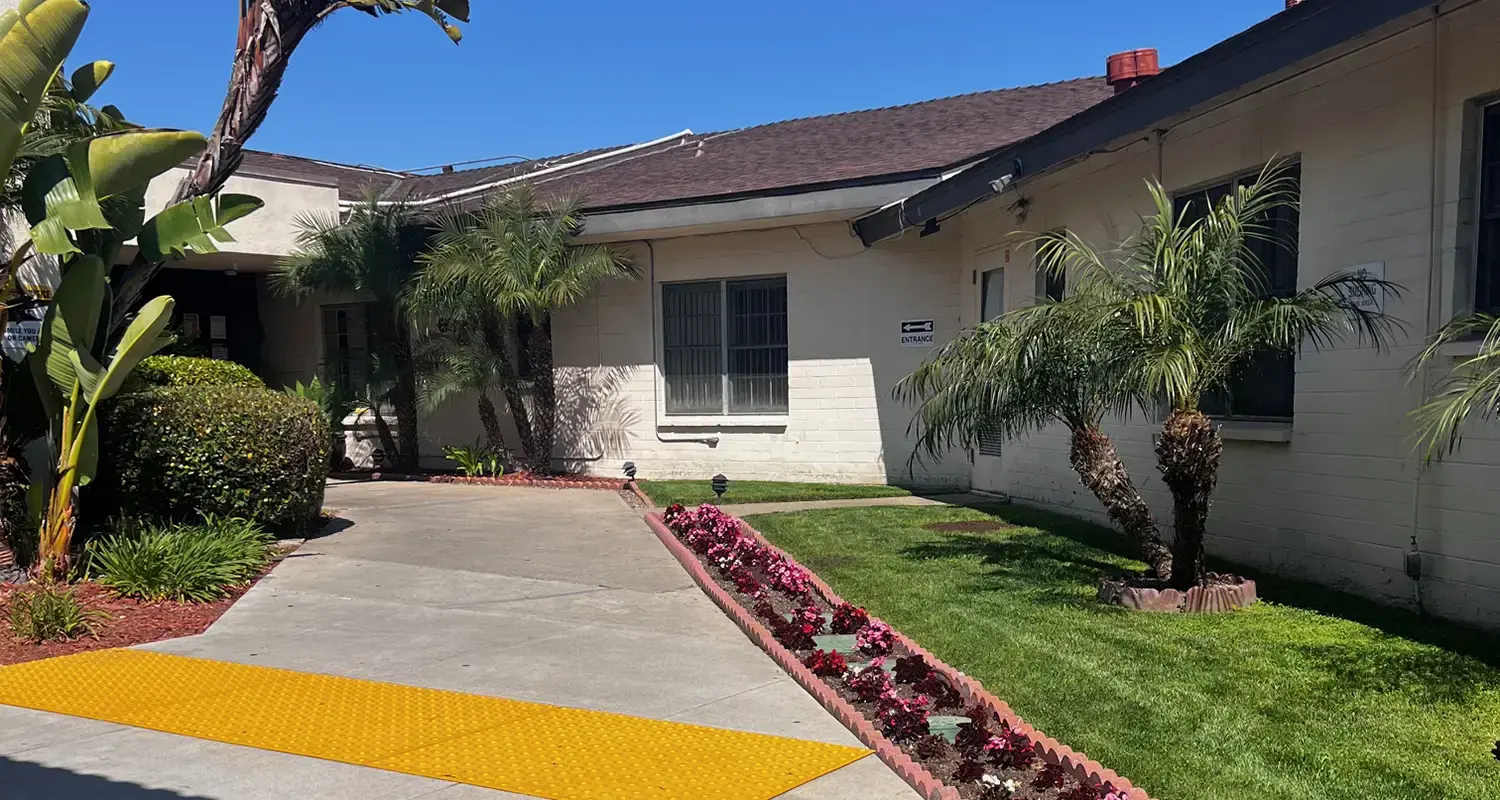
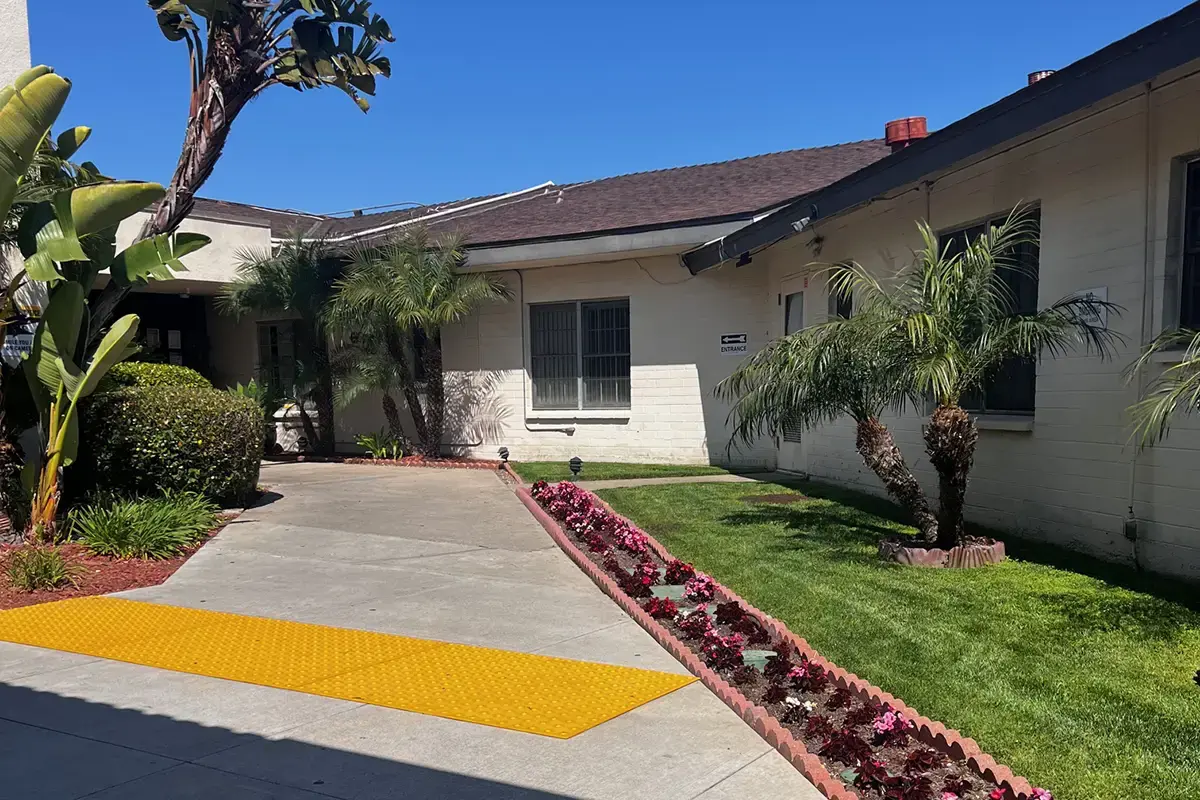
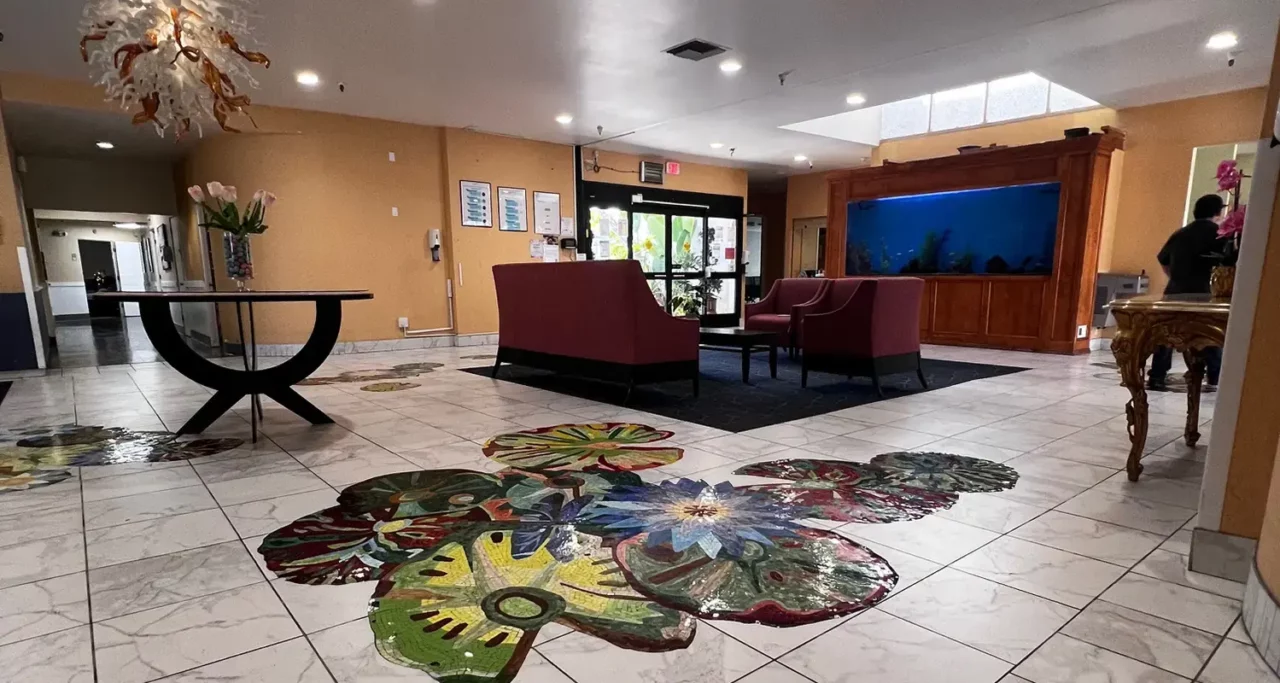
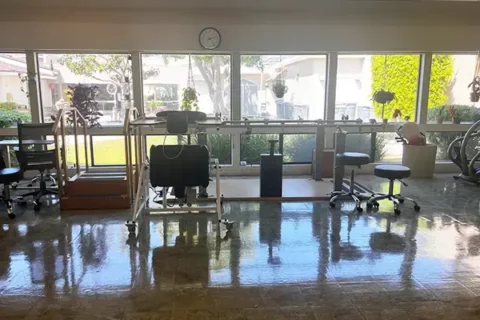


Jacob Healthcare Center is located in San Diego, CA. It provides 24-hour skilled nursing and rehabilitation services to the community. The center focuses on helping residents regain their highest level of function and independence.
 Official CMS rating based on health inspections, staffing and quality measures.
Official CMS rating based on deficiencies found during state health inspections.
Official CMS rating based on nurse staffing hours per resident per day.
Official CMS rating based on clinical outcomes for residents.
Average daily nursing hours per resident (adjusted for acuity). Higher values indicate more nursing time per resident.
Hours of care per resident per day, broken down by staff type. Data from CMS Medicare.
Registered nurse hours per resident per day.
Licensed Practical Nurse / Licensed Vocational Nurse hours per resident per day.
Nurse aide hours per resident per day.
Total number of nurse staff hours per resident per day on weekends.
Physical therapist staff hours per resident per day.
Registered nurse hours per resident per day on weekends.
Official CMS rating based on health inspections, staffing and quality measures.
Official CMS rating based on deficiencies found during state health inspections.
Official CMS rating based on nurse staffing hours per resident per day.
Official CMS rating based on clinical outcomes for residents.
Average daily nursing hours per resident (adjusted for acuity). Higher values indicate more nursing time per resident.
Hours of care per resident per day, broken down by staff type. Data from CMS Medicare.
Registered nurse hours per resident per day.
Licensed Practical Nurse / Licensed Vocational Nurse hours per resident per day.
Nurse aide hours per resident per day.
Total number of nurse staff hours per resident per day on weekends.
Physical therapist staff hours per resident per day.
Registered nurse hours per resident per day on weekends.
May offer a more intimate, personalized care environment.
Occupancy is moderate, suggesting balanced demand.
This home supports both short-term rehab and long-term care, with residents staying for a wide range of durations.
32% of new residents, usually for short-term rehab.
50% of new residents, often for short stays.
18% of new residents, often for long-term daily care.
The portion of the home's budget spent on staff, including nurses, caregivers, and other employees who support care and operations.
All remaining costs needed to run the home, such as food, utilities, building maintenance, supplies and administrative expenses.
In California, the Department of Social Services (for assisted living facilities) and the Department of Public Health (for nursing homes) conduct inspections to ensure resident safety and regulatory compliance.
0 total complaint visits
0 other visits
Other visits include regulatory visits that are not routine inspections or complaint investigations, such as administrative check-ins, follow-up reviews, or licensing-related visits.
Formal expressions of dissatisfaction or concern made by residents, or their families regarding various aspects of the care, services, and environment provided.
Nursing Home 24/7 care needed
Assisted Living For seniors needing help with daily tasks but not full-time nursing.
Nursing Home 24/7 care needed
Assisted Living For seniors needing help with daily tasks but not full-time nursing.
Nursing Home 24/7 care needed
Assisted Living For seniors needing help with daily tasks but not full-time nursing.
Nursing Home 24/7 care needed
Assisted Living For seniors needing help with daily tasks but not full-time nursing.
Nursing Home 24/7 care needed
Assisted Living For seniors needing help with daily tasks but not full-time nursing.
 Ridgeview Health Center
  Arroyo Vista Nursing Center
 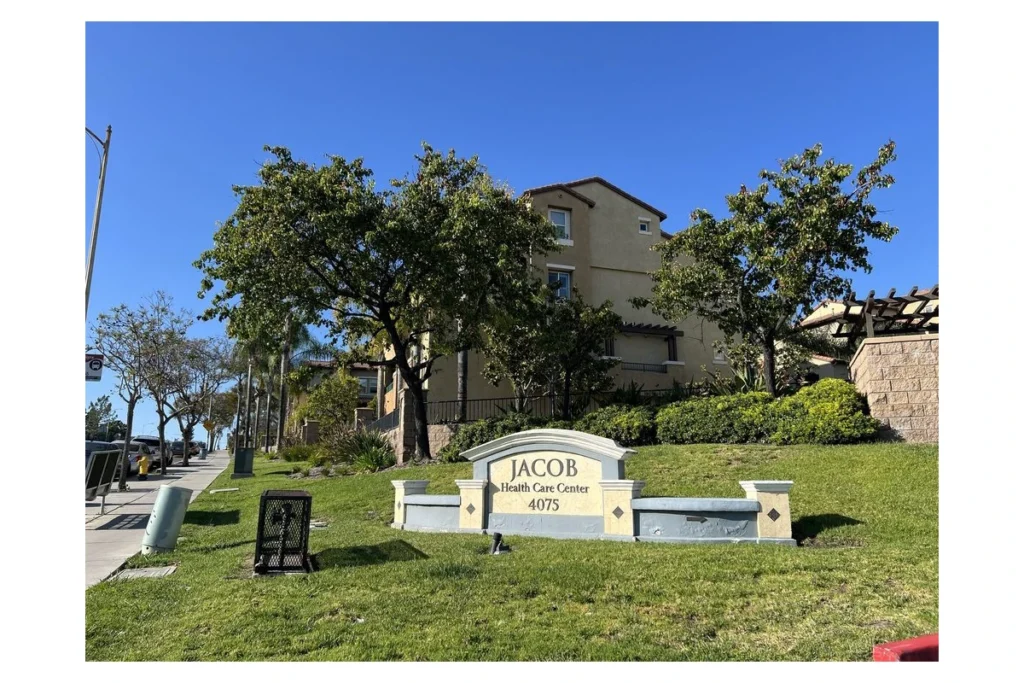 Jacob Health Care Center
![]() 3.9 miles from city center
3.9 miles from city center
![]() SAN DIEGO, CA 92105
SAN DIEGO, CA 92105
Add your location
Source: CMS Payroll-Based Journal (Q2 2025)
| Role ⓘ | Count ⓘ | Avg Shift (hrs) ⓘ | Uses Contractors? ⓘ |
|---|---|---|---|
| Registered Nurse | 31 | 7.9 | No |
| Licensed Practical Nurse | 44 | 7.7 | No |
| Certified Nursing Assistant | 94 | 7.5 | No |
| Role ⓘ | Employees ⓘ | Contractors ⓘ | Total Staff ⓘ | Total Hours ⓘ | Days Worked ⓘ | % of Days ⓘ | Avg Shift (hrs) ⓘ |
|---|---|---|---|---|---|---|---|
| Certified Nursing Assistant | 94 | 0 | 94 | 27,676 | 91 | 100% | 7.5 |
| Licensed Practical Nurse | 44 | 0 | 44 | 12,044 | 91 | 100% | 7.7 |
| Registered Nurse | 31 | 0 | 31 | 10,114 | 91 | 100% | 7.9 |
| Qualified Activities Professional | 27 | 0 | 27 | 4,657 | 91 | 100% | 7.4 |
| Other Dietary Services Staff | 9 | 0 | 9 | 2,231 | 91 | 100% | 7.1 |
| RN Director of Nursing | 5 | 0 | 5 | 1,953 | 85 | 93% | 7.8 |
| Speech Language Pathologist | 4 | 0 | 4 | 1,526 | 79 | 87% | 6.5 |
| Physical Therapy Assistant | 3 | 0 | 3 | 1,112 | 64 | 70% | 7.8 |
| Physical Therapy Aide | 4 | 0 | 4 | 872 | 75 | 82% | 6.3 |
| Occupational Therapy Aide | 2 | 0 | 2 | 831 | 70 | 77% | 7.4 |
| Administrator | 1 | 0 | 1 | 512 | 64 | 70% | 8 |
| Nurse Practitioner | 1 | 0 | 1 | 512 | 64 | 70% | 8 |
| Dietitian | 1 | 0 | 1 | 512 | 64 | 70% | 8 |
| Respiratory Therapy Technician | 2 | 0 | 2 | 420 | 61 | 67% | 6.9 |
| Mental Health Service Worker | 1 | 0 | 1 | 400 | 50 | 55% | 8 |
| Qualified Social Worker | 2 | 0 | 2 | 268 | 45 | 49% | 6 |
| Dental Services Staff | 1 | 0 | 1 | 112 | 14 | 15% | 8 |
| Other Physician | 0 | 2 | 2 | 40 | 23 | 25% | 1.6 |
| Medical Director | 0 | 1 | 1 | 30 | 30 | 33% | 1 |
California average 12.5
Last Health inspection on Nov 2024
Health citations are formal notices following inspections when they fail to comply with safety and care standards.
25 of 30 citations resulted from standard inspections; and 5 of 30 resulted from complaint investigations.
California average: 0.4
California average: 1
Data sourced from CMS Health Deficiencies reports. Citation severity codes range from A (least serious) to L (most serious). Immediate Jeopardy (J-L) citations indicate situations where the facility's noncompliance has placed residents at risk of death or serious harm.
Source: CMS Long-Term Care Facility Characteristics (Data as of Jan 2026)
Active councils help families stay involved in care decisions and facility operations.
These measures show how residents usually do over time at this home, based on health outcomes and preventive care.
California average: 6.6
California average: 11.3
California average: 11.1%
California average: 12.0%
California average: 11.3%
California average: 1.7%
California average: 5.0%
California average: 1.2%
California average: 4.2%
California average: 6.7%
California average: 10.1%
California average: 98.5%
California average: 98.2%
California average: 2.25
California average: 1.59
California average: 94.0%
California average: 1.5%
California average: 93.2%
California average: 23.2%
California average: 11.2%
California average: 0.8%
California average: 53.7%
California average: 50.6%
Quality measures are calculated from Minimum Data Set (MDS) assessments. For most measures, lower percentages indicate better care quality.
Historical financial and operational data for Jacob Health Care Center based on CMS SNF Cost Reports.
Loading trend charts...
Care Cost Calculator: See Prices in Your Area
Nursing Home Data Explorer
Don’t Wait Too Long: 7 Red Flag Signs Your Parent Needs Assisted Living Now
The True Cost of Assisted Living in 2025 – And How Families Are Paying For It
Understanding Senior Living Costs: Pricing Models, Discounts & Financial Assistance
Touring a community? Use this expert-backed checklist to stay organized, ask the right questions, and find the perfect fit.
We'll send you a PDF version of the touring checklist.


