• Home
  • Nursing Home in Florida
John Knox Village of Central Florida, Inc.
Nursing Home, Assisted Living, Home Care, Independent Living, Memory Care & Nursing Care · Orange City, FL
CMS overall rating Info CMS (the Centers for Medicare & Medicaid Services) is the federal agency that rates nursing home quality. Its Overall Rating runs from 1 to 5 stars, combining health inspections, staffing, and quality measures, with inspections weighted most heavily.

John Knox Village of Central Florida, Inc.

Nursing Home, Assisted Living, Home Care, Independent Living, Memory Care & Nursing Care · Orange City, FL
CMS overall rating Info CMS (the Centers for Medicare & Medicaid Services) is the federal agency that rates nursing home quality. Its Overall Rating runs from 1 to 5 stars, combining health inspections, staffing, and quality measures, with inspections weighted most heavily.
Calculator: See prices in your area
John Knox Village of Central Florida, Inc. accepts Veteran Affairs Benefits, Medicare, Medicaid, and private pay.

Overview of John Knox Village of Central Florida, INC.

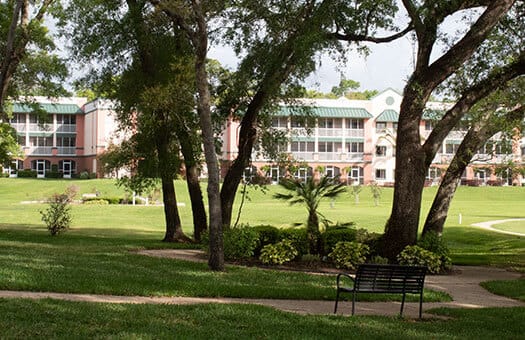
A 60-bed nursing home in Orange City, John Knox Village of Central Florida is near the Northlake area of central Florida. Operating for nearly five decades under Joe Trainor’s ownership and the operating entity John Knox Village of Central Florida, Inc., the facility accepts Veteran Affairs Benefits, Medicare, Medicaid, and private pay, providing many ways for families to cover nursing care costs.

The typical stay length is about 82 days, mirroring the home’s focus on post-acute rehabilitation and longer-term care. Total nursing care averages roughly 4 hours and 58 minutes per resident day, with nursing aides contributing 4 hours and 1 minute per day, so attentive daily support is a main part of the setting. The facility highlights rehabilitation services and offers programs and classes as part of its activity schedule. Daily life centers around dining. The community features a flexible dining program that changes daily, with fresh seasonal ingredients prepared to order. This kitchen-first approach aims to make mealtimes a highlight of residents’ days. The home also delivers on-site health services, home health care, and outpatient services, which lessen the need for outside medical appointments. Near but not within a walkable neighborhood, the location scores 19 on the walkability index. Most errands then demand a car, but the community’s setting in a quieter part of Orange City appeals to families who seek a calmer residential atmosphere.

State inspections have shown the community’s quality improvements. The latest inspection had no deficiencies and filed complaints. Earlier reviews marked deficiencies pertaining to resident care rights, medication labeling, staffing standards, and risk management. John Knox Village of Central Florida has worked to strengthen areas like documentation, medication handling, and resident supervision.

The facility’s location in a more serene part of Orange City attracts families who need a quieter residential environment.

Quality ratings

Measured by Centers for Medicare & Medicaid Services (CMS)

Overall rating Info The Overall CMS Rating combines results from health inspections, staffing levels and quality measures. Health inspections carry the most weight. Staffing and quality scores can increase or decrease the final rating based on performance compared to state and national standards.
Health Inspection Info Based on the results of the facility's three most recent standard inspections and any complaint investigations. CMS reviews the number, scope, and severity of deficiencies, with more recent findings weighted more heavily.
Staffing Info Measures average nursing staff hours per resident per day, including Registered Nurses (RNs) and total nursing staff. Ratings are adjusted based on the level of care residents require and are compared to state and national benchmarks.
Quality Measures Info Based on clinical and physical health indicators reported to CMS, such as hospital readmissions, falls, pressure ulcers, and improvements in mobility. These measures reflect how well residents' health needs are being managed.

Staffing hours breakdown

Info Daily nursing hours per resident by staff type, reported to CMS. Higher is generally better — compare this facility to state and national averages to see where staffing stands.

Hours per resident per day — compared to state averages

Total nursing care / resident Info Total adjusted nursing hours per resident per day, combining RN, LPN, and aide time. CMS adjusts this for case-mix so facilities can be fairly compared.
4h 58m per day
Rank #29 / 253Nurse hours — State benchmarkedThis home is ranked 29th out of 253 homes in Florida. Shows adjusted nurse hours per resident per day benchmarked to the Florida average, with a ranking across 253 Florida facilities. More hours mean more direct care. The national average is about 3.5 hrs; below 3.0 is a red flag.Rankings are based only on facilities in Florida that report data for that category. Facilities without available data are excluded from the ranking.Click the rank badge to see the full State ranking.Click here to see the full State ranking.
vs avg
Staff typeHours / Day / Residentvs state avg
Registered Nurse (RN) Info RNs hold the highest nursing license and can assess residents, interpret test results, and direct care plans. More RN hours per day often signals stronger clinical oversight and faster response to health changes. 56m per day
LPN / LVN Info Licensed Practical Nurses (LPNs) or Licensed Vocational Nurses (LVNs) deliver routine hands-on care — medication administration, wound dressing, and monitoring vital signs. They work under RN supervision and make up a large share of daily bedside care. 59m per day
Nurse Aide Info Certified Nurse Aides (CNAs) provide the most direct day-to-day assistance: bathing, dressing, feeding, and mobility. Nurse aide hours are typically the largest staffing category and directly affect residents' quality of life. 2h 42m per day
Weekend Total Nursing Info Combined nursing hours (RN + LPN + Nurse Aide) per resident per day on weekends. Staffing often drops on weekends — this figure reveals whether the facility maintains adequate coverage outside of weekday hours. 4h 11m per day
Physical Therapist Info Hours per resident per day provided by licensed Physical Therapists (PTs) or PT Assistants. PT services help residents recover mobility after injury or illness and are especially important for post-acute (short-stay) rehabilitation. 3m per day
Weekend RN Info Registered nurse hours specifically on weekends. Facilities sometimes reduce RN presence on Saturdays and Sundays — a low weekend RN figure compared to weekday hours can indicate reduced clinical oversight when most administrative staff are absent. 40m per day

Capacity and availability

Avg. Length of Stay
82 days
Bed community size
60-bed community Rank #695 / 1074Bed count — State benchmarkedThis home is ranked 695th out of 1074 homes in Florida. Shows this facility's certified or reported bed count compared to other Florida facilities. Larger communities may offer more amenities, programs, and on-site services for residents and families.Rankings are based only on facilities in Florida that report data for that category. Facilities without available data are excluded from the ranking.Click the rank badge to see the full State ranking.Click here to see the full State ranking.
A moderately sized community that may balance personal attention with shared amenities and social activities.
Years in operation
48 years in operation
A longer operating history, which may indicate experience navigating regulations and delivering ongoing care.
Walk Score
Walk Score: 19 / 100 Rank #1109 / 1486Walk Score — State benchmarkedThis home is ranked 1109th out of 1486 homes in Florida. Shows how walkable this facility's neighborhood is compared to the average Walk Score across Florida facilities. Higher scores benefit residents, families, and staff.Rankings are based only on facilities in Florida that report data for that category. Facilities without available data are excluded from the ranking.Click the rank badge to see the full State ranking.Click here to see the full State ranking.
Car-dependent. Most errands require a car, with limited nearby walkable options.

About this community

Occupancy

Occupancy rate
72%
Rank #216 / 258Occupancy rate — State benchmarkedThis home is ranked 216th out of 258 homes in Florida. Shows this facility's occupancy rate versus the Florida average, with its Statewide rank out of 258. Higher occupancy signals strong local demand and financial stability.Rankings are based only on facilities in Florida that report data for that category. Facilities without available data are excluded from the ranking.Click the rank badge to see the full State ranking.Click here to see the full State ranking.
Lower than the Florida average: 84.3%
Occupied beds
43 / 60
Average occupied beds in Florida homes 108 beds

License Details

Facility TypeAssisted Living Facility
StatusIn Review
IssuanceApril 10, 2024
ExpirationSeptember 4, 2026
CountyVolusia
License Number5177
CMS Certification Number105374

Ownership & Operating Entity

John Knox Village of Central Florida, Inc. is legally operated by John Knox Village Of Central Florida, Inc., and administered by Amanda Logan.

Owner NameJohn Knox Village Of Central Florida, Inc
Profit StatusNonprofit

Type Of Units

Extended Congregate Care
60 units
Private
60 units
Total beds
60 units

Staffing

Key information about the people who lead and staff this community.

Languages Spoken

English Russian Spanish

Leadership

ContactTaver Cornett, CFO

Therapy & Rehabilitation

1 service
Rehabilitation Services

Staffing & Medical

1 service
Licensed Nurses/CNAs

Additional Policies & Features

Continuing Care Retirement Community (CCRC)

Amenities & Lifestyle

Dining
Health Services
Specific ProgramsOutpatient Services, Programs and Classes

Contact John Knox Village of Central Florida, Inc.

Inspection History

In Florida, the Agency for Health Care Administration (AHCA) is the primary authority that conducts unannounced inspections and completes official health quality reports for all healthcare facilities.

Since 2013 · 13 years of data 26 citations 24 inspections 2 fines $20.0K fined
Inspection Score Info A composite 0–100 score combining this facility's inspections, citations, complaints, and enforcement actions relative to the Florida state average. The score below shows how many points this facility sits above or below the typical Florida assisted living residence score (the benchmark); higher is better.

2 points below the Florida average for assisted living residences (83/100)

Rank #556 / 876 in Florida Inspection Score — State benchmarked This home is ranked 556th out of 876 homes in Florida. Shows this facility's inspection score compared to the Florida average among 876 comparable communities in the ranking pool. Rankings are based only on facilities in Florida that report data for that category. Facilities without available data are excluded from the ranking. Inspection score: 81 out of 100. Letter grade B-. 2 points below the Florida average for assisted living residences (83/100)

Inspection Scorecard Info This scorecard compares key inspection, citation, and complaint metrics at this facility against the Florida state average. Metrics rated ≥15% worse than average are highlighted in red; those ≥15% better are highlighted in green.

Since 2013 vs. Florida state average
Overall vs. FL average 0 Worse No metrics in this bucket. 6 Better Metrics better than Florida average:
• Total citations (21% below)
• Citations per year (20% below)
• Citations per inspection (15% below)
• Total inspections (8% below)
• Inspections with citations (38% below)
• Inspection citation rate (32% below)
Latest Inspection December 27, 2023 Other An inspection that falls outside standard annual surveys and formal complaint investigations. May include administrative compliance checks, documentation reviews, focused surveys on specific concerns, or revisit surveys to verify prior corrections.

Citations Info Citations are formal regulatory issues recorded during state inspections.

This FacilityFL Averagevs. FL Avg
Total citations Info Formal regulatory issues recorded by inspectors across all inspection types. 2633 This facility has 21% fewer total citations than a typical Florida assisted living residence (26 vs. FL avg 33).↓ 21% better Rank #414 / 919 Total citations — State benchmarked This home is ranked 414th out of 919 homes in Florida. Shows this facility's total citations compared to the Florida average among 919 comparable communities in the ranking pool. Rankings are based only on facilities in Florida that report data for that category. Facilities without available data are excluded from the ranking.
Citations per year Info Average citations per year since 2013. 22.5 This facility has 20% fewer citations per year than a typical Florida assisted living residence (2 vs. FL avg 2.5).↓ 20% better
Citations per inspection Info Average citations per inspection. 1.11.3 This facility has 15% fewer citations per inspection than a typical Florida assisted living residence (1.1 vs. FL avg 1.3).↓ 15% better Rank #331 / 919 Citations per inspection — State benchmarked This home is ranked 331st out of 919 homes in Florida. Shows this facility's citations per inspection compared to the Florida average among 919 comparable communities in the ranking pool. Rankings are based only on facilities in Florida that report data for that category. Facilities without available data are excluded from the ranking.

Inspections Info State inspections evaluate whether the facility meets health and safety standards.

This FacilityFL Averagevs. FL Avg
Total inspections Info Combined count of all routine and focused inspections. Excludes complaint investigations. 2426 This facility has 8% fewer total inspections than a typical Florida assisted living residence (24 vs. FL avg 26).↓ 8% better
Inspections with citations Info Inspections that resulted in at least one regulatory citation. 1016 This facility has 38% fewer inspections with citations than a typical Florida assisted living residence (10 vs. FL avg 16).↓ 38% better
Inspection citation rate Info Percentage of inspections that resulted in at least one citation. 42%62% This facility has 20 percentage points lower inspection citation rate than a typical Florida assisted living residence (42% vs. FL avg 62%).↓ 20% better Rank #247 / 919 Inspection citation rate — State benchmarked This home is ranked 247th out of 919 homes in Florida. Shows this facility's % of inspections with citations compared to the Florida average among 919 comparable communities in the ranking pool. Rankings are based only on facilities in Florida that report data for that category. Facilities without available data are excluded from the ranking.

Inspection Reports Summary Info An editor-reviewed summary of the themes and findings across this facility's recent inspection reports.

  • December 27, 2023 inspection showed no deficiencies and no complaints were filed.
  • April 30, 2020 complaint inspection cited four deficiencies including resident care rights, medication labeling, staffing standards for administrators, and risk management.
  • Staffing standards deficiencies appeared in 2020 and 2020, while earlier inspections noted recurring issues with resident care supervision and medication management.

Health Inspection History

Inspections since 2024
Total health inspections 1

State average N/A


Last Health inspection on Dec 2024

Total health citations
1 Rank #1 / 252Health citations — State benchmarkedThis home is ranked 1st out of 252 homes in Florida. Shows this facility's total health deficiency citations benchmarked to the Florida State average, with a ranking across all 252 FL facilities. Lower citation counts earn a better rank.Rankings are based only on facilities in Florida that report data for that category. Facilities without available data are excluded from the ranking.Click the rank badge to see the full State ranking.Click here to see the full State ranking.

State average N/A

Citations per inspection
1 Rank #1 / 252Citations per inspection — State benchmarkedThis home is ranked 1st out of 252 homes in Florida. Shows average deficiency citations per CMS inspection for this facility versus the Florida mean across 252 facilities with citation data. Lower is better.Rankings are based only on facilities in Florida that report data for that category. Facilities without available data are excluded from the ranking.Click the rank badge to see the full State ranking.Click here to see the full State ranking.

State average N/A


Health citations are formal notices following inspections when they fail to comply with safety and care standards.

All 1 citation resulted from standard inspections.

Breakdown of citation severity (last 2 years)
Critical health citations
0
In line with State average

State average: N/A


Serious health citations
0
In line with State average

State average: N/A

0 critical citations State average: N/A

0 serious citations State average: N/A

1 moderate citation State average: N/A

0 minor citations State average: N/A
Citations history (last 2 years)
Care Planning moderate citation Dec 12, 2024
Corrected

Staffing Data

Reporting period: October 1 – December 31, 2025 (Q4 2025). Source: CMS Payroll-Based Journal report.

Total staff 218
Employees 215
Contractors 3
Staff to resident ratio 1.82 : 1
0% compared with State average

State average ratio: 0 : 0

Avg staff/day 91
Average shift 7.6 hours
0% compared with State average

State average: 0 hours

Total staff hours (quarter) 63,255

Nursing staff breakdown

Q4 2025 · Oct 1 – Dec 31 More info This data comes from the CMS Payroll-Based Journal report covering October 1 – December 31, 2025.
Registered Nurse

Manages medical care and health needs.

RN Staff Info All 31 RN Staff are full-time employees. No contractors work on this role. 31
Average shift length Info Average shift length. Calculated as total hours divided by days worked and average staff per day. 7.2 hours
Licensed Practical Nurse

Assists with medical care and medications.

LPN Staff Info All 36 LPN Staff are full-time employees. No contractors work on this role. 36
Average shift length Info Average shift length. Calculated as total hours divided by days worked and average staff per day. 8.3 hours
Certified Nursing Assistant

Helps with daily care and mobility.

CNA Staff Info All 90 CNA Staff are full-time employees. No contractors work on this role. 90
Average shift length Info Average shift length. Calculated as total hours divided by days worked and average staff per day. 7.6 hours

Contractor staffing

Q4 2025 · Oct 1 – Dec 31 More info This data comes from the CMS Payroll-Based Journal report covering October 1 – December 31, 2025.

Total hours from contractors

0.4%

265 contractor hours this quarter

Medical Director: 1 Feeding Assistant: 1 Occupational Therapy Assistant: 1

Staff by category

Q4 2025 · Oct 1 – Dec 31 More info This data comes from the CMS Payroll-Based Journal report covering October 1 – December 31, 2025.
Certified Nursing Assistant9009030,52992100%7.6
Licensed Practical Nurse3603610,98492100%8.3
Registered Nurse310316,88092100%7.2
Clinical Nurse Specialist100103,2356773%7.1
Dietitian7072,52892100%7.3
Speech Language Pathologist140142,43392100%7.7
Physical Therapy Aide8081,97692100%7.2
Qualified Social Worker5051,1398087%5.7
Physical Therapy Assistant3037508188%6.7
Mental Health Service Worker2027396571%7.3
Nurse Practitioner2025046368%8
Respiratory Therapy Technician3034806672%7.3
Administrator1014645863%8
RN Director of Nursing1011912325%8.3
Therapeutic Recreation Specialist1011432426%5.9
Medical Director0111383134%4.5
Feeding Assistant0111002527%4
Occupational Therapy Assistant0112789%3.4
Occupational Therapy Aide1011678%2.3
90 Certified Nursing Assistant
% of Days 100%
36 Licensed Practical Nurse
% of Days 100%
31 Registered Nurse
% of Days 100%
10 Clinical Nurse Specialist
% of Days 73%
7 Dietitian
% of Days 100%
14 Speech Language Pathologist
% of Days 100%
8 Physical Therapy Aide
% of Days 100%
5 Qualified Social Worker
% of Days 87%
3 Physical Therapy Assistant
% of Days 88%
2 Mental Health Service Worker
% of Days 71%
2 Nurse Practitioner
% of Days 68%
3 Respiratory Therapy Technician
% of Days 72%
1 Administrator
% of Days 63%
1 RN Director of Nursing
% of Days 25%
1 Therapeutic Recreation Specialist
% of Days 26%
1 Medical Director
% of Days 34%
1 Feeding Assistant
% of Days 27%
1 Occupational Therapy Assistant
% of Days 9%
1 Occupational Therapy Aide
% of Days 8%

Penalties and fines

Federal penalties imposed by CMS for regulatory violations, including civil money penalties (fines) and denials of payment for new Medicare/Medicaid admissions.

Source: CMS Penalties Database

No penalties in the past 3 years

No civil money penalties or payment denials were reported in the last 3 years.

Quality of care over time

These measures show how residents usually do over time at this home, based on health outcomes and preventive care.

High-risk clinical events score Info A composite score based on pressure ulcers, falls with injury, weight loss, walking ability decline, and activities of daily living decline. 13.9
87% worse than State average

State average: 7.4

Functional decline score Info A composite score based on activities of daily living decline, walking ability decline, and incontinence. 29.6
139% worse than State average

State average: 12.4

Long-stay resident measures
Need for Help with Daily Activities Increased Info Percent of long-stay residents whose need for help with daily activities has increased 32.2%
207% worse than State average

State average: 10.5%

Walking Ability Worsened Info Percent of long-stay residents whose ability to move independently worsened 23.4%
80% worse than State average

State average: 12.9%

Low Risk Residents with Bowel/Bladder Incontinence Info Percent of low risk long-stay residents who lose control of their bowels or bladder 33.3%
146% worse than State average

State average: 13.5%

Falls with Major Injury Info Percent of long-stay residents experiencing one or more falls with major injury 6.4%
141% worse than State average

State average: 2.6%

High Risk Residents with Pressure Ulcers Info Percent of long-stay high risk residents with pressure ulcers 3.9%
27% better than State average

State average: 5.4%

Urinary Tract Infection Info Percent of long-stay residents with a urinary tract infection 1.4%
59% worse than State average

State average: 0.9%

Lost Too Much Weight Info Percent of long-stay residents who lose too much weight 3.5%
42% better than State average

State average: 6.0%

Depressive Symptoms Info Percent of long-stay residents who have depressive symptoms 0.0%
100% better than State average

State average: 3.3%

Antipsychotic Use Info Percent of long-stay residents who received an antipsychotic medication 4.0%
50% better than State average

State average: 8.0%

Pneumococcal Vaccine Info Percent of long-stay residents assessed and appropriately given the pneumococcal vaccine 100.0%
In line with State average

State average: 97.7%

Influenza Vaccine Info Percent of long-stay residents assessed and appropriately given the seasonal influenza vaccine 100.0%
In line with State average

State average: 99.2%

Short-stay resident measures
Pneumococcal Vaccine Info Percent of short-stay residents assessed and appropriately given the pneumococcal vaccine 99.6%
6% better than State average

State average: 94.0%

Antipsychotic medication increase Info Percent of short-stay residents who newly received an antipsychotic medication 1.2%
22% better than State average

State average: 1.5%

Influenza Vaccine Info Percent of short-stay residents assessed and appropriately given the seasonal influenza vaccine 100.0%
6% better than State average

State average: 94.7%

Breakdown by payment type

Medicare

38% of new residents, usually for short-term rehab.

Typical stay 26 days

Private pay

55% of new residents, often for short stays.

Typical stay 2 - 3 months

Medicaid

6% of new residents, often for long-term daily care.

Typical stay 1 - 2 years

Facility Characteristics

Source: CMS Long-Term Care Facility Characteristics (Data as of Jan 2026)

Total residents 120
Medicare
19
15.8% of residents
Medicaid
49
40.8% of residents
Private pay or other
52
43.3% of residents
Programs & Services
Residents Group

Residents meet regularly to discuss policies, care quality, and activities

CCRC

Part of a Continuing Care Retirement Community offering multiple care levels

Active Resident Council

Organized group of residents that meets regularly to discuss facility policies, quality of life, and activities.

Finances and operations

Based on CMS SNF Cost Report for fiscal year ending in 12/2023.

Nonprofit
Nonprofit Corporation
Net patient revenue Info Net patient revenue — what the home actually collects for resident care, after contractual allowances, bad debt and discounts are subtracted from its gross charges (CMS cost report, Worksheet G-3). It covers resident care only; money the home earns from other sources is shown separately as "Other income."
$11.0M
Net patient income Info Net patient income: net patient revenue minus the home's total operating expenses. A positive figure means it earns more from resident care than it spends to deliver it; a negative figure means the opposite. It excludes non-operating "other income."
-$33.6M
Nonprofit Nonprofit Corporation
Net patient revenue Info Net patient revenue — what the home actually collects for resident care, after contractual allowances, bad debt and discounts are subtracted from its gross charges (CMS cost report, Worksheet G-3). It covers resident care only; money the home earns from other sources is shown separately as "Other income."
$11.0M Rank #10 / 257Revenue — State benchmarkedThis home is ranked 10th out of 257 homes in Florida. Shows this facility's annual revenue compared to the Florida average. Higher revenue generally means more resources for staffing and capital — read alongside Payroll %.Rankings are based only on facilities in Florida that report data for that category. Facilities without available data are excluded from the ranking.Click the rank badge to see the full State ranking.Click here to see the full State ranking.
Net patient income Info Net patient income: net patient revenue minus the home's total operating expenses. A positive figure means it earns more from resident care than it spends to deliver it; a negative figure means the opposite. It excludes non-operating "other income."
-$33.6M
Other income Info Money the home earns outside of resident care — such as investments, grants, rentals and other non-operating sources (CMS cost report, Worksheet G-3). It is tracked separately from net patient revenue: it is not part of that figure, and it is not included in net patient income.
$40.9M
Payroll costs Info Staff salaries plus wage-related costs — benefits such as payroll taxes, health insurance and retirement — from the home's own accounting records (CMS cost report, Worksheet A). Contract or agency labor is counted separately, under other operating costs. Rank #10 / 257Payroll — State benchmarkedThis home is ranked 10th out of 257 homes in Florida. Shows total annual staff payroll benchmarked to the Florida average. Higher payroll investment relative to peers often signals better staffing and less reliance on cheaper contract labor.Rankings are based only on facilities in Florida that report data for that category. Facilities without available data are excluded from the ranking.Click the rank badge to see the full State ranking.Click here to see the full State ranking.
$19.3M 175.5% of net patient revenue Info Payroll as a share of revenue: staff salaries and wage-related benefits divided by net patient revenue. A higher figure means more of each revenue dollar goes to staff pay. Rank #207 / 257Payroll % — State benchmarkedThis home is ranked 207th out of 257 homes in Florida. Shows payroll as a percentage of revenue versus the Florida average. Well-run Florida facilities typically land around 49–56% — the top third Statewide. Below 25% may signal understaffing or heavy agency use — read with Staffing ratings.Rankings are based only on facilities in Florida that report data for that category. Facilities without available data are excluded from the ranking.Click the rank badge to see the full State ranking.Click here to see the full State ranking.
Other operating costs Info Everything it costs to run the home apart from payroll — food, utilities, supplies, maintenance, contract labor and administration. Calculated as total operating expense minus payroll (staff salaries and wage-related benefits).
$25.2M
Total costs Info The home's total operating expense for the year — all the costs of running it, salaries included (CMS cost report, Worksheet G-3).
$44.6M

Who this home usually serves

TYPE OF STAY

Mix of rehab and long-term care

This home supports both short-term rehab and long-term care, with residents staying for a wide range of durations.

Most new residents arrive under private pay (55% of admissions), and a typical private pay stay runs around 2 - 3 months.

Admissions
468 total

Coverage residents most often arrive under.

Medicare 38%
Private pay 55%
Medicaid 6%
Discharges
482 total

Coverage residents most often leave under.

Medicare 26%
Private pay 69%
Medicaid 5%

Activities in this home

Places of interest near John Knox Village of Central Florida, Inc.

Address 0.8 miles from city center Info Estimated distance in miles from Orange City's city center to John Knox Village of Central Florida, Inc.'s address, calculated via Google Maps.

Calculate Travel Distance to John Knox Village of Central Florida, Inc.

Add your location

Address

Compare Nursing Homes around the area

The information below is reported by the Florida Agency for Health Care Administration (AHCA).

John Knox Village of Central Florida, Inc.
NH
AL
HC
IL
MC
NC
Orange City -60 - 19 -
Terracina Grand
NH
AL
IL
MC
RC
Naples -200 A+ 12 Studio / 1 Bed / 2 Bed
Brookdale DeLand
NH
AL
MC
Deland (Scarlett) -89 A+ 14 Studio / Suite
The Oaks of Clearwater
NH
AL
IL
MC
Clearwater (Oak Bluffs) -175 B- 64 Studio / 1 Bed / 2 Bed
Brookdale Palmer Ranch
NH
AL
IL
MC
Sarasota (Bee Ridge) -118 A+ 3 Studio / 1 Bed / 2 Bed

Frequently Asked Questions about John Knox Village of Central Florida, Inc.

What languages are spoken at John Knox Village of Central Florida, Inc.?

The team at John Knox Village of Central Florida, Inc. speaks English, Russian, and Spanish.

Is John Knox Village of Central Florida, Inc. in a walkable area?

John Knox Village of Central Florida, Inc. has a walk score of 19. Car-dependent. Most errands require a car, with limited nearby walkable options.

What is the license number of John Knox Village of Central Florida, Inc.?

According to FL state health department records, John Knox Village of Central Florida, Inc.'s license number is 5177.

When does John Knox Village of Central Florida, Inc.'s license expire?

According to FL state health department records, John Knox Village of Central Florida, Inc.'s license expires on September 4, 2026.

What is the occupancy rate at John Knox Village of Central Florida, Inc.?

John Knox Village of Central Florida, Inc.'s occupancy is 72%.

What payment types does John Knox Village of Central Florida, Inc. accept?

John Knox Village of Central Florida, Inc. accepts Other and VA.

Does John Knox Village of Central Florida, Inc. operate as a for-profit or non-profit?

John Knox Village of Central Florida, Inc. is registered as a non-profit in FL.

Guides for Better Senior Living

Care Cost Calculator: See Prices in Your Area

Nursing Home Data Explorer

Don’t Wait Too Long: 7 Red Flag Signs Your Parent Needs Assisted Living Now

The True Cost of Assisted Living in 2025 – And How Families Are Paying For It

Understanding Senior Living Costs: Pricing Models, Discounts & Financial Assistance