Kirkwood By the River
Nursing Home, Assisted Living, Independent Living & Memory Care · Birmingham, AL
CMS overall rating Info CMS (the Centers for Medicare & Medicaid Services) is the federal agency that rates nursing home quality. Its Overall Rating runs from 1 to 5 stars, combining health inspections, staffing, and quality measures, with inspections weighted most heavily.

Kirkwood By the River

Nursing Home, Assisted Living, Independent Living & Memory Care · Birmingham, AL
CMS overall rating Info CMS (the Centers for Medicare & Medicaid Services) is the federal agency that rates nursing home quality. Its Overall Rating runs from 1 to 5 stars, combining health inspections, staffing, and quality measures, with inspections weighted most heavily.
Calculator: See prices in your area
Kirkwood By the River accepts Medicare and private pay.

Overview of Kirkwood by the River

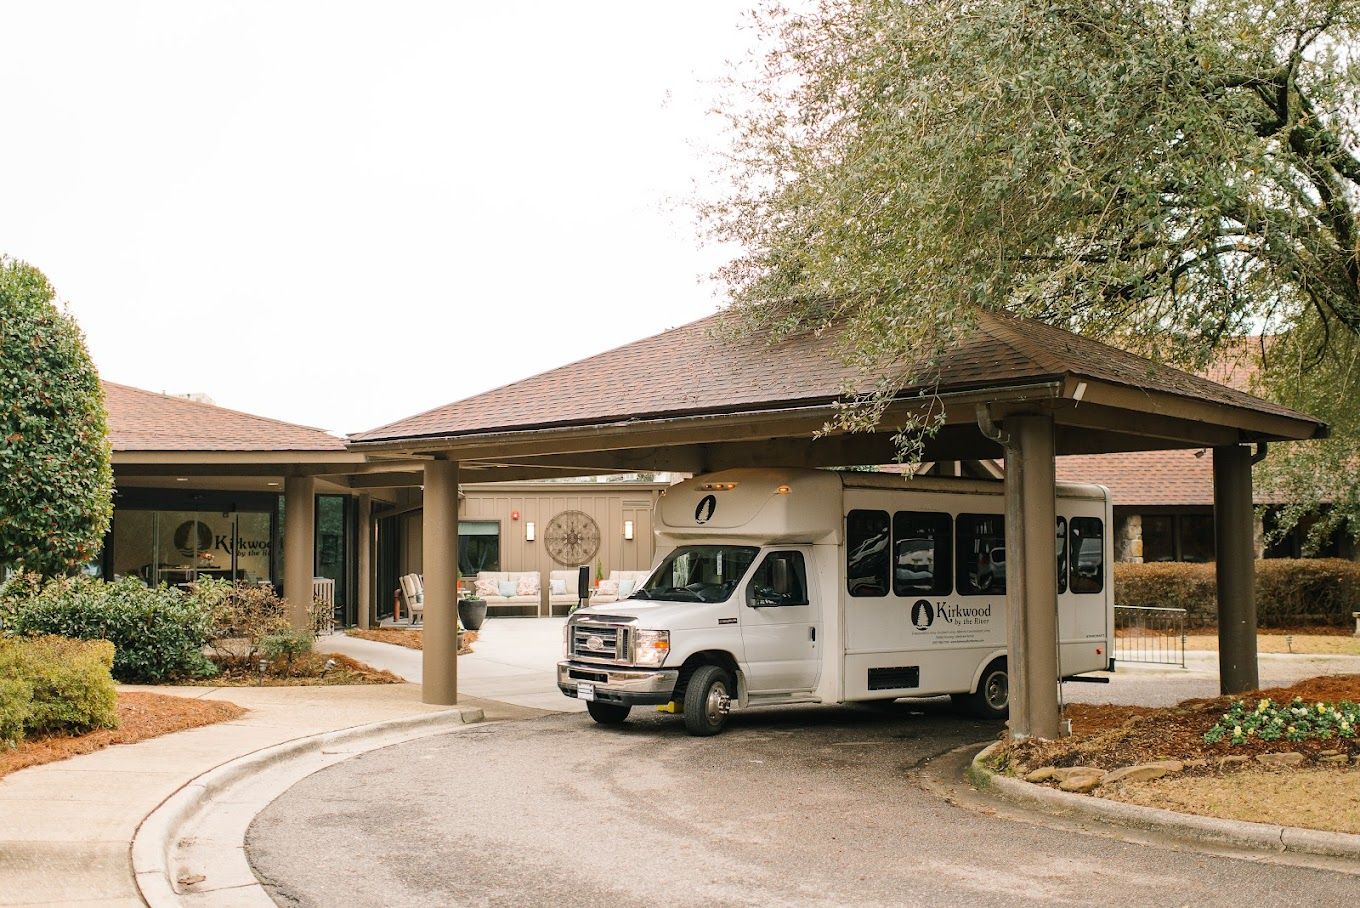
Resting on 120 acres of serene lands on Ratliff Road, Birmingham, AL, Kirkwood by the River is a charming senior living community that offers assisted living, independent living, memory care, and skilled nursing. Experience unparalleled comfort and convenience with cozy and elegant residences in variations of studio, one-bedroom, and two-bedroom floor plans. With a compassionate and highly skilled team providing top-tier care and assistance around the clock, seniors let go of their worries and make the most of their best years.

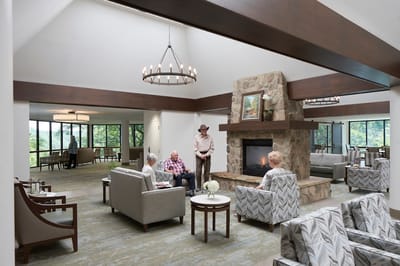
Have a balance of independence and utmost support in your retirement with Kirkwood by the River. Mingle with friends and learn new things through enjoyable activities and engaging programs. Moreover, delicious and healthy meals are available to meet residents’ dietary needs and tastes. Kirkwood by the River strives to enhance seniors’ quality of life with care plans that best match seniors’ needs and preferences.

Quality ratings

Measured by Centers for Medicare & Medicaid Services (CMS)

Overall rating Info The Overall CMS Rating combines results from health inspections, staffing levels and quality measures. Health inspections carry the most weight. Staffing and quality scores can increase or decrease the final rating based on performance compared to state and national standards.
Health Inspection Info Based on the results of the facility's three most recent standard inspections and any complaint investigations. CMS reviews the number, scope, and severity of deficiencies, with more recent findings weighted more heavily.
Staffing Info Measures average nursing staff hours per resident per day, including Registered Nurses (RNs) and total nursing staff. Ratings are adjusted based on the level of care residents require and are compared to state and national benchmarks.
Quality Measures Info Based on clinical and physical health indicators reported to CMS, such as hospital readmissions, falls, pressure ulcers, and improvements in mobility. These measures reflect how well residents' health needs are being managed.

Staffing hours breakdown

Info Daily nursing hours per resident by staff type, reported to CMS. Higher is generally better — compare this facility to state and national averages to see where staffing stands.

Hours per resident per day — compared to state averages

Total nursing care / resident Info Total adjusted nursing hours per resident per day, combining RN, LPN, and aide time. CMS adjusts this for case-mix so facilities can be fairly compared.
5h 6m per day
Rank #17 / 136Nurse hours — State benchmarkedThis home is ranked 17th out of 136 homes in Alabama. Shows adjusted nurse hours per resident per day benchmarked to the Alabama average, with a ranking across 136 Alabama facilities. More hours mean more direct care. The national average is about 3.5 hrs; below 3.0 is a red flag.Rankings are based only on facilities in Alabama that report data for that category. Facilities without available data are excluded from the ranking.Click the rank badge to see the full State ranking.Click here to see the full State ranking.
vs avg

2 of 6 metrics below state avg

Standout metric LPN / LVN is +75% above state avg
Staff typeHours / Day / Residentvs state avg
Registered Nurse (RN) Info RNs hold the highest nursing license and can assess residents, interpret test results, and direct care plans. More RN hours per day often signals stronger clinical oversight and faster response to health changes. 35m per day ▼ 7% State avg: 38m per day · National avg: 41m per day
LPN / LVN Info Licensed Practical Nurses (LPNs) or Licensed Vocational Nurses (LVNs) deliver routine hands-on care — medication administration, wound dressing, and monitoring vital signs. They work under RN supervision and make up a large share of daily bedside care. 1h 22m per day ▲ 75% State avg: 47m per day · National avg: 52m per day
Nurse Aide Info Certified Nurse Aides (CNAs) provide the most direct day-to-day assistance: bathing, dressing, feeding, and mobility. Nurse aide hours are typically the largest staffing category and directly affect residents' quality of life. 2h 38m per day ▲ 6% State avg: 2h 30m per day · National avg: 2h 20m per day
Weekend Total Nursing Info Combined nursing hours (RN + LPN + Nurse Aide) per resident per day on weekends. Staffing often drops on weekends — this figure reveals whether the facility maintains adequate coverage outside of weekday hours. 4h 9m per day ▲ 26% State avg: 3h 17m per day · National avg: 3h 26m per day
Physical Therapist Info Hours per resident per day provided by licensed Physical Therapists (PTs) or PT Assistants. PT services help residents recover mobility after injury or illness and are especially important for post-acute (short-stay) rehabilitation. 1m per day ▼ 36% State avg: 2m per day · National avg: 4m per day
Weekend RN Info Registered nurse hours specifically on weekends. Facilities sometimes reduce RN presence on Saturdays and Sundays — a low weekend RN figure compared to weekday hours can indicate reduced clinical oversight when most administrative staff are absent. 33m per day ▲ 50% State avg: 22m per day · National avg: 28m per day

Capacity and availability

Avg. Length of Stay
88 days
Bed community size
46-bed community Rank #195 / 245Bed count — State benchmarkedThis home is ranked 195th out of 245 homes in Alabama. Shows this facility's certified or reported bed count compared to other Alabama facilities. Larger communities may offer more amenities, programs, and on-site services for residents and families.Rankings are based only on facilities in Alabama that report data for that category. Facilities without available data are excluded from the ranking.Click the rank badge to see the full State ranking.Click here to see the full State ranking.
A moderately sized community that may balance personal attention with shared amenities and social activities.
Years in operation
46 years in operation
A longer operating history, which may indicate experience navigating regulations and delivering ongoing care.
Walk Score
Walk Score: 0 / 100 Rank #395 / 418Walk Score — State benchmarkedThis home is ranked 395th out of 418 homes in Alabama. Shows how walkable this facility's neighborhood is compared to the average Walk Score across Alabama facilities. Higher scores benefit residents, families, and staff.Rankings are based only on facilities in Alabama that report data for that category. Facilities without available data are excluded from the ranking.Click the rank badge to see the full State ranking.Click here to see the full State ranking.
Car-dependent. Most errands require a car, with limited nearby walkable options.
BBB Rating
BBB Rating: A+ (Accredited)
An independent rating from the Better Business Bureau based on factors such as complaint history, transparency, and business practices.
How BBB ratings work

About this community

Occupancy

Occupancy rate
100%
Rank #1 / 138Occupancy rate — State benchmarkedThis home is ranked 1st out of 138 homes in Alabama. Shows this facility's occupancy rate versus the Alabama average, with its Statewide rank out of 138. Higher occupancy signals strong local demand and financial stability.Rankings are based only on facilities in Alabama that report data for that category. Facilities without available data are excluded from the ranking.Click the rank badge to see the full State ranking.Click here to see the full State ranking.
Higher than the Alabama average: 80.8%
Occupied beds
46 / 46
Average occupied beds in Alabama homes 97 beds

License Details

Facility TypeAssisted Living Facility
StatusRegular
CountyJefferson
Business TypeNonprofit Corporation
CMS Certification Number15457

Ownership & Operating Entity

Kirkwood By the River is administered by Jeff Burchfield.

Staffing

Key information about the people who lead and staff this community.

Leadership

ContactMr. Chad Carter, President/CEO

Contact Kirkwood By the River

Inspection History

In Alabama, the Department of Public Health, Bureau of Health Provider Standards conducts unannounced surveys to ensure facilities meet state licensing and federal certification safety standards.

Since 2018 · 8 years of data 13 deficiencies

Inspection Scorecard Info This scorecard compares key inspection, deficiency, and complaint metrics at this facility against the Alabama state average. Metrics rated ≥15% worse than average are highlighted in red; those ≥15% better are highlighted in green.

Since 2018 vs. Alabama state average
Overall vs. AL average 0 Worse No metrics in this bucket. 2 Better Metrics better than Alabama average:
• Total deficiencies (24% below)
• Deficiencies per year (24% below)
Latest Inspection October 6, 2021 Routine

Deficiencies Info Deficiencies are formal regulatory issues recorded during state inspections.

This FacilityAL Averagevs. AL Avg
Total deficiencies Info Formal regulatory issues recorded by inspectors across all inspection types. 1317 This facility has 24% fewer total deficiencies than a typical Alabama assisted living residence (13 vs. AL avg 17).↓ 24% better
Deficiencies per year Info Average deficiencies per year since 2018. 1.62.1 This facility has 24% fewer deficiencies per year than a typical Alabama assisted living residence (1.6 vs. AL avg 2.1).↓ 24% better

Inspection Reports Summary Info An editor-reviewed summary of the themes and findings across this facility's recent inspection reports.

  • October 6, 2021 inspection found one infection control deficiency involving laundry staff failing to change gloves and sanitize hands between residents, risking cross contamination.
  • March 28, 2019 inspection identified seven deficiencies including food safety lapses, improper glove use by CNA, and laundry handling errors, with no immediate jeopardy but multiple infection control and food service issues.
  • March 22, 2018 complaint investigation substantiated failures in medication administration, wound care, and staff using personal cell phones during resident care, totaling five deficiencies affecting resident safety and dignity.

Health Inspection History

Inspections since 2018
Total health inspections 3

State average N/A


Last Health inspection on Oct 2021

Total health citations
8 Rank #49 / 136Health citations — State benchmarkedThis home is ranked 49th out of 136 homes in Alabama. Shows this facility's total health deficiency citations benchmarked to the Alabama State average, with a ranking across all 136 AL facilities. Lower citation counts earn a better rank.Rankings are based only on facilities in Alabama that report data for that category. Facilities without available data are excluded from the ranking.Click the rank badge to see the full State ranking.Click here to see the full State ranking.

State average N/A

Citations per inspection
2.67 Rank #40 / 136Citations per inspection — State benchmarkedThis home is ranked 40th out of 136 homes in Alabama. Shows average deficiency citations per CMS inspection for this facility versus the Alabama mean across 136 facilities with citation data. Lower is better.Rankings are based only on facilities in Alabama that report data for that category. Facilities without available data are excluded from the ranking.Click the rank badge to see the full State ranking.Click here to see the full State ranking.

State average N/A


Health citations are formal notices following inspections when they fail to comply with safety and care standards.

All 8 citations resulted from standard inspections.

Breakdown of citation severity (last 8 years)
Critical health citations
0
In line with State average

State average: N/A


Serious health citations
0
In line with State average

State average: N/A

0 critical citations State average: N/A

0 serious citations State average: N/A

8 moderate citations State average: N/A

0 minor citations State average: N/A
Citations history (last 8 years)
Infection Control moderate citation Oct 07, 2021
Corrected

Infection Control moderate citation Mar 28, 2019
Corrected

Nutrition moderate citation Mar 28, 2019
Corrected

Infection Control moderate citation Mar 22, 2018
Corrected

Staffing Data

Reporting period: October 1 – December 31, 2025 (Q4 2025). Source: CMS Payroll-Based Journal report.

Total staff 117
Employees 60
Contractors 57
Staff to resident ratio 2.85 : 1
0% compared with State average

State average ratio: 0 : 0

Avg staff/day 34
Average shift 8.4 hours
0% compared with State average

State average: 0 hours

Total staff hours (quarter) 26,123

Nursing staff breakdown

Q4 2025 · Oct 1 – Dec 31 More info This data comes from the CMS Payroll-Based Journal report covering October 1 – December 31, 2025.
Registered Nurse

Manages medical care and health needs.

RN Staff Info 7 total: 3 full-time employees and 4 contractors. 7
Average shift length Info Average shift length. Calculated as total hours divided by days worked and average staff per day. 10.7 hours
Licensed Practical Nurse

Assists with medical care and medications.

LPN Staff Info 4 total: 2 full-time employees and 2 contractors. 4
Average shift length Info Average shift length. Calculated as total hours divided by days worked and average staff per day. 9.5 hours
Certified Nursing Assistant

Helps with daily care and mobility.

CNA Staff Info 60 total: 37 full-time employees and 23 contractors. 60
Average shift length Info Average shift length. Calculated as total hours divided by days worked and average staff per day. 8.2 hours

Contractor staffing

Q4 2025 · Oct 1 – Dec 31 More info This data comes from the CMS Payroll-Based Journal report covering October 1 – December 31, 2025.

Total hours from contractors

13.1%

3,414 contractor hours this quarter

Certified Nursing Assistant: 23 Respiratory Therapy Technician: 8 Physical Therapy Aide: 7 Registered Nurse: 4 Qualified Social Worker: 4 Physical Therapy Assistant: 3 Speech Language Pathologist: 3 Licensed Practical Nurse: 2 Occupational Therapy Aide: 1 Medical Director: 1 Occupational Therapy Assistant: 1

Staff by category

Q4 2025 · Oct 1 – Dec 31 More info This data comes from the CMS Payroll-Based Journal report covering October 1 – December 31, 2025.
Certified Nursing Assistant37236013,38692100%8.2
RN Director of Nursing130135,78092100%10.1
Registered Nurse3471,82592100%10.7
Licensed Practical Nurse2241,1578390%9.5
Speech Language Pathologist0337536571%6.1
Qualified Social Worker0447336773%5.7
Clinical Nurse Specialist3037027076%7.4
Physical Therapy Assistant0336186368%7.3
Nurse Practitioner1014565762%8
Dietitian1014076065%6.8
Respiratory Therapy Technician0881084246%2.5
Occupational Therapy Aide011792022%3.9
Medical Director011483538%1.4
Physical Therapy Aide077451112%3.7
Occupational Therapy Assistant0112744%6.8
60 Certified Nursing Assistant
% of Days 100%
13 RN Director of Nursing
% of Days 100%
7 Registered Nurse
% of Days 100%
4 Licensed Practical Nurse
% of Days 90%
3 Speech Language Pathologist
% of Days 71%
4 Qualified Social Worker
% of Days 73%
3 Clinical Nurse Specialist
% of Days 76%
3 Physical Therapy Assistant
% of Days 68%
1 Nurse Practitioner
% of Days 62%
1 Dietitian
% of Days 65%
8 Respiratory Therapy Technician
% of Days 46%
1 Occupational Therapy Aide
% of Days 22%
1 Medical Director
% of Days 38%
7 Physical Therapy Aide
% of Days 12%
1 Occupational Therapy Assistant
% of Days 4%

Penalties and fines

Federal penalties imposed by CMS for regulatory violations, including civil money penalties (fines) and denials of payment for new Medicare/Medicaid admissions.

Source: CMS Penalties Database

No penalties in the past 3 years

No civil money penalties or payment denials were reported in the last 3 years.

Quality of care over time

These measures show how residents usually do over time at this home, based on health outcomes and preventive care.

High-risk clinical events score Info A composite score based on pressure ulcers, falls with injury, weight loss, walking ability decline, and activities of daily living decline. 15.2
71% worse than State average

State average: 8.9

Functional decline score Info A composite score based on activities of daily living decline, walking ability decline, and incontinence. 27.3
88% worse than State average

State average: 14.5

Long-stay resident measures
Significantly below average State avg: 3.3 Info CMS star rating based on long-stay quality measure performance. 5 stars = significantly above average, 1 star = significantly below average.
Need for Help with Daily Activities Increased Info Percent of long-stay residents whose need for help with daily activities has increased 37.0%
167% worse than State average

State average: 13.9%

Low Risk Residents with Bowel/Bladder Incontinence Info Percent of low risk long-stay residents who lose control of their bowels or bladder 17.5%
28% worse than State average

State average: 13.6%

Falls with Major Injury Info Percent of long-stay residents experiencing one or more falls with major injury 5.7%
69% worse than State average

State average: 3.4%

High Risk Residents with Pressure Ulcers Info Percent of long-stay high risk residents with pressure ulcers 10.8%
82% worse than State average

State average: 5.9%

Urinary Tract Infection Info Percent of long-stay residents with a urinary tract infection 2.9%
7% worse than State average

State average: 2.7%

Lost Too Much Weight Info Percent of long-stay residents who lose too much weight 7.4%
37% worse than State average

State average: 5.4%

Depressive Symptoms Info Percent of long-stay residents who have depressive symptoms 0.0%
100% better than State average

State average: 1.2%

Antipsychotic Use Info Percent of long-stay residents who received an antipsychotic medication 33.9%
64% worse than State average

State average: 20.7%

Pneumococcal Vaccine Info Percent of long-stay residents assessed and appropriately given the pneumococcal vaccine 100.0%
9% better than State average

State average: 91.5%

Influenza Vaccine Info Percent of long-stay residents assessed and appropriately given the seasonal influenza vaccine 98.0%
In line with State average

State average: 94.8%

Hospitalizations per 1,000 days Info Number of hospitalizations per 1,000 long-stay resident days. 1.61
20% better than State average

State average: 2.00

ED visits per 1,000 days Info Number of outpatient emergency department visits per 1,000 long-stay resident days. 0.71
60% better than State average

State average: 1.79

Short-stay resident measures
Significantly below average State avg: 2.1 Info CMS star rating based on short-stay quality measure performance. 5 stars = much above average, 1 star = much below average.
Pneumococcal Vaccine Info Percent of short-stay residents assessed and appropriately given the pneumococcal vaccine 100.0%
19% better than State average

State average: 83.7%

Antipsychotic medication increase Info Percent of short-stay residents who newly received an antipsychotic medication 2.9%
37% worse than State average

State average: 2.1%

Influenza Vaccine Info Percent of short-stay residents assessed and appropriately given the seasonal influenza vaccine 98.4%
23% better than State average

State average: 80.3%

Re-hospitalized after SNF stay Info Percentage of short-stay residents who were re-hospitalized after their nursing home admission. 55.0%
124% worse than State average

State average: 24.5%

Emergency department visits Info Percentage of short-stay residents who had an outpatient emergency department visit. 16.8%
46% worse than State average

State average: 11.5%

Falls with major injury Info Percentage of SNF residents who experience falls with major injury during their stay. 2.6%
242% worse than State average

State average: 0.8%

Ability to care for self at discharge Info Percentage of residents at or above expected ability to care for themselves at discharge. 38.9%
28% worse than State average

State average: 53.7%

Successful return to home or community Info Rate of successful return to home or community from a skilled nursing facility. 42.7%
16% worse than State average

State average: 50.6%

Breakdown by payment type

Medicare

47% of new residents, usually for short-term rehab.

Typical stay 20 days

Private pay

53% of new residents, often for short stays.

Typical stay 4 - 5 months

Facility Characteristics

Source: CMS Long-Term Care Facility Characteristics (Data as of Jan 2026)

Total residents 41
Medicare
4
9.8% of residents
Private pay or other
37
90.2% of residents
Programs & Services
Residents Group

Residents meet regularly to discuss policies, care quality, and activities

CCRC

Part of a Continuing Care Retirement Community offering multiple care levels

Active Resident Council

Organized group of residents that meets regularly to discuss facility policies, quality of life, and activities.

Finances and operations

Based on CMS SNF Cost Report for fiscal year ending in 12/2023.

Nonprofit
Nonprofit Corporation
Net patient revenue Info Net patient revenue — what the home actually collects for resident care, after contractual allowances, bad debt and discounts are subtracted from its gross charges (CMS cost report, Worksheet G-3). It covers resident care only; money the home earns from other sources is shown separately as "Other income."
$14.5M
Net patient income Info Net patient income: net patient revenue minus the home's total operating expenses. A positive figure means it earns more from resident care than it spends to deliver it; a negative figure means the opposite. It excludes non-operating "other income."
-$1.1M
Nonprofit Nonprofit Corporation
Net patient revenue Info Net patient revenue — what the home actually collects for resident care, after contractual allowances, bad debt and discounts are subtracted from its gross charges (CMS cost report, Worksheet G-3). It covers resident care only; money the home earns from other sources is shown separately as "Other income."
$14.5M Rank #31 / 135Revenue — State benchmarkedThis home is ranked 31st out of 135 homes in Alabama. Shows this facility's annual revenue compared to the Alabama average. Higher revenue generally means more resources for staffing and capital — read alongside Payroll %.Rankings are based only on facilities in Alabama that report data for that category. Facilities without available data are excluded from the ranking.Click the rank badge to see the full State ranking.Click here to see the full State ranking.
Net patient income Info Net patient income: net patient revenue minus the home's total operating expenses. A positive figure means it earns more from resident care than it spends to deliver it; a negative figure means the opposite. It excludes non-operating "other income."
-$1.1M
Other income Info Money the home earns outside of resident care — such as investments, grants, rentals and other non-operating sources (CMS cost report, Worksheet G-3). It is tracked separately from net patient revenue: it is not part of that figure, and it is not included in net patient income.
$1.1M
Payroll costs Info Staff salaries plus wage-related costs — benefits such as payroll taxes, health insurance and retirement — from the home's own accounting records (CMS cost report, Worksheet A). Contract or agency labor is counted separately, under other operating costs. Rank #33 / 135Payroll — State benchmarkedThis home is ranked 33rd out of 135 homes in Alabama. Shows total annual staff payroll benchmarked to the Alabama average. Higher payroll investment relative to peers often signals better staffing and less reliance on cheaper contract labor.Rankings are based only on facilities in Alabama that report data for that category. Facilities without available data are excluded from the ranking.Click the rank badge to see the full State ranking.Click here to see the full State ranking.
$7.2M 49.9% of net patient revenue Info Payroll as a share of revenue: staff salaries and wage-related benefits divided by net patient revenue. A higher figure means more of each revenue dollar goes to staff pay. Rank #90 / 133Payroll % — State benchmarkedThis home is ranked 90th out of 133 homes in Alabama. Shows payroll as a percentage of revenue versus the Alabama average. Well-run Alabama facilities typically land around 54–69% — the top third Statewide. Below 25% may signal understaffing or heavy agency use — read with Staffing ratings.Rankings are based only on facilities in Alabama that report data for that category. Facilities without available data are excluded from the ranking.Click the rank badge to see the full State ranking.Click here to see the full State ranking.
Other operating costs Info Everything it costs to run the home apart from payroll — food, utilities, supplies, maintenance, contract labor and administration. Calculated as total operating expense minus payroll (staff salaries and wage-related benefits).
$8.4M
Total costs Info The home's total operating expense for the year — all the costs of running it, salaries included (CMS cost report, Worksheet G-3).
$15.6M

What does this home offer?

Housing options icon

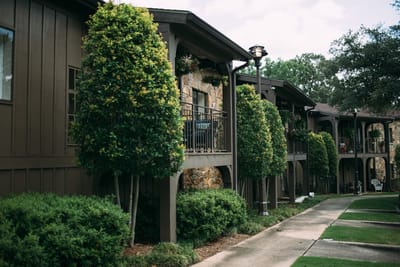
Housing Options: Studio / 1 Bed / 2 Bed

Building type icon
Building type icon

Building Type: 2-story

Transportation services icon

Transportation Services

Fitness and recreation icon

Fitness and Recreation

Who this home usually serves

TYPE OF STAY

Mix of rehab and long-term care

This home supports both short-term rehab and long-term care, with residents staying for a wide range of durations.

Most new residents arrive under private pay (53% of admissions), and a typical private pay stay runs around 4 - 5 months.

Admissions
182 total

Coverage residents most often arrive under.

Medicare 47%
Private pay 53%
Discharges
167 total

Coverage residents most often leave under.

Medicare 41%
Private pay 59%

Managed by Chad Carter

President and CEO

18 years of experience

Chad Carter has served Kirkwood by the River since 2014, bringing nearly two decades of senior care industry experience. A licensed Nursing Home Administrator for 18 years, Chad is dedicated to leading with care, kindness, and respect, honoring the senior population through his leadership in nonprofit, multi-family life plan communities.

Places of interest near Kirkwood By the River

Address 3605 Ratliff Rd, Birmingham, AL 35210

Calculate Travel Distance to Kirkwood By the River

Add your location

Address

Compare Nursing Homes around the area

The information below is reported by the Alabama Department of Public Health, Bureau of Health Provider Standards.

Kirkwood By the River
NH
AL
IL
MC
Birmingham (Overton) -46 A+ 0 Studio / 1 Bed / 2 Bed
Regency Retirement Village of Huntsville
NH
AL
IL
MC
Huntsville (Greenhill) -104 - 44 -
Athens Health and Rehabilitation, LLC
NH
PC
Athens -149 A+ 0 -
Ahepa 3 Senior Apartments
NH
IL
Hoover -101 - 26 1 Bed
Keller Landing
NH
MC
Tuscumbia (South Sheffield) -109 - 48 Private / Semi-Private Rooms

Frequently Asked Questions about Kirkwood By the River

What neighborhood is Kirkwood By the River in?

Kirkwood By the River is in the Overton neighborhood of Birmingham.

What is the occupancy rate at Kirkwood By the River?

Kirkwood By the River's occupancy is 100%.

Does Kirkwood By the River operate as a for-profit or non-profit?

Kirkwood By the River is registered as a non-profit in AL.

Who is the administrator of Kirkwood By the River?

Jeff Burchfield is the administrator of Kirkwood By the River.

How many beds does Kirkwood By the River have?

Kirkwood By the River has 46 beds.

Are there photos of Kirkwood By the River?

Yes — there are 3 photos of Kirkwood By the River in the photo gallery on this page.

What is the address of Kirkwood By the River?

Kirkwood By the River is located at 3605 Ratliff Rd, Birmingham, AL 35210.

Guides for Better Senior Living

Care Cost Calculator: See Prices in Your Area

Nursing Home Data Explorer

Don’t Wait Too Long: 7 Red Flag Signs Your Parent Needs Assisted Living Now

The True Cost of Assisted Living in 2025 – And How Families Are Paying For It

Understanding Senior Living Costs: Pricing Models, Discounts & Financial Assistance