Kline Galland Home
Nursing Home, Assisted Living, Home Care, Hospice Care, Memory Care, Nursing Care & Palliative Care · Seattle, WA
CMS overall rating Info CMS (the Centers for Medicare & Medicaid Services) is the federal agency that rates nursing home quality. Its Overall Rating runs from 1 to 5 stars, combining health inspections, staffing, and quality measures, with inspections weighted most heavily.

Kline Galland Home

Nursing Home, Assisted Living, Home Care, Hospice Care, Memory Care, Nursing Care & Palliative Care · Seattle, WA
CMS overall rating Info CMS (the Centers for Medicare & Medicaid Services) is the federal agency that rates nursing home quality. Its Overall Rating runs from 1 to 5 stars, combining health inspections, staffing, and quality measures, with inspections weighted most heavily.
Calculator: See prices in your area
Kline Galland Home accepts Medicare, Medicaid, and private pay.

Overview of Kline Galland Home

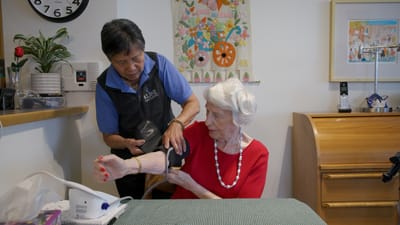
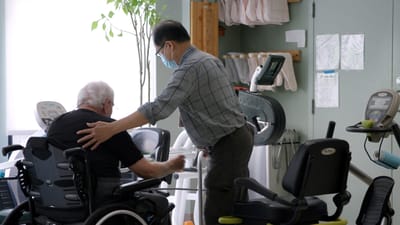
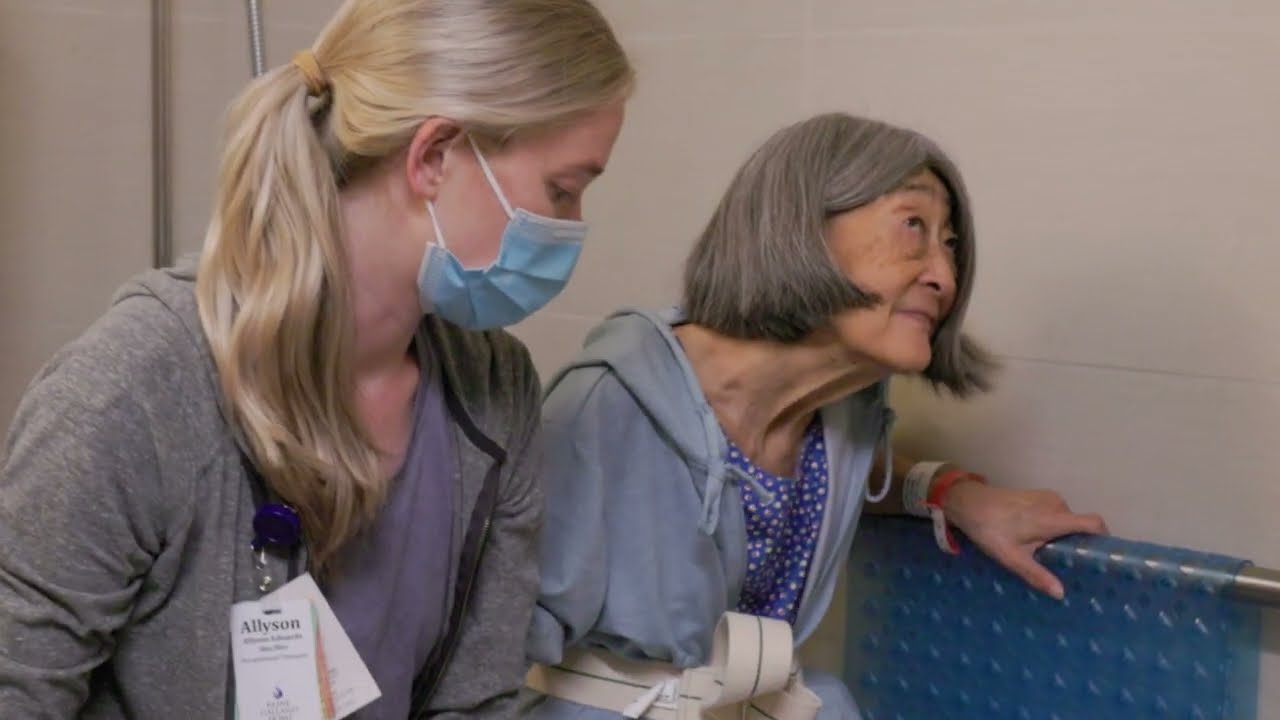
Conveniently located in a serene area in Seattle, WA, Kline Galland Home is a peaceful retreat for those needing short-term rehabilitation, long-term care, and memory care. With a high caregiver-to-resident ratio, the community guarantees personalized and truly one-on-one attention. Those affected by Alzheimer’s and memory loss are cared for by a specially trained care team in an environment tailored to their unique needs.

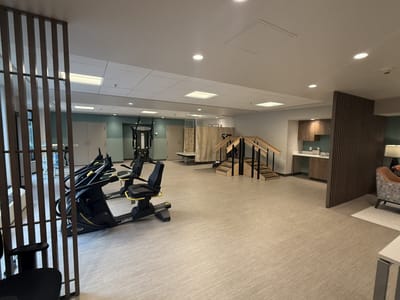
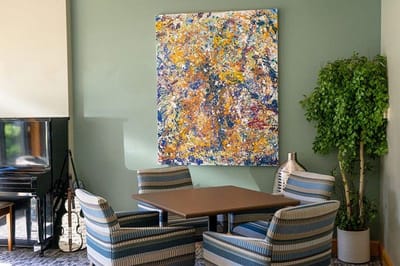
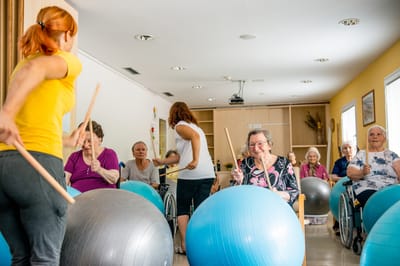
Residents’ daily lives are filled with an array of fun and enriching activities like exercise classes, games, and holiday celebrations. Meals are carefully prepared and served daily with accommodations for unique dietary needs and preferences. At Kline Galland Home, residents achieve their maximum potential in a safe and healing environment.

Quality ratings

Measured by Centers for Medicare & Medicaid Services (CMS)

Overall rating Info The Overall CMS Rating combines results from health inspections, staffing levels and quality measures. Health inspections carry the most weight. Staffing and quality scores can increase or decrease the final rating based on performance compared to state and national standards.
▲ 24.0% Above WA avg. ▲ 24.0% Above WA avg.WA average: 3.2Click the badge to see the full State ranking.Click here to see the full State ranking.
Health Inspection Info Based on the results of the facility's three most recent standard inspections and any complaint investigations. CMS reviews the number, scope, and severity of deficiencies, with more recent findings weighted more heavily.
▲ 42.1% Above WA avg. ▲ 42.1% Above WA avg.WA average: 2.8Click the badge to see the full State ranking.Click here to see the full State ranking.
Staffing Info Measures average nursing staff hours per resident per day, including Registered Nurses (RNs) and total nursing staff. Ratings are adjusted based on the level of care residents require and are compared to state and national benchmarks.
▼ 70.8% Below WA avg. ▼ 70.8% Below WA avg.WA average: 3.4Click the badge to see the full State ranking.Click here to see the full State ranking.
Quality Measures Info Based on clinical and physical health indicators reported to CMS, such as hospital readmissions, falls, pressure ulcers, and improvements in mobility. These measures reflect how well residents' health needs are being managed.
▲ 27.2% Above WA avg. ▲ 27.2% Above WA avg.WA average: 3.9Click the badge to see the full State ranking.Click here to see the full State ranking.

Staffing hours breakdown

Info Daily nursing hours per resident by staff type, reported to CMS. Higher is generally better — compare this facility to state and national averages to see where staffing stands.

Hours per resident per day — compared to Washington state averages

Total nursing care / resident Info This home is ranked 15th out of 90 homes in Washington for nurse hours. Total adjusted nursing hours per resident per day, combining RN, LPN, and aide time. CMS adjusts this for case-mix so facilities can be fairly compared.
4h 38m per day
Rank #15 / 90Nurse hours — State benchmarkedThis home is ranked 15th out of 90 homes in Washington. Shows adjusted nurse hours per resident per day benchmarked to the Washington average, with a ranking across 90 Washington facilities. More hours mean more direct care. The national average is about 3.5 hrs; below 3.0 is a red flag.Rankings are based only on facilities in Washington that report data for that category. Facilities without available data are excluded from the ranking.Click the rank badge to see the full State ranking.Click here to see the full State ranking.
This facility Washington avg (4h 13m per day)
vs Washington avg
+10%

2 of 6 metrics below state avg

Standout metric Nurse Aide is +57% above state avg
Staff typeHours / Day / Residentvs state avg
Registered Nurse (RN) Info RNs hold the highest nursing license and can assess residents, interpret test results, and direct care plans. More RN hours per day often signals stronger clinical oversight and faster response to health changes. 1h 12m per day ▲ 36% State avg: 53m per day · National avg: 41m per day
LPN / LVN Info Licensed Practical Nurses (LPNs) or Licensed Vocational Nurses (LVNs) deliver routine hands-on care — medication administration, wound dressing, and monitoring vital signs. They work under RN supervision and make up a large share of daily bedside care. 44m per day ▼ 10% State avg: 49m per day · National avg: 52m per day
Nurse Aide Info Certified Nurse Aides (CNAs) provide the most direct day-to-day assistance: bathing, dressing, feeding, and mobility. Nurse aide hours are typically the largest staffing category and directly affect residents' quality of life. 4h 12m per day ▲ 57% State avg: 2h 41m per day · National avg: 2h 21m per day
Weekend Total Nursing Info Combined nursing hours (RN + LPN + Nurse Aide) per resident per day on weekends. Staffing often drops on weekends — this figure reveals whether the facility maintains adequate coverage outside of weekday hours. 5h 8m per day ▲ 36% State avg: 3h 47m per day · National avg: 3h 26m per day
Physical Therapist Info Hours per resident per day provided by licensed Physical Therapists (PTs) or PT Assistants. PT services help residents recover mobility after injury or illness and are especially important for post-acute (short-stay) rehabilitation. 4m per day ▼ 20% State avg: 5m per day · National avg: 4m per day
Weekend RN Info Registered nurse hours specifically on weekends. Facilities sometimes reduce RN presence on Saturdays and Sundays — a low weekend RN figure compared to weekday hours can indicate reduced clinical oversight when most administrative staff are absent. 57m per day ▲ 50% State avg: 38m per day · National avg: 29m per day

Capacity and availability

This home usually has limited availability

Higher occupancy than the Washington average: 72.5%
Occupancy rate
93.5% Rank #31 / 310Occupancy rate — State benchmarkedThis home is ranked 31st out of 310 homes in Washington. Shows this facility's occupancy rate versus the Washington average, with its Statewide rank out of 310. Higher occupancy signals strong local demand and financial stability.Rankings are based only on facilities in Washington that report data for that category. Facilities without available data are excluded from the ranking.Click the rank badge to see the full State ranking.Click here to see the full State ranking.
Avg. Length of Stay
71 days
Bed community size
205-bed community Rank #5 / 366Bed count — State benchmarkedThis home is ranked 5th out of 366 homes in Washington. Shows this facility's certified or reported bed count compared to other Washington facilities. Larger communities may offer more amenities, programs, and on-site services for residents and families.Rankings are based only on facilities in Washington that report data for that category. Facilities without available data are excluded from the ranking.Click the rank badge to see the full State ranking.Click here to see the full State ranking.
A large-scale community that may provide a wide range of amenities, services, and structured programs.
Walk Score
Walk Score: 44 / 100 Rank #377 / 628Walk Score — State benchmarkedThis home is ranked 377th out of 628 homes in Washington. Shows how walkable this facility's neighborhood is compared to the average Walk Score across Washington facilities. Higher scores benefit residents, families, and staff.Rankings are based only on facilities in Washington that report data for that category. Facilities without available data are excluded from the ranking.Click the rank badge to see the full State ranking.Click here to see the full State ranking.
Somewhat walkable. A few nearby services may be reachable on foot, but most trips require transportation.

Safety & Compliance

Grab Bars
Emergency SystemsYes

Therapy & Rehabilitation

2 services
Rehabilitation Services
Short-Term Rehab

Staffing & Medical

1 service
Licensed Nurses/CNAs

Additional Services

1 service
Home Care

Amenities & Lifestyle

Gym
Spa
Dining Room
Restaurant
Bistro
Patio
Transportation
Concierge
Housekeeping
Laundry
ActivitiesYes
Wellness ProgramMemory Care program
Specific ProgramsMemory Support
Religious ServicesYes
Volunteer ProgramsYes
Touring Hoursmo-fr 08:00-17:00

Dining & Nutrition

Food DescriptionMeals are thoughtfully prepared according to kosher standards, and Jewish holidays are celebrated.

Contact Kline Galland Home

Staffing Data

Reporting period: July 1 – September 30, 2025 (Q3 2025). Source: CMS Payroll-Based Journal report.

Total staff 329
Employees 326
Contractors 3
Staff to resident ratio 3.05 : 1
64% more staff per resident than Washington average
Washington average ratio: 1.86 : 1 Washington average ratio: 1.86 : 1See full Washington ranking
Avg staff/day 153
Average shift 8.8 hours
9% better than Washington average
Washington average: 8.1 hours Washington average shift: 8.1 hoursSee full Washington ranking
Total staff hours (quarter) 123,344

Nursing staff breakdown

Q3 2025 · Jul 1 – Sep 30 More info This data comes from the CMS Payroll-Based Journal report covering July 1 – September 30, 2025.
Registered Nurse

Manages medical care and health needs.

RN Staff Info All 51 RN Staff are full-time employees. No contractors work on this role. 51
Average shift length Info Average shift length. Calculated as total hours divided by days worked and average staff per day. 8.9 hours
Licensed Practical Nurse

Assists with medical care and medications.

LPN Staff Info All 27 LPN Staff are full-time employees. No contractors work on this role. 27
Average shift length Info Average shift length. Calculated as total hours divided by days worked and average staff per day. 9.7 hours
Certified Nursing Assistant

Helps with daily care and mobility.

CNA Staff Info All 166 CNA Staff are full-time employees. No contractors work on this role. 166
Average shift length Info Average shift length. Calculated as total hours divided by days worked and average staff per day. 8.9 hours

Contractor staffing

Q3 2025 · Jul 1 – Sep 30 More info This data comes from the CMS Payroll-Based Journal report covering July 1 – September 30, 2025.

Total hours from contractors

0.1%

113 contractor hours this quarter

Occupational Therapy Assistant: 2 Medical Director: 1

Staff by category

Q3 2025 · Jul 1 – Sep 30 More info This data comes from the CMS Payroll-Based Journal report covering July 1 – September 30, 2025.
Certified Nursing Assistant166016664,87392100%8.9
Registered Nurse5105118,31992100%8.9
Licensed Practical Nurse2702710,81592100%9.7
Medication Aide/Technician170177,47592100%8.8
Nurse Aide in Training9093,31092100%9.9
Mental Health Service Worker8083,1939199%7.9
Clinical Nurse Specialist6062,9266672%8
RN Director of Nursing5052,2746773%8.1
Physical Therapy Assistant8082,1378592%7.7
Speech Language Pathologist7071,7878997%8.1
Dental Services Staff6061,5727885%7.1
Respiratory Therapy Technician6061,1348693%7.8
Occupational Therapy Aide2027856672%7.7
Qualified Social Worker3035467480%7.3
Other Social Services Staff1015046470%7.9
Nurse Practitioner1014565762%8
Physical Therapy Aide1014015762%7
Dietitian1013684751%7.8
Administrator1013604549%8
Occupational Therapy Assistant022895358%1.6
Medical Director011241213%2
166 Certified Nursing Assistant
% of Days 100%
51 Registered Nurse
% of Days 100%
27 Licensed Practical Nurse
% of Days 100%
17 Medication Aide/Technician
% of Days 100%
9 Nurse Aide in Training
% of Days 100%
8 Mental Health Service Worker
% of Days 99%
6 Clinical Nurse Specialist
% of Days 72%
5 RN Director of Nursing
% of Days 73%
8 Physical Therapy Assistant
% of Days 92%
7 Speech Language Pathologist
% of Days 97%
6 Dental Services Staff
% of Days 85%
6 Respiratory Therapy Technician
% of Days 93%
2 Occupational Therapy Aide
% of Days 72%
3 Qualified Social Worker
% of Days 80%
1 Other Social Services Staff
% of Days 70%
1 Nurse Practitioner
% of Days 62%
1 Physical Therapy Aide
% of Days 62%
1 Dietitian
% of Days 51%
1 Administrator
% of Days 49%
2 Occupational Therapy Assistant
% of Days 58%
1 Medical Director
% of Days 13%

Penalties and fines

Federal penalties imposed by CMS for regulatory violations, including civil money penalties (fines) and denials of payment for new Medicare/Medicaid admissions.

Source: CMS Penalties Database

No penalties in the past 3 years

No civil money penalties or payment denials were reported in the last 3 years.

Quality of care over time

These measures show how residents usually do over time at this home, based on health outcomes and preventive care.

High-risk clinical events score Info A composite score based on pressure ulcers, falls with injury, weight loss, walking ability decline, and activities of daily living decline. 10.7
6% worse than Washington average

Washington average: 10.0

Functional decline score Info A composite score based on activities of daily living decline, walking ability decline, and incontinence. 23.2
11% worse than Washington average

Washington average: 20.9

Long-stay resident measures
Significantly above average Washington avg: 3.6 Info CMS star rating based on long-stay quality measure performance. 5 stars = significantly above average, 1 star = significantly below average.
Need for Help with Daily Activities Increased Info Percent of long-stay residents whose need for help with daily activities has increased 18.8%
15% worse than Washington average

Washington average: 16.4%

Walking Ability Worsened Info Percent of long-stay residents whose ability to move independently worsened 23.9%
10% worse than Washington average

Washington average: 21.8%

Low Risk Residents with Bowel/Bladder Incontinence Info Percent of low risk long-stay residents who lose control of their bowels or bladder 26.9%
11% worse than Washington average

Washington average: 24.3%

Falls with Major Injury Info Percent of long-stay residents experiencing one or more falls with major injury 3.7%
42% worse than Washington average

Washington average: 2.6%

High Risk Residents with Pressure Ulcers Info Percent of long-stay high risk residents with pressure ulcers 2.9%
41% better than Washington average

Washington average: 4.9%

Urinary Tract Infection Info Percent of long-stay residents with a urinary tract infection 0.7%
59% better than Washington average

Washington average: 1.7%

Lost Too Much Weight Info Percent of long-stay residents who lose too much weight 4.0%
32% better than Washington average

Washington average: 5.8%

Depressive Symptoms Info Percent of long-stay residents who have depressive symptoms 95.4%
489% worse than Washington average

Washington average: 16.2%

Antipsychotic Use Info Percent of long-stay residents who received an antipsychotic medication 14.4%
In line with Washington average

Washington average: 14.5%

Pneumococcal Vaccine Info Percent of long-stay residents assessed and appropriately given the pneumococcal vaccine 94.4%
In line with Washington average

Washington average: 96.2%

Influenza Vaccine Info Percent of long-stay residents assessed and appropriately given the seasonal influenza vaccine 92.5%
In line with Washington average

Washington average: 93.8%

Hospitalizations per 1,000 days Info Number of hospitalizations per 1,000 long-stay resident days. 1.12
19% better than Washington average

Washington average: 1.38

ED visits per 1,000 days Info Number of outpatient emergency department visits per 1,000 long-stay resident days. 0.64
58% better than Washington average

Washington average: 1.51

Short-stay resident measures
Significantly above average Washington avg: 3.6 Info CMS star rating based on short-stay quality measure performance. 5 stars = much above average, 1 star = much below average.
Pneumococcal Vaccine Info Percent of short-stay residents assessed and appropriately given the pneumococcal vaccine 96.7%
10% better than Washington average

Washington average: 88.1%

Antipsychotic medication increase Info Percent of short-stay residents who newly received an antipsychotic medication 2.5%
74% worse than Washington average

Washington average: 1.4%

Influenza Vaccine Info Percent of short-stay residents assessed and appropriately given the seasonal influenza vaccine 83.0%
In line with Washington average

Washington average: 82.0%

Re-hospitalized after SNF stay Info Percentage of short-stay residents who were re-hospitalized after their nursing home admission. 21.9%
10% worse than Washington average

Washington average: 19.9%

Emergency department visits Info Percentage of short-stay residents who had an outpatient emergency department visit. 7.0%
47% better than Washington average

Washington average: 13.2%

Falls with major injury Info Percentage of SNF residents who experience falls with major injury during their stay. 0.3%
62% better than Washington average

Washington average: 0.8%

Ability to care for self at discharge Info Percentage of residents at or above expected ability to care for themselves at discharge. 43.5%
19% worse than Washington average

Washington average: 53.7%

Successful return to home or community Info Rate of successful return to home or community from a skilled nursing facility. 65.9%
30% better than Washington average

Washington average: 50.6%

Breakdown by payment type

Medicare

44% of new residents, usually for short-term rehab.

Typical stay 19 days

Private pay

48% of new residents, often for short stays.

Typical stay 2 - 3 months

Medicaid

8% of new residents, often for long-term daily care.

Typical stay 1 years

Facility Characteristics

Source: CMS Long-Term Care Facility Characteristics (Data as of Jan 2026)

Total residents 108
Medicare
15
13.9% of residents
Medicaid
91
84.3% of residents
Private pay or other
2
1.9% of residents
Programs & Services
Residents Group

Residents meet regularly to discuss policies, care quality, and activities

Active Resident Council

Organized group of residents that meets regularly to discuss facility policies, quality of life, and activities.

Finances and operations

Based on CMS SNF Cost Report for fiscal year ending in 12/2023.

Governmental community
Operated by a subsidized facility district.
Net patient revenue Info Net patient revenue — what the home actually collects for resident care, after contractual allowances, bad debt and discounts are subtracted from its gross charges (CMS cost report, Worksheet G-3). It covers resident care only; money the home earns from other sources is shown separately as "Other income."
$51.1M
Net patient income Info Net patient income: net patient revenue minus the home's total operating expenses. A positive figure means it earns more from resident care than it spends to deliver it; a negative figure means the opposite. It excludes non-operating "other income."
-$897.0K
Governmental community Operated by a subsidized facility district.
Net patient revenue Info Net patient revenue — what the home actually collects for resident care, after contractual allowances, bad debt and discounts are subtracted from its gross charges (CMS cost report, Worksheet G-3). It covers resident care only; money the home earns from other sources is shown separately as "Other income."
$51.1M Rank #2 / 94Revenue — State benchmarkedThis home is ranked 2nd out of 94 homes in Washington. Shows this facility's annual revenue compared to the Washington average. Higher revenue generally means more resources for staffing and capital — read alongside Payroll %.Rankings are based only on facilities in Washington that report data for that category. Facilities without available data are excluded from the ranking.Click the rank badge to see the full State ranking.Click here to see the full State ranking.
Net patient income Info Net patient income: net patient revenue minus the home's total operating expenses. A positive figure means it earns more from resident care than it spends to deliver it; a negative figure means the opposite. It excludes non-operating "other income."
-$897.0K
Other income Info Money the home earns outside of resident care — such as investments, grants, rentals and other non-operating sources (CMS cost report, Worksheet G-3). It is tracked separately from net patient revenue: it is not part of that figure, and it is not included in net patient income.
$3.3M
Payroll costs Info Staff salaries plus wage-related costs — benefits such as payroll taxes, health insurance and retirement — from the home's own accounting records (CMS cost report, Worksheet A). Contract or agency labor is counted separately, under other operating costs. Rank #1 / 94Payroll — State benchmarkedThis home is ranked 1st out of 94 homes in Washington. Shows total annual staff payroll benchmarked to the Washington average. Higher payroll investment relative to peers often signals better staffing and less reliance on cheaper contract labor.Rankings are based only on facilities in Washington that report data for that category. Facilities without available data are excluded from the ranking.Click the rank badge to see the full State ranking.Click here to see the full State ranking.
$36.6M 71.6% of net patient revenue Info Payroll as a share of revenue: staff salaries and wage-related benefits divided by net patient revenue. A higher figure means more of each revenue dollar goes to staff pay. Rank #9 / 94Payroll % — State benchmarkedThis home is ranked 9th out of 94 homes in Washington. Shows payroll as a percentage of revenue versus the Washington average. Well-run Washington facilities typically land around 53–61% — the top third Statewide. Below 25% may signal understaffing or heavy agency use — read with Staffing ratings.Rankings are based only on facilities in Washington that report data for that category. Facilities without available data are excluded from the ranking.Click the rank badge to see the full State ranking.Click here to see the full State ranking.
Other operating costs Info Everything it costs to run the home apart from payroll — food, utilities, supplies, maintenance, contract labor and administration. Calculated as total operating expense minus payroll (staff salaries and wage-related benefits).
$15.4M
Total costs Info The home's total operating expense for the year — all the costs of running it, salaries included (CMS cost report, Worksheet G-3).
$52.0M

What does this home offer?

Room sizes icon
Room sizes icon

Room Sizes: 590 / 710 / 725 / 880 / 980 / 1075 / 1350 sq. ft

Housing options icon

Housing Options: 1 Bed / 2 Bed

Building type icon
Building type icon

Building Type: Single-story

Security systems icon

Security Systems

Transportation services icon

Transportation Services
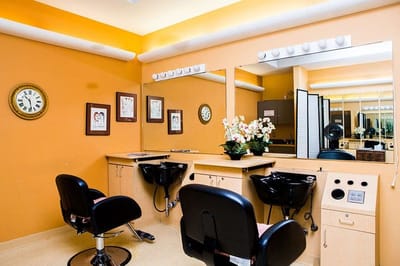
Beauty services icon

Beauty Services

Parking Available icon

Parking Available

Recreational activities icon

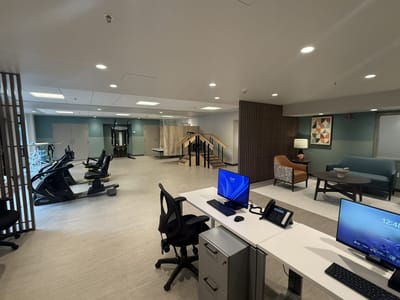
Recreational Activities
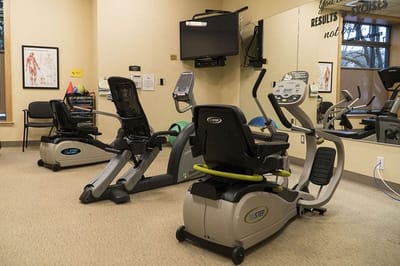
Exercise program icon

Exercise Programs

Who this home usually serves

TYPE OF STAY

Mix of rehab and long-term care

This home supports both short-term rehab and long-term care, with residents staying for a wide range of durations.

New residents most often arrive under private pay (48% of admissions), and a typical private pay stay runs around 2 - 3 months.

Admissions
968 total

Coverage residents most often arrive under.

Medicare 44%
Private pay 48%
Medicaid 8%
Discharges
983 total

Coverage residents most often leave under.

Medicare 30%
Private pay 58%
Medicaid 12%

Managed by Min An

Chief Operating Officer

30 years of experience

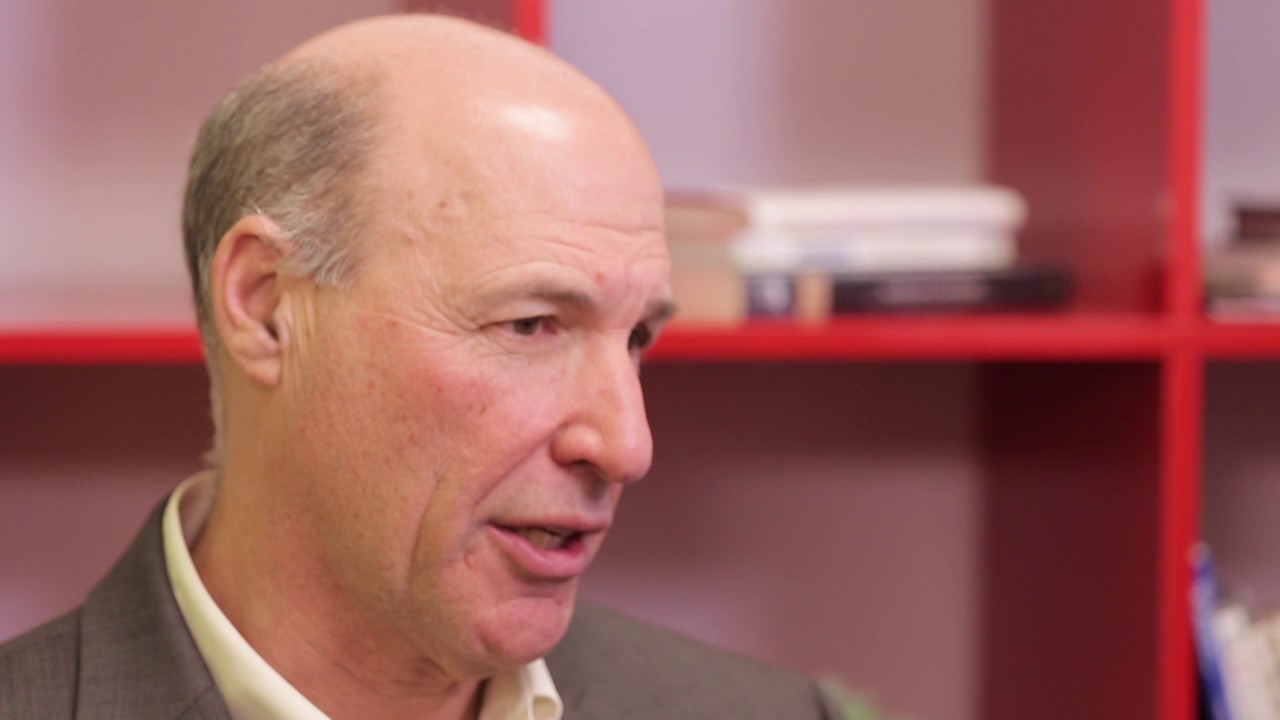
Min An is a licensed Nursing Home Administrator with 30 years of experience in long-term care. Since 2010, she has served as Chief Operating Officer at Kline Galland, overseeing long-term care, hospice, palliative, home care, and home health services. Min also taught quality assurance and improvement courses for Nursing Leadership and Management at the University of Washington. She holds a bachelor’s degree in nursing from Seattle University and completed the Geriatric Nurse Practitioner program at the University of Washington.

Places of interest near Kline Galland Home

Address 7.1 miles from city center Info Estimated distance in miles from Seattle's city center to Kline Galland Home's address, calculated via Google Maps.

Calculate Travel Distance to Kline Galland Home

Add your location

Address

Compare Assisted Living around Seattle

The information below is reported by the Washington Department of Social and Health Services, Residential Care Services.

Kline Galland Home
AL
HC
MC
NC
PC
NH
Seattle (Seward Park) -
205
Facility 205
WA AVG 82
Rank #5 / 366
-
44
Facility 44
WA AVG 51
Rank #377 / 628
1 Bed / 2 Bed
Mirabella Seattle
AL
MC
NH
Seattle (South Lake Union) -
63
Facility 63
WA AVG 82
Rank #237 / 366
A+
99
Facility 99
WA AVG 51
Rank #1 / 628
1 Bed / 2 Bed
Washington Care Center
AL
MC
NC
NH
RC
Seattle (Rainier Valley) -
165
Facility 165
WA AVG 82
Rank #9 / 366
A+
77
Facility 77
WA AVG 51
Rank #97 / 628
Studio
Kin On
AL
HC
NC
NH
Seattle (Rainier Valley) -
100
Facility 100
WA AVG 82
Rank #93 / 366
-
84
Facility 84
WA AVG 51
Rank #62 / 628
1 Bed / 2 Bed
Skyline
AL
IL
MC
NH
Seattle (Downtown Seattle) -
34
Facility 34
WA AVG 82
Rank #343 / 366
-
98
Facility 98
WA AVG 51
Rank #7 / 628
1 Bed / 2 Bed

Financial Assistance for
Assisted Living in Washington

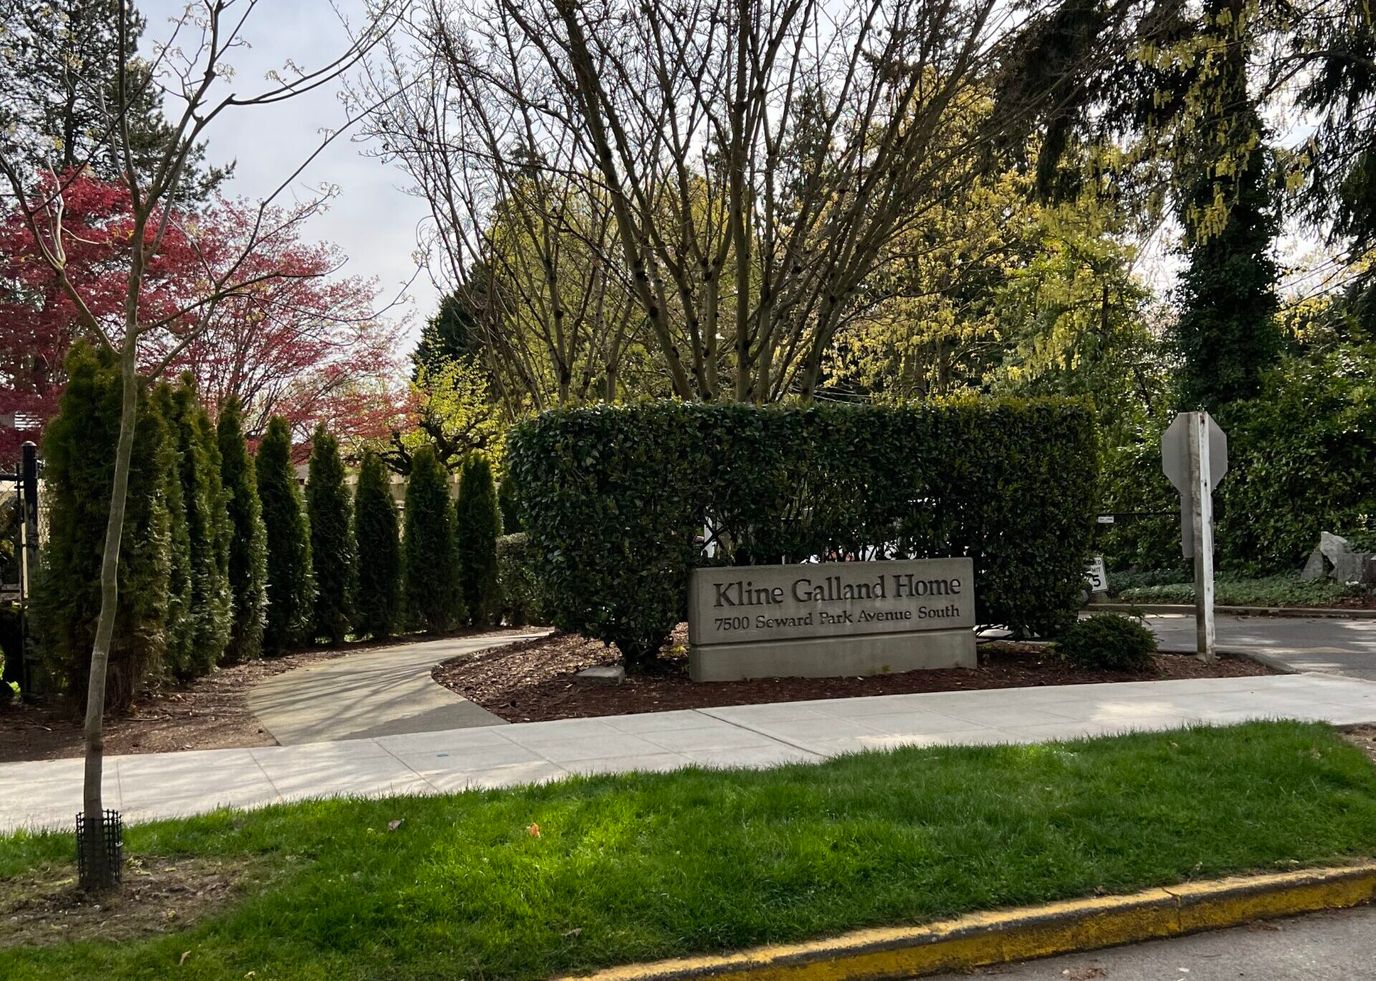
Kline Galland Home is located in Seattle, Washington.
Here are the financial assistance programs available to residents in Washington.

Get Financial aid guidance

Community Options Program Entry System (COPES)

WA Medicaid COPES

Age 65+ or disabled
General Washington resident, Medicaid-eligible, nursing home-level care need.
Income Limits (2025) ~$2,829/month 300% FBR, individual
Asset Limits $2,000 (individual), $3,000 (couple).
WA

High demand in urban areas (e.g., Seattle).

Benefits
Personal care (5-7 hours/day) Respite (240 hours/year) Adult day care ($70/day) Home modifications ($1,500 avg.)

Washington Family Caregiver Support Program

WA NFCSP

Age Caregiver of someone 60+ (or with dementia)
General Washington resident.
Income Limits No strict limit; prioritizes low-income.
Asset Limits Not applicable.
WA

High urban demand; rural outreach.

Benefits
In-home respite (4-6 hours/day) Adult day care (~$70/day) Short-term facility care (up to 5 days)

Community First Choice (CFC)

Washington Community First Choice

Age 65+ (or disabled 18+)
General WA resident, Medicaid-eligible, need help with 2+ ADLs/IADLs.
Income Limits (2025) ~$2,829/month; QIT optional.
Asset Limits $2,000 (individual), $3,000 (couple).
WA

Broader than COPES; serves ~20,000; self-directed option.

Benefits
Personal care (4-6 hours/day) Respite (~240 hours/year) Assistive devices Training Transportation

Older Americans Act (OAA) Services

Washington OAA Services

Age 60+
General WA resident; no income/asset limits.
Income Limits (2025) None; donations encouraged.
Asset Limits Not assessed.
WA

13 AAAs; includes Meals on Wheels; rural focus.

Benefits
Meals (~$5-$7/meal) Transportation Homemaker services (~4 hours/week) Respite (~5 days/year) Legal aid

Medicare Savings Program (MSP)

Washington Medicare Savings Program

Age 65+ or disabled
General WA resident, Medicare Part A/B.
Income Limits (2025) ~$2,510/month (QMB), ~$3,380/month (SLMB), ~$3,598/month (QI)—individual.
Asset Limits $9,430 (individual), $14,130 (couple).
WA

Includes Extra Help for Part D; no waitlist.

Benefits
Covers Part B premiums ($174.70/month) Deductibles ($240/year) Copays (~20%)

VA Aid and Attendance (A&A) and Housebound Benefits

Washington VA Aid and Attendance/Housebound

Age 65+ or disabled veteran/spouse
General WA resident, wartime service, ADL help (A&A) or homebound.
Income Limits (2025) Net income < ~$1,984/month (veteran with dependent, A&A); pension offsets income.
Asset Limits ~$155,356 net worth
WA

High veteran use; supports rural/urban needs.

Benefits
Cash (~$1,433-$2,642/month veteran, ~$951-$1,318 spouse) for care costs

Senior Citizens Property Tax Exemption

Washington Senior Property Tax Exemption

Age 61+ or disabled retiree
General WA resident, homeowner, income-based.
Income Limits (2025) ~$45,000-$70,000/year varies by county, e.g., King: $70,000
Asset Limits Not assessed; home value cap varies ~$250,000-$400,000
WA

Saves ~$500-$1,500/year; offered statewide.

Benefits
Tax exemption (~$500-$1,500/year depending on county)

Senior Farmers’ Market Nutrition Program (SFMNP)

Washington SFMNP

Age 60+
General WA resident, low-income.
Income Limits (2025) ~$2,322/month 185% FPL
Asset Limits Not assessed.
WA

Vouchers (~$80/season); serves ~20,000 via AAAs.

Benefits
Vouchers (~$80/season) for produce at farmers’ markets

Frequently Asked Questions about Kline Galland Home

What neighborhood is Kline Galland Home in?

Kline Galland Home is in the Seward Park neighborhood.

Is Kline Galland Home in a walkable area?

Kline Galland Home has a walk score of 44. Somewhat walkable. A few nearby services may be reachable on foot, but most trips require transportation.

What is the occupancy rate at Kline Galland Home?

Kline Galland Home's occupancy is 93.5%.

Are there photos of Kline Galland Home?

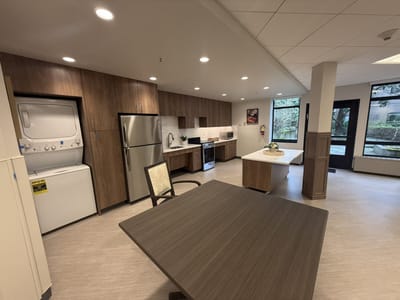
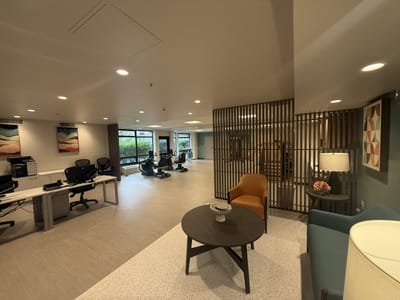
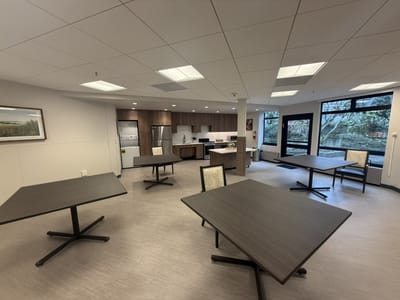
Yes — there are 18 photos of Kline Galland Home in the photo gallery on this page.

What is the address of Kline Galland Home?

Kline Galland Home is located at 7500 Seward Park Ave S, Seattle, WA 98118.

What is the phone number of Kline Galland Home?

(206) 725-8800 will put you in contact with the team at Kline Galland Home.

Is Kline Galland Home Medicare or Medicaid certified?

Yes — Kline Galland Home is a CMS-certified provider of Medicare and Medicaid.

Guides for Better Senior Living

Care Cost Calculator: See Prices in Your Area

Nursing Home Data Explorer

Don’t Wait Too Long: 7 Red Flag Signs Your Parent Needs Assisted Living Now

The True Cost of Assisted Living in 2025 – And How Families Are Paying For It

Understanding Senior Living Costs: Pricing Models, Discounts & Financial Assistance