Explore Open Rooms

1 Contact details
2 What type of senior care service are you looking for?
3 What budget do you have in mind for senior care?
4 How soon do you need to find care?
5 Additional details

Thank you for your interest!

Our team will be in touch shortly to help with next steps.

Overview of Leeway

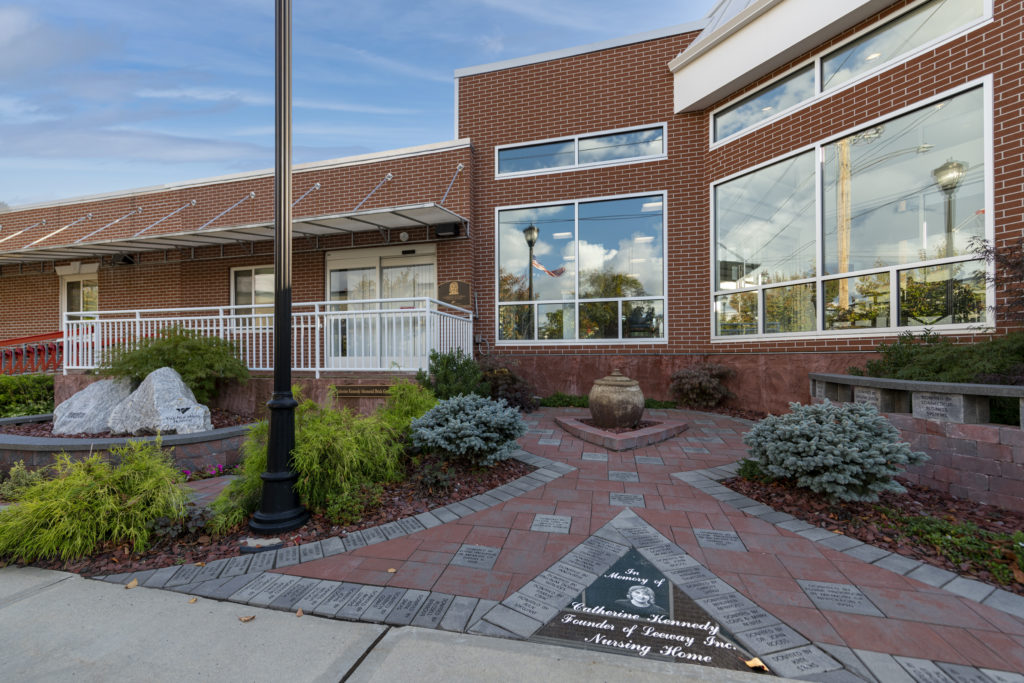
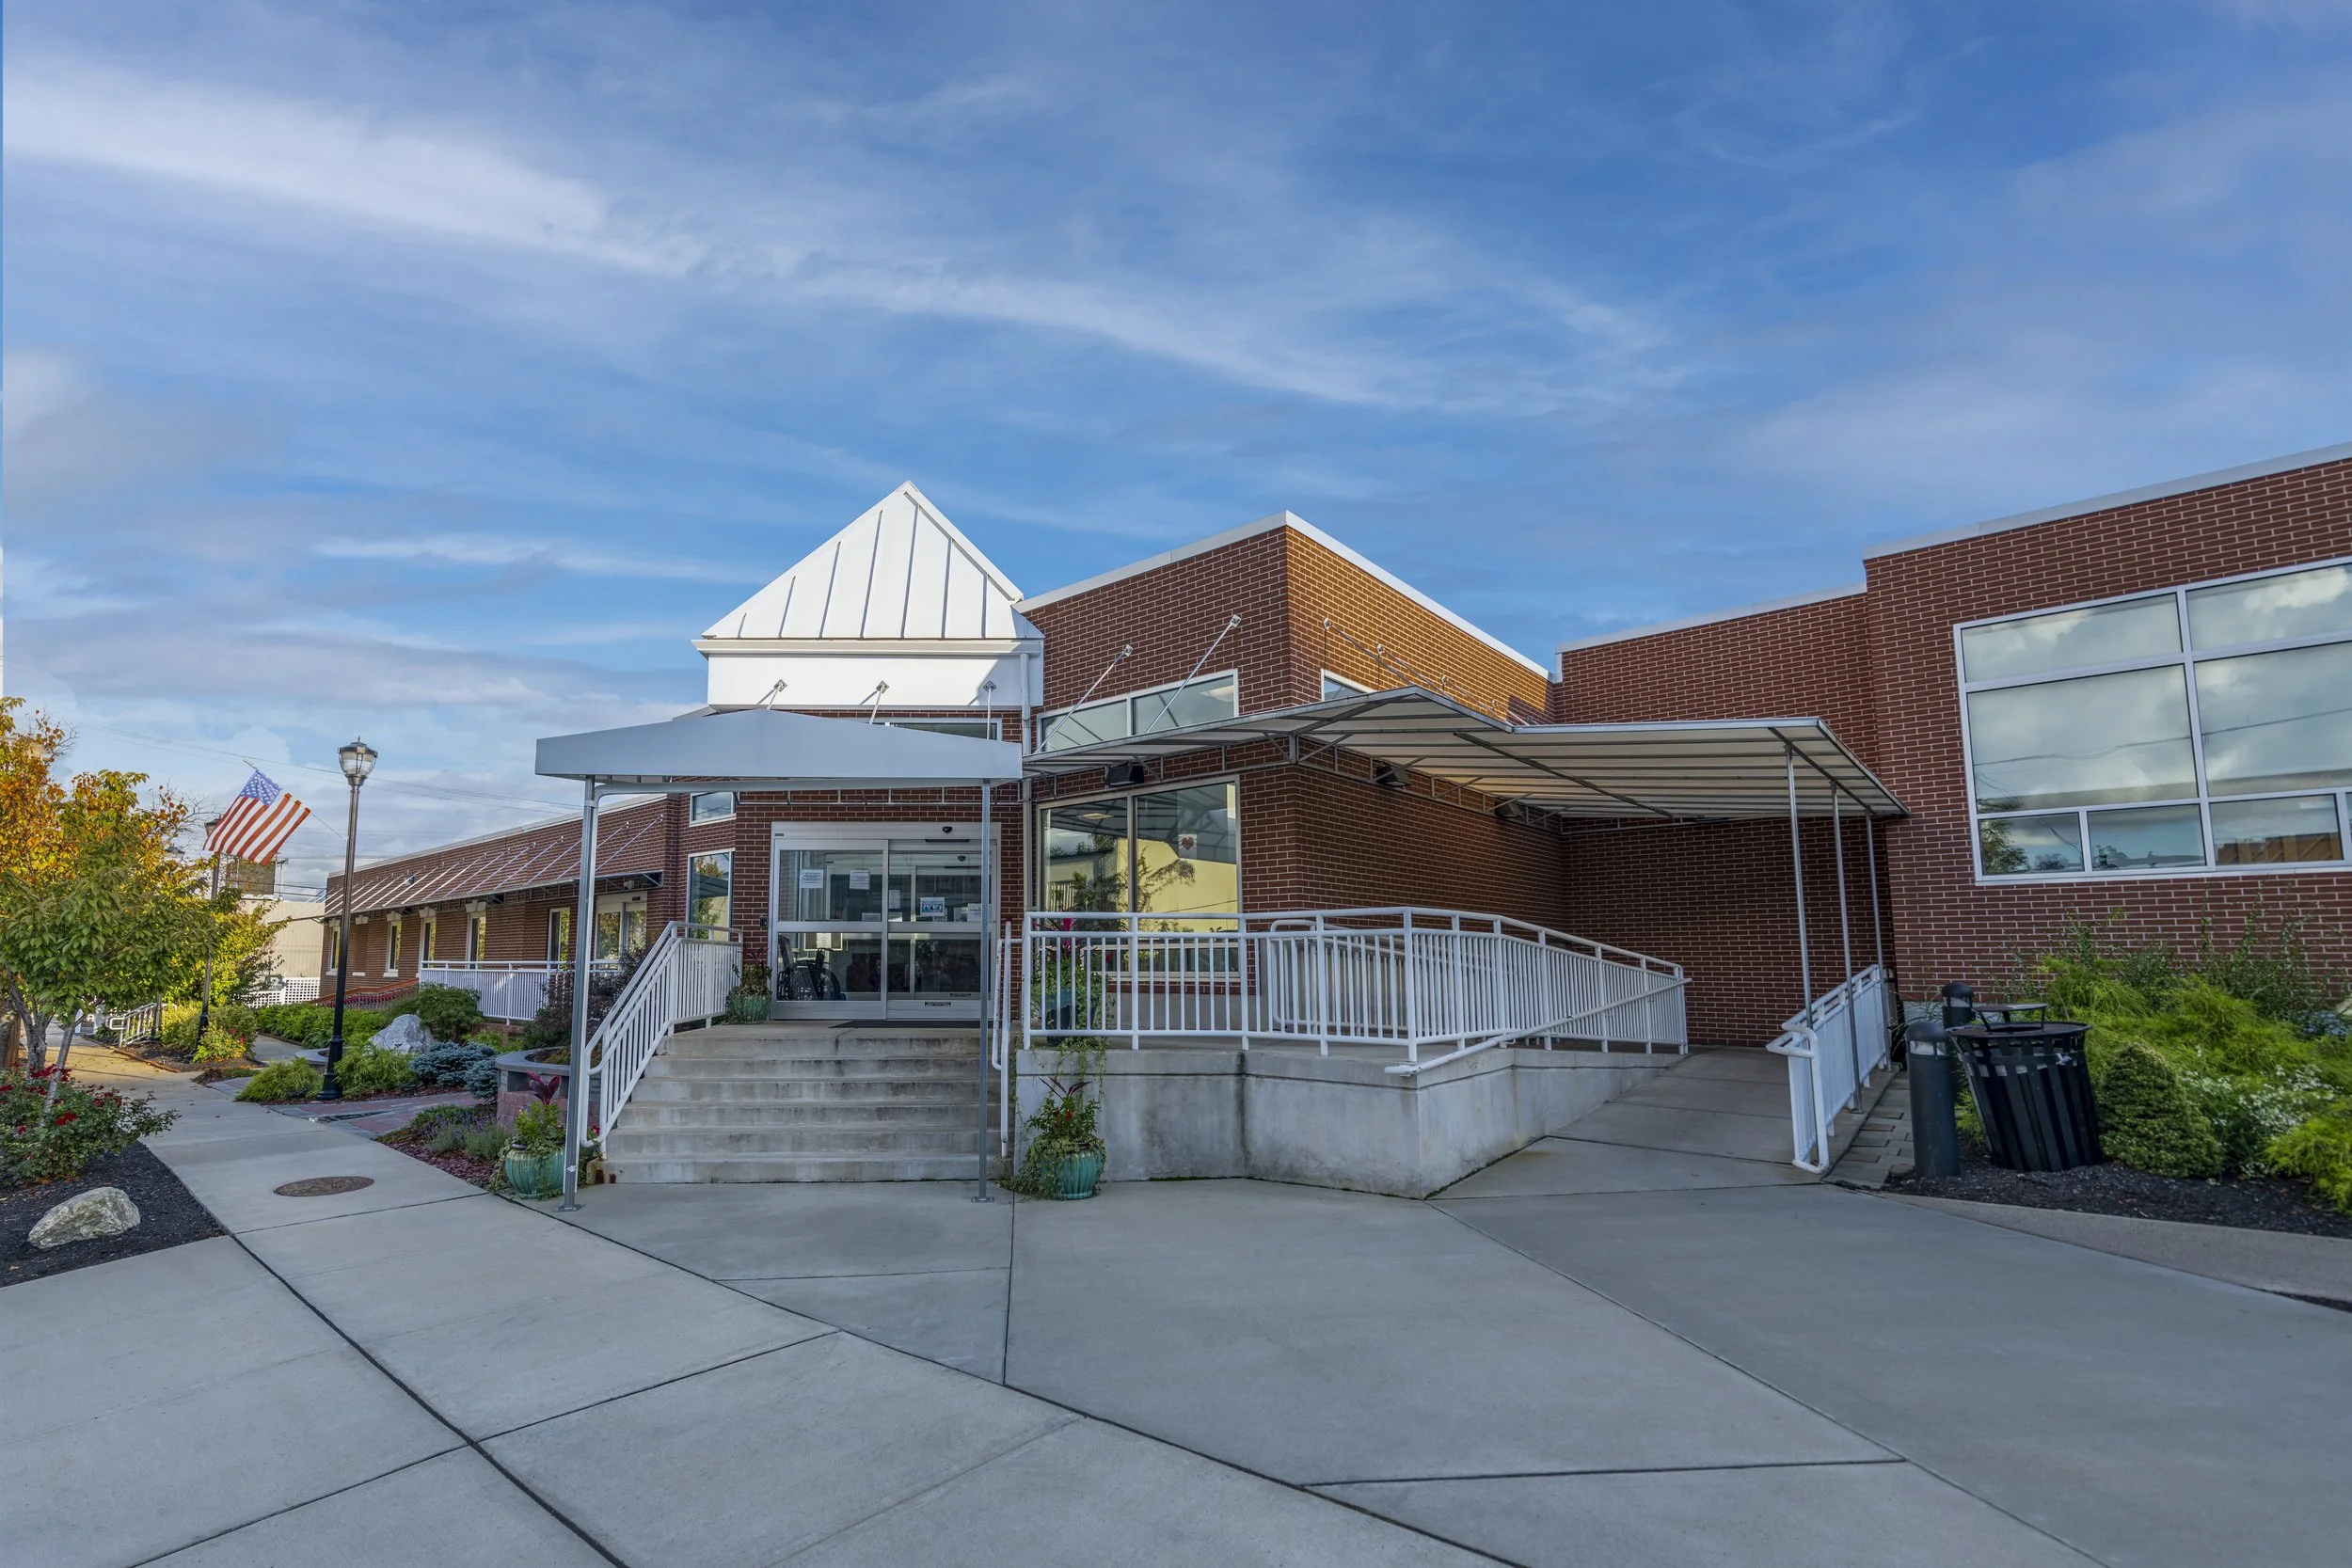
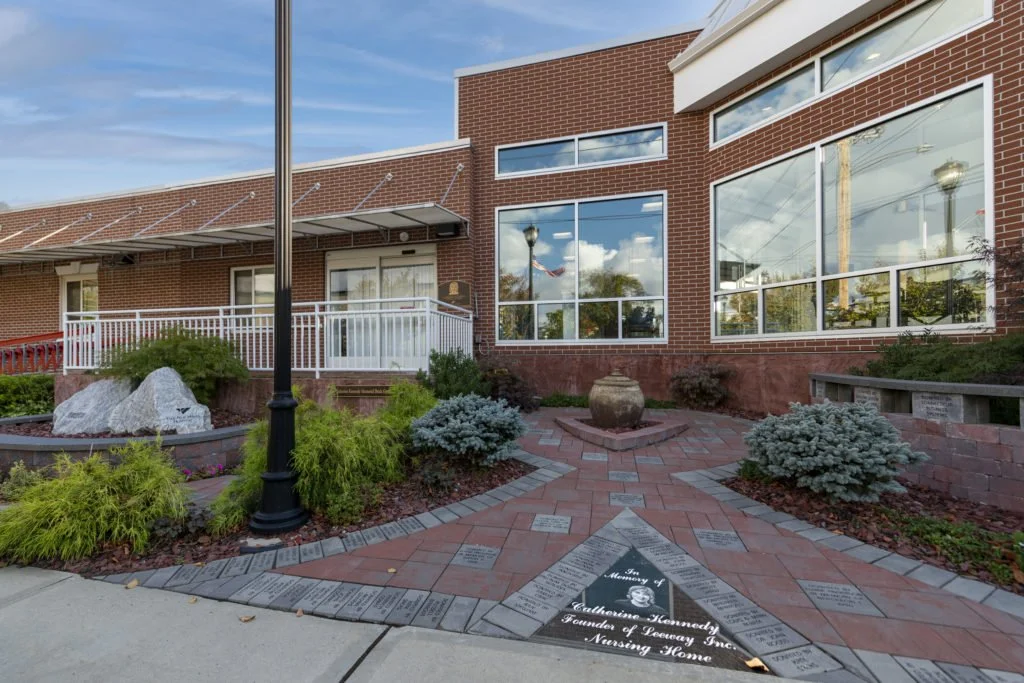
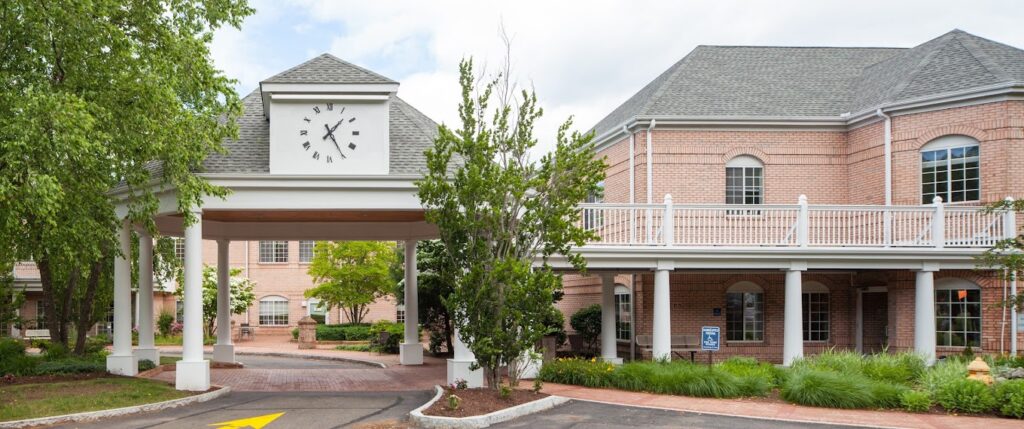
Leeway, renowned nationwide as a trailblazer in AIDS care, goes above and beyond to provide comprehensive services that encompass inpatient rehabilitation and palliative care. Through their housing and support services, Leeway extends a helping hand to those with AIDS, offering a pathway to a more enriched and satisfying existence. In the heart of New Haven, Connecticut, Leeway houses 41 units designed to provide a nurturing and supportive environment for its residents. Their 24-hour med-certified staff embodies a deep commitment to providing exceptional senior care, ensuring the comfort and well-being of every individual under their care.
Within the walls of Leeway, residents find not only a safe and secure haven but also a community that embraces their unique needs and aspirations. Through personalized care and innovative programs, Leeway fosters an environment where individuals with AIDS can thrive and build meaningful connections with others. As a compassionate leader in the field, Leeway continues to pave the way for excellence in AIDS care, offering a place of understanding, dignity, and genuine support for those seeking a better quality of life. 

Quality ratings

Measured by Centers for Medicare & Medicaid Services (CMS)

Overall rating Info The Overall CMS Rating combines results from health inspections, staffing levels and quality measures. Health inspections carry the most weight. Staffing and quality scores can increase or decrease the final rating based on performance compared to state and national standards.
5/5
Connecticut average: 3.4/5
Health Inspection Info Based on the results of the facility's three most recent standard inspections and any complaint investigations. CMS reviews the number, scope, and severity of deficiencies, with more recent findings weighted more heavily.
4/5
Connecticut average: 3.1/5
Staffing Info Measures average nursing staff hours per resident per day, including Registered Nurses (RNs) and total nursing staff. Ratings are adjusted based on the level of care residents require and are compared to state and national benchmarks.
5/5
Connecticut average: 3.4/5
Quality Measures Info Based on clinical and physical health indicators reported to CMS, such as hospital readmissions, falls, pressure ulcers, and improvements in mobility. These measures reflect how well residents' health needs are being managed.
3/5
Connecticut average: 3.6/5

Nursing care per resident

Info This shows how many total hours of nursing staff time are available per resident each day. Higher numbers usually mean more staff support.
5h 39m per day

This home provides 39% more nursing time per resident than the Connecticut average.

Connecticut average: 4h 4m per day

Staffing hours breakdown

Info Hours of care per resident per day, broken down by staff type. Data from CMS Medicare.
Staff type Facility State avg National avg
Registered Nurse (RN) Info Registered nurse hours per resident per day. 1h 26m per day 42m per day 41m per day
Nurse Aide Info Nurse aide hours per resident per day. 2h 16m per day 2h 17m per day 2h 21m per day
Total Nursing (Weekend) Info Total number of nurse staff hours per resident per day on weekends. 3h 26m per day 3h 25m per day 3h 26m per day
Physical Therapist Info Physical therapist staff hours per resident per day. 2m per day 5m per day 4m per day
RN (Weekend) Info Registered nurse hours per resident per day on weekends. 51m per day 28m per day 29m per day

Capacity and availability

Smaller home

May offer a more intimate, personalized care environment.

Total beds 60

This home usually has availability

Lower occupancy suggests more openings may be available.

Lower demand than the Connecticut average
Occupancy rate 46.7%
Residents per day (avg) 29
Occupancy rate
46.7%
Residents per day (avg)
29

Who this home usually serves

TYPE OF STAY

Mostly long-term care residents

Most residents stay for extended periods and receive ongoing daily care.

Might be optimal for
Long-term daily care Ongoing support needs

Breakdown by payment type

Medicare

29% of new residents, usually for short-term rehab.

Typical stay 1 - 2 months

Private pay

19% of new residents, often for short stays.

Typical stay 2 years

Medicaid

53% of new residents, often for long-term daily care.

Typical stay 8 - 9 months

Finances and operations

Voluntary non-profit community
Home revenue
$9.0M
Surplus of revenue
$91.9K
Voluntary non-profit community
Home revenue
$8,964,197.00
Surplus of revenue
$91,852.00
Payroll costs Info The portion of the home's budget spent on staff, including nurses, caregivers, and other employees who support care and operations.
$3.6M
39.9% of revenue
Other operating costs Info All remaining costs needed to run the home, such as food, utilities, building maintenance, supplies and administrative expenses.
$5.3M
Total costs $8.9M
Years in operation
17 years in operation
A community with a solid operating history and experience delivering ongoing care.
Walk Score
Walk Score: 23 / 100
Car-dependent. Most errands require a car, with limited nearby walkable options.

Services

Hiv/aids
Hospice
Iv Therapy
Recreation
Respite Care
Short-term Rehabilitation
Wound Management

About this community

Occupancy

Occupancy rate
93%
In line with Connecticut average
Occupied beds
28 / 30
Average residents 102 per day

License details

Facility type
Chronic & Convalescent Nursing Home
Status Active
Issuance January 10, 2009
Expiration September 30, 2027

Additional licensing details

License number: 2167C

Room costs

Private Room $500 per day

Staffing

Key information about the people who lead and staff this community.

Languages Spoken

Sign Language Spanish

Staff Composition (State Data)

Admin
3 FTE
Registered Nurse
2 FTE
Licensed Practical Nurse
3 FTE
Nursing Assistant
11 FTE
Recreation
1 FTE
Social Services
1 FTE
Food Service Supervisor
8 FTE
Dietary
1 FTE
Other Staff
11 FTE

Care Services

Nursing Services
Rehabilitation Services
Independent Living
Skilled Nursing
Licensed Nurses/CNAs
Short-Term Rehab

Additional Policies & Features

Religious Services: All Denominations

Programs & Activities

Specific Programs
Clinical Departments, Case Management, Long Term Care, Residential Care Home, Supportive Housing
Contact Leeway

Inspection History

In Connecticut, the Department of Public Health, Facility Licensing and Investigations Section conducts mandatory inspections and unannounced surveys to monitor the quality of care in long-term facilities.

7 visits/inspections

3 routine inspections

Breakdown by inspection type
  • 1 renewal/recertification inspection
  • 3 licensing inspections
  • 4 plans of correction

Results

4 with issues

0 without issues

Connecticut average: 13 visits/inspections

Latest inspection

Date:December 31, 2025

Inspection history

01-13-2022 Inspection Report
01-22-2024 Inspection Report
03-17-2022 Plan of Correction
03-20-2020 Plan of Correction
03-30-2022 Inspection Report
05-04-2023 Plan of Correction
06-07-2023 Inspection Report
06-07-2024 Inspection Report
12-31-2025 Inspection Report

39 deficiencies

Deficiencies indicate regulatory issues. A higher number implies the facility had several areas requiring improvement.

Inspection Report Summary for Leeway

The most recent inspection on December 31, 2025, found no deficiencies. Earlier inspections showed a mixed record with several citations related mainly to documentation issues such as advanced directives, care planning, and timely communication with pharmacy and hospital recommendations. Complaint investigations included a substantiated case in early 2022 involving follow-up on hospital discharge instructions and medication administration, while other complaints were unsubstantiated or lacked detailed findings. Enforcement actions such as fines or license suspensions were not listed in the available reports. The trend suggests improvement over time, with the most recent inspection showing compliance after prior issues were addressed.

Health Inspection History

Inspections
Total health inspections 4

Connecticut average 5.7


Last Health inspection on Sep 2024

Total health citations 21

Connecticut average 32

Citations per inspection
5.25

Connecticut average 5.82


Health citations are formal notices following inspections when they fail to comply with safety and care standards.

20 of 21 citations resulted from standard inspections; and 1 of 21 resulted from complaint investigations.

Breakdown of citation severity (last 3 years)
Critical Health citations More info 0
100% better than Connecticut average

Connecticut average: 0.3


Serious Health citations More info 0
100% better than Connecticut average

Connecticut average: 0.7

0 critical citations More info Connecticut average: 0.3

0 serious citations More info Connecticut average: 0.7

17 moderate citations More info Connecticut average: 28.8

4 minor citations More info Connecticut average: 2.3
Citations history (last 3 years)
Quality of Care moderate citation Info Issues related to how well residents receive appropriate treatment and support for their medical and daily care needs. Sep 12, 2024
Corrected

Infection Control moderate citation Info Issues related to preventing and controlling infections, including hygiene practices and safety protocols. Jun 06, 2024
Corrected

Infection Control moderate citation Info Issues related to preventing and controlling infections, including hygiene practices and safety protocols. Jun 06, 2024
Corrected

Nursing Services moderate citation Info Issues related to the availability and quality of nursing staff and the care they provide. Jun 06, 2024
Corrected

Compare Nursing Homes around New Haven The information below is reported by the Connecticut Department of Public Health, Facility Licensing and Investigations Section.

5 facilities compared · CMS & CT Dept. of Health data · Updated Mar 2026

Leeway
NH

Nursing Home Licensed facility providing 24/7 skilled nursing care for residents with complex, ongoing medical needs. Staffed by RNs, LPNs, and CNAs. Inspected and star-rated annually by CMS. Accepts Medicare (short-term rehab) and Medicaid (long-term care).

AL

Assisted Living A licensed, long-term care setting for seniors or individuals with disabilities who need help with daily activities — like bathing, dressing, and medication management — but not 24-hour skilled nursing. Offers housing, meals, and around-the-clock support while aiming to maximize resident independence.

New Haven (East Rock)
60
96.2%
+15%
5.65
+84%
+42%
0
21
0
29
-
23
Katz, Jay
$7,6M
$3,6M
46.8%
75408
The Willows
NH

Nursing Home Licensed facility providing 24/7 skilled nursing care for residents with complex, ongoing medical needs. Staffed by RNs, LPNs, and CNAs. Inspected and star-rated annually by CMS. Accepts Medicare (short-term rehab) and Medicaid (long-term care).

AL

Assisted Living A licensed, long-term care setting for seniors or individuals with disabilities who need help with daily activities — like bathing, dressing, and medication management — but not 24-hour skilled nursing. Offers housing, meals, and around-the-clock support while aiming to maximize resident independence.

Woodbridge
90
95.5%
+14%
3.20
-69%
-20%
0
25
0
85
-
48
Kc Derby Ct Al Opco Jv Llc
$19,3M
$5,3M
27.2%
75331
Whispering Pines Rehabilitation and Nursing Center
NH

Nursing Home Licensed facility providing 24/7 skilled nursing care for residents with complex, ongoing medical needs. Staffed by RNs, LPNs, and CNAs. Inspected and star-rated annually by CMS. Accepts Medicare (short-term rehab) and Medicaid (long-term care).

AL

Assisted Living A licensed, long-term care setting for seniors or individuals with disabilities who need help with daily activities — like bathing, dressing, and medication management — but not 24-hour skilled nursing. Offers housing, meals, and around-the-clock support while aiming to maximize resident independence.

East Haven
90
87.8%
+5%
3.89
-21%
-2%
0
28
0
78
-
21
Bartolotta, Michael
$14,6M
$5,5M
37.6%
75294
Mary Wade Home
NH

Nursing Home Licensed facility providing 24/7 skilled nursing care for residents with complex, ongoing medical needs. Staffed by RNs, LPNs, and CNAs. Inspected and star-rated annually by CMS. Accepts Medicare (short-term rehab) and Medicaid (long-term care).

AL

Assisted Living A licensed, long-term care setting for seniors or individuals with disabilities who need help with daily activities — like bathing, dressing, and medication management — but not 24-hour skilled nursing. Offers housing, meals, and around-the-clock support while aiming to maximize resident independence.

New Haven (Fair Haven)
139
88.8%
+6%
4.64
-26%
+17%
2
40
0
90
A+
84
Adams, Barbara
$20,7M
$9,4M
45.5%
75325
New Haven Center for Nursing & Rehabilitation
NH

Nursing Home Licensed facility providing 24/7 skilled nursing care for residents with complex, ongoing medical needs. Staffed by RNs, LPNs, and CNAs. Inspected and star-rated annually by CMS. Accepts Medicare (short-term rehab) and Medicaid (long-term care).

AL

Assisted Living A licensed, long-term care setting for seniors or individuals with disabilities who need help with daily activities — like bathing, dressing, and medication management — but not 24-hour skilled nursing. Offers housing, meals, and around-the-clock support while aiming to maximize resident independence.

New Haven (Fair Haven Heights)
150
76.2%
-9%
3.80
+60%
-4%
1
77
2
125
A+
45
-
$14,5M
$9,5M
65.4%
75397

Places of interest near Leeway

Address 2.1 miles from city center — 2.28 miles to nearest hospital (Yale Medicine Digestive Diseases)

Address 40 Albert St, New Haven, CT 06511

Calculate Travel Distance to Leeway

Add your location

Address

Staffing Data (Q2 2025)

This data corresponds to Q2 2025 and is based on CMS Payroll-Based Journal.

Total staff 109
Employees 47
Contractors 62
Staff to resident ratio 3.63:1
93% better than Connecticut average

Connecticut average ratio: 1.88:1

Avg staff/day 22
Average shift 6.8 hours
9% worse than Connecticut average

Connecticut average: 7.5 hours

Total staff hours (quarter) 13,648
Nursing staff breakdown
Registered Nurse

Manages medical care and health needs.

Total count 22
Average shift length Info Average shift length. Calculated as total hours divided by days worked and average staff per day. 7.3 hours

This role is partially covered by contractors.

Licensed Practical Nurse

Assists with medical care and medications.

Total count 8
Average shift length Info Average shift length. Calculated as total hours divided by days worked and average staff per day. 7.7 hours

This role is partially covered by contractors.

Certified Nursing Assistant

Helps with daily care and mobility.

Total count 61
Average shift length Info Average shift length. Calculated as total hours divided by days worked and average staff per day. 6.9 hours

This role is partially covered by contractors.

Contractor staffing

Total hours from contractors

10.8%

1,477 contractor hours this quarter

Certified Nursing Assistant: 40 Registered Nurse: 14 Licensed Practical Nurse: 3 Speech Language Pathologist: 1 Other Physician: 1 Respiratory Therapy Technician: 1 Medical Director: 1 Feeding Assistant: 1
Staff by category
Certified Nursing Assistant2140615,71091100%6.9
Registered Nurse814222,53991100%7.3
Licensed Practical Nurse5381,55691100%7.7
Clinical Nurse Specialist2027516571%7.3
Nurse Practitioner1015286673%8
Administrator1015206571%8
Speech Language Pathologist0115046369%8
Other Social Services Staff1014886167%8
Mental Health Service Worker1014725965%8
Physical Therapy Assistant3031796673%2.5
Dental Services Staff2021343640%3.4
Qualified Social Worker1011314246%3.1
Respiratory Therapy Technician112722123%3.4
Medical Director011452426%1.9
Other Physician011111112%1
Feeding Assistant011878%1.1
61 Certified Nursing Assistant
% of Days 100%
22 Registered Nurse
% of Days 100%
8 Licensed Practical Nurse
% of Days 100%
2 Clinical Nurse Specialist
% of Days 71%
1 Nurse Practitioner
% of Days 73%
1 Administrator
% of Days 71%
1 Speech Language Pathologist
% of Days 69%
1 Other Social Services Staff
% of Days 67%
1 Mental Health Service Worker
% of Days 65%
3 Physical Therapy Assistant
% of Days 73%
2 Dental Services Staff
% of Days 40%
1 Qualified Social Worker
% of Days 46%
2 Respiratory Therapy Technician
% of Days 23%
1 Medical Director
% of Days 26%
1 Other Physician
% of Days 12%
1 Feeding Assistant
% of Days 8%

Facility Characteristics

Source: CMS Long-Term Care Facility Characteristics (Data as of Jan 2026)

Total census
30 residents
Residents by payment source
Medicare
30 residents (100%)
Programs & Services
Residents' Group

Residents meet regularly to discuss policies, care quality, and activities

Active Resident Council

Organized group of residents that meets regularly to discuss facility policies, quality of life, and activities.

Quality of care over time

These measures show how residents usually do over time at this home, based on health outcomes and preventive care.

High-risk clinical events score Info A composite score based on pressure ulcers, falls with injury, weight loss, walking ability decline, and activities of daily living decline. 7.5
27% better than Connecticut average

Connecticut average: 10.4

Functional decline score Info A composite score based on activities of daily living decline, walking ability decline, and incontinence. 12.0
43% better than Connecticut average

Connecticut average: 21.1

Long-stay resident measures
Above average Connecticut avg: 3.2 Info CMS star rating based on long-stay quality measure performance. 5 stars = significantly above average, 1 star = significantly below average.
Need for Help with Daily Activities Increased Info Percent of long-stay residents whose need for help with daily activities has increased 9.1%
52% better than Connecticut average

Connecticut average: 18.9%

Walking Ability Worsened Info Percent of long-stay residents whose ability to move independently worsened 17.4%
9% better than Connecticut average

Connecticut average: 19.2%

Low Risk Residents with Bowel/Bladder Incontinence Info Percent of low risk long-stay residents who lose control of their bowels or bladder 9.5%
62% better than Connecticut average

Connecticut average: 24.9%

Falls with Major Injury Info Percent of long-stay residents experiencing one or more falls with major injury 3.0%
13% better than Connecticut average

Connecticut average: 3.5%

High Risk Residents with Pressure Ulcers Info Percent of long-stay high risk residents with pressure ulcers 6.0%
32% worse than Connecticut average

Connecticut average: 4.6%

Urinary Tract Infection Info Percent of long-stay residents with a urinary tract infection 1.0%
39% better than Connecticut average

Connecticut average: 1.7%

Lost Too Much Weight Info Percent of long-stay residents who lose too much weight 2.1%
66% better than Connecticut average

Connecticut average: 6.3%

Depressive Symptoms Info Percent of long-stay residents who have depressive symptoms 2.4%
84% better than Connecticut average

Connecticut average: 15.2%

Antipsychotic Use Info Percent of long-stay residents who received an antipsychotic medication 23.5%
37% worse than Connecticut average

Connecticut average: 17.2%

Pneumococcal Vaccine Info Percent of long-stay residents assessed and appropriately given the pneumococcal vaccine 100.0%
14% better than Connecticut average

Connecticut average: 87.5%

Influenza Vaccine Info Percent of long-stay residents assessed and appropriately given the seasonal influenza vaccine 96.4%
In line with Connecticut average

Connecticut average: 93.5%

Short-stay resident measures
Pneumococcal Vaccine Info Percent of short-stay residents assessed and appropriately given the pneumococcal vaccine 100.0%
43% better than Connecticut average

Connecticut average: 70.1%

Antipsychotic medication increase Info Percent of short-stay residents who newly received an antipsychotic medication 0.0%
100% better than Connecticut average

Connecticut average: 1.5%

Influenza Vaccine Info Percent of short-stay residents assessed and appropriately given the seasonal influenza vaccine 87.5%
25% better than Connecticut average

Connecticut average: 69.8%

Guides for Better Senior Living

Care Cost Calculator: See Prices in Your Area

Nursing Home Data Explorer

Don’t Wait Too Long: 7 Red Flag Signs Your Parent Needs Assisted Living Now

The True Cost of Assisted Living in 2025 – And How Families Are Paying For It

Understanding Senior Living Costs: Pricing Models, Discounts & Financial Assistance

Financial Aid for Connecticut Seniors

Get financial aid guidance

Connecticut Home Care Program for Elders

CHCPE

Age 65+, Connecticut resident, at risk of nursing home placement.

State-funded: ~$1,600/month; Medicaid: ~$2,829/month (300% FBR).

$1,600 (state), $2,000 (Medicaid, individual).

Two tiers (state and Medicaid); waitlists possible.

Statewide Respite Care Program

CT Respite Care

Caregiver of senior with dementia, Connecticut resident.

~$2,500/month (individual, varies).

$40,000 (individual).

Limited to dementia caregivers; capped funding.

Congregate Housing Services Program (CHSP)

Connecticut Congregate Housing Services Program

Age 62+, Connecticut resident, frail but not needing 24/7 care, resides in CHSP-eligible housing.

~$41,000/year (individual, adjusted annually).

Not specified; focus is income-based.

Limited to 14 state-subsidized sites; participants pay 10% of service costs.

Medicare Savings Program (MSP)

Connecticut Medicare Savings Program

Age 65+ or disabled, Connecticut resident, enrolled in Medicare Part A/B.

~$2,510/month (individual, QMB); ~$3,380/month (SLMB); ~$3,598/month (ALMB)—adjusted annually.

None since 2023 policy change.

Three tiers (Qualified Medicare Beneficiary, Specified Low-Income, Additional Low-Income); no asset test.

Senior Community Service Employment Program (SCSEP)

Connecticut SCSEP (federally funded, state-administered)

Age 55+, unemployed, low-income, Connecticut resident.

~$1,983/month (125% FPL, individual).

Not specified; income-focused.

Priority for veterans, rural residents; limited slots (~500/year).

Tour Icon
Planning a tour? Check our touring checklist.
Chat Icon
Thinking of living here? We can help you speak to a current resident