Occupancy rate
54%

We arrange tours, appointments, and even moving support so you don’t have to
Thank you for your interest!
Our team will be in touch shortly to help with next steps.

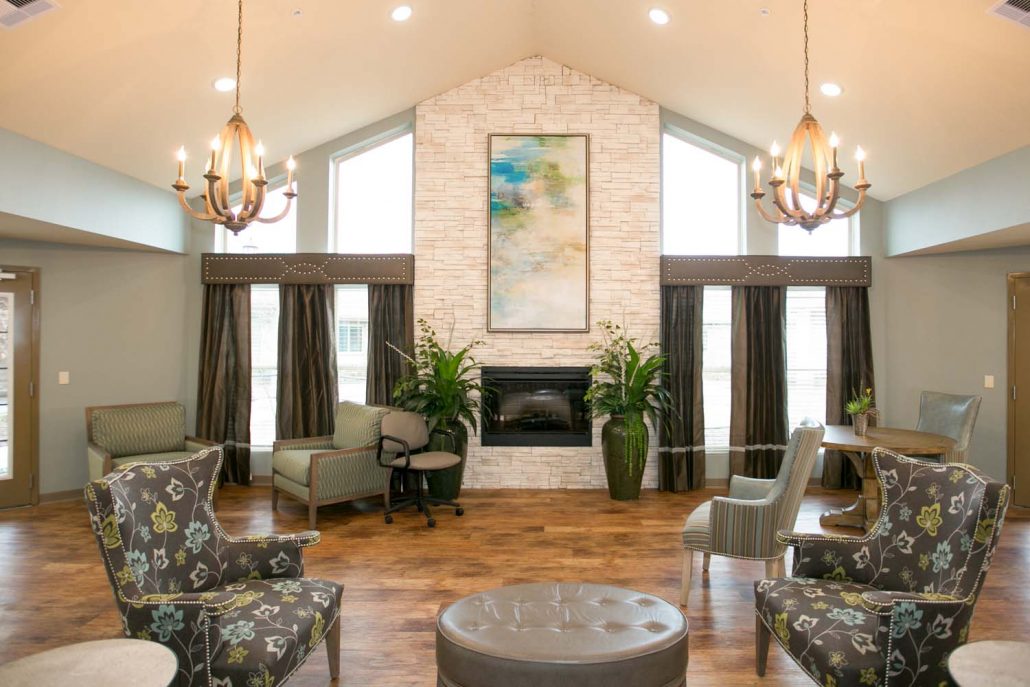
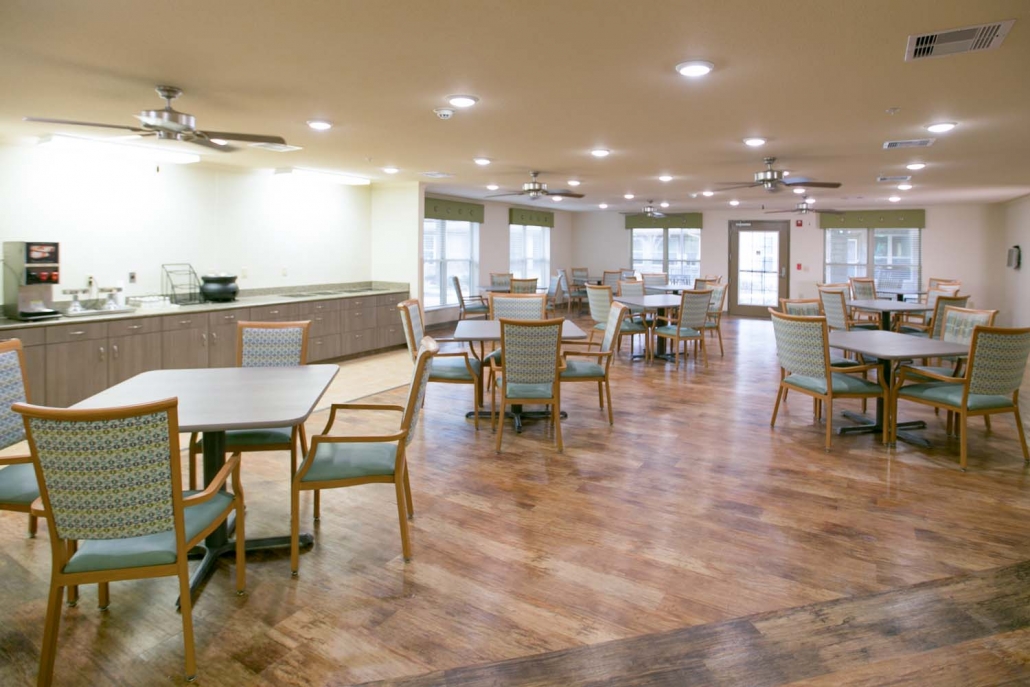
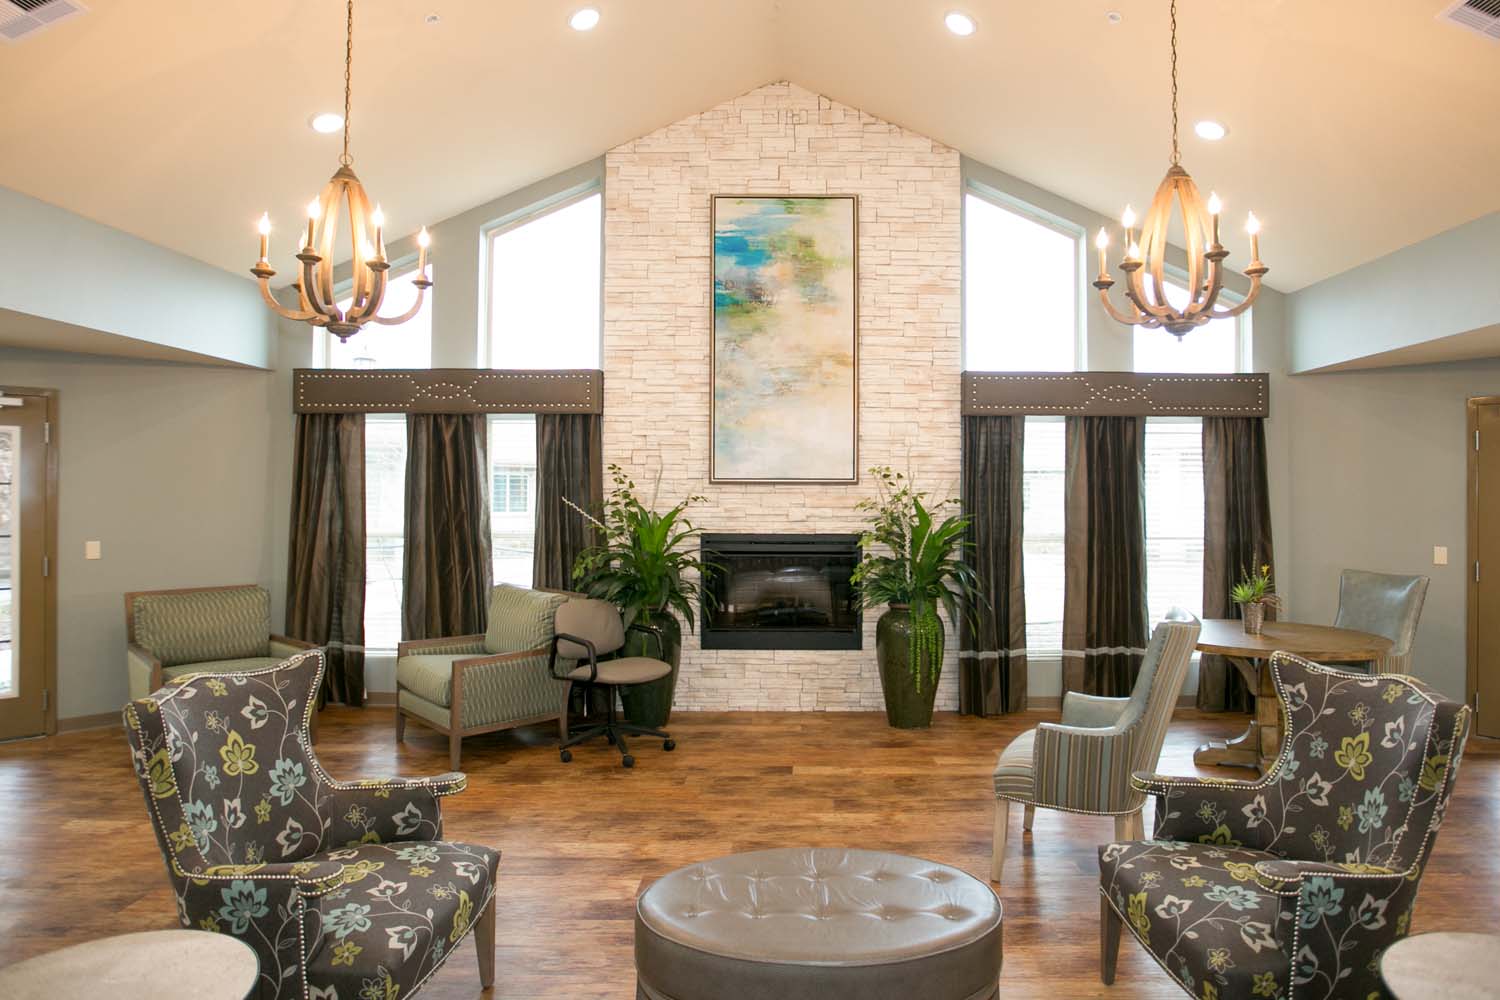
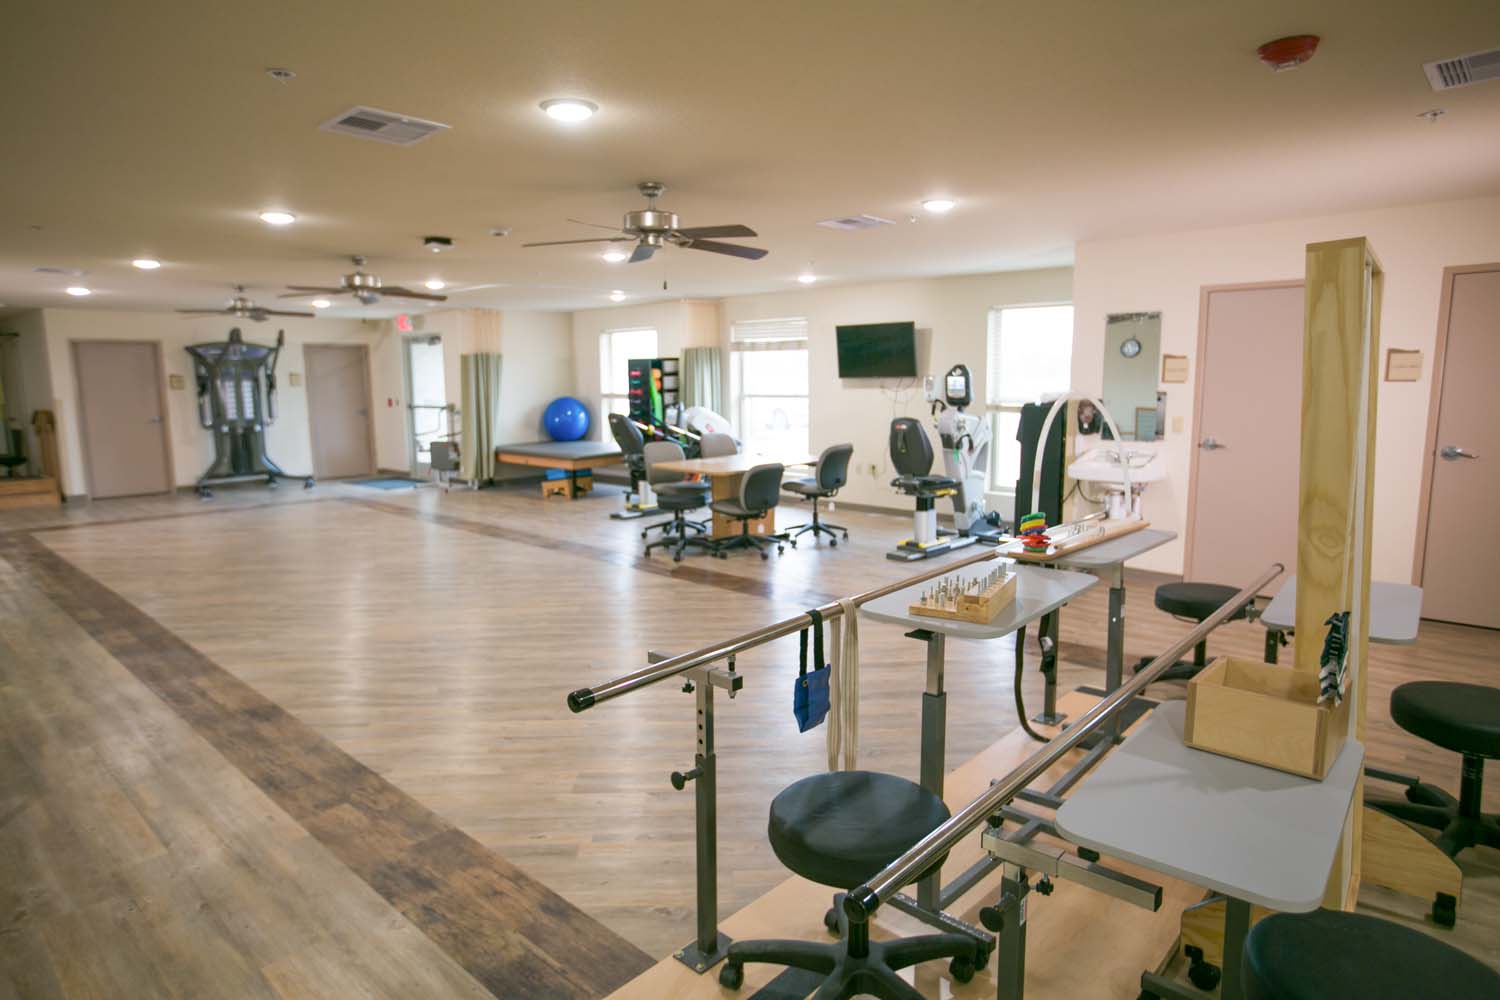
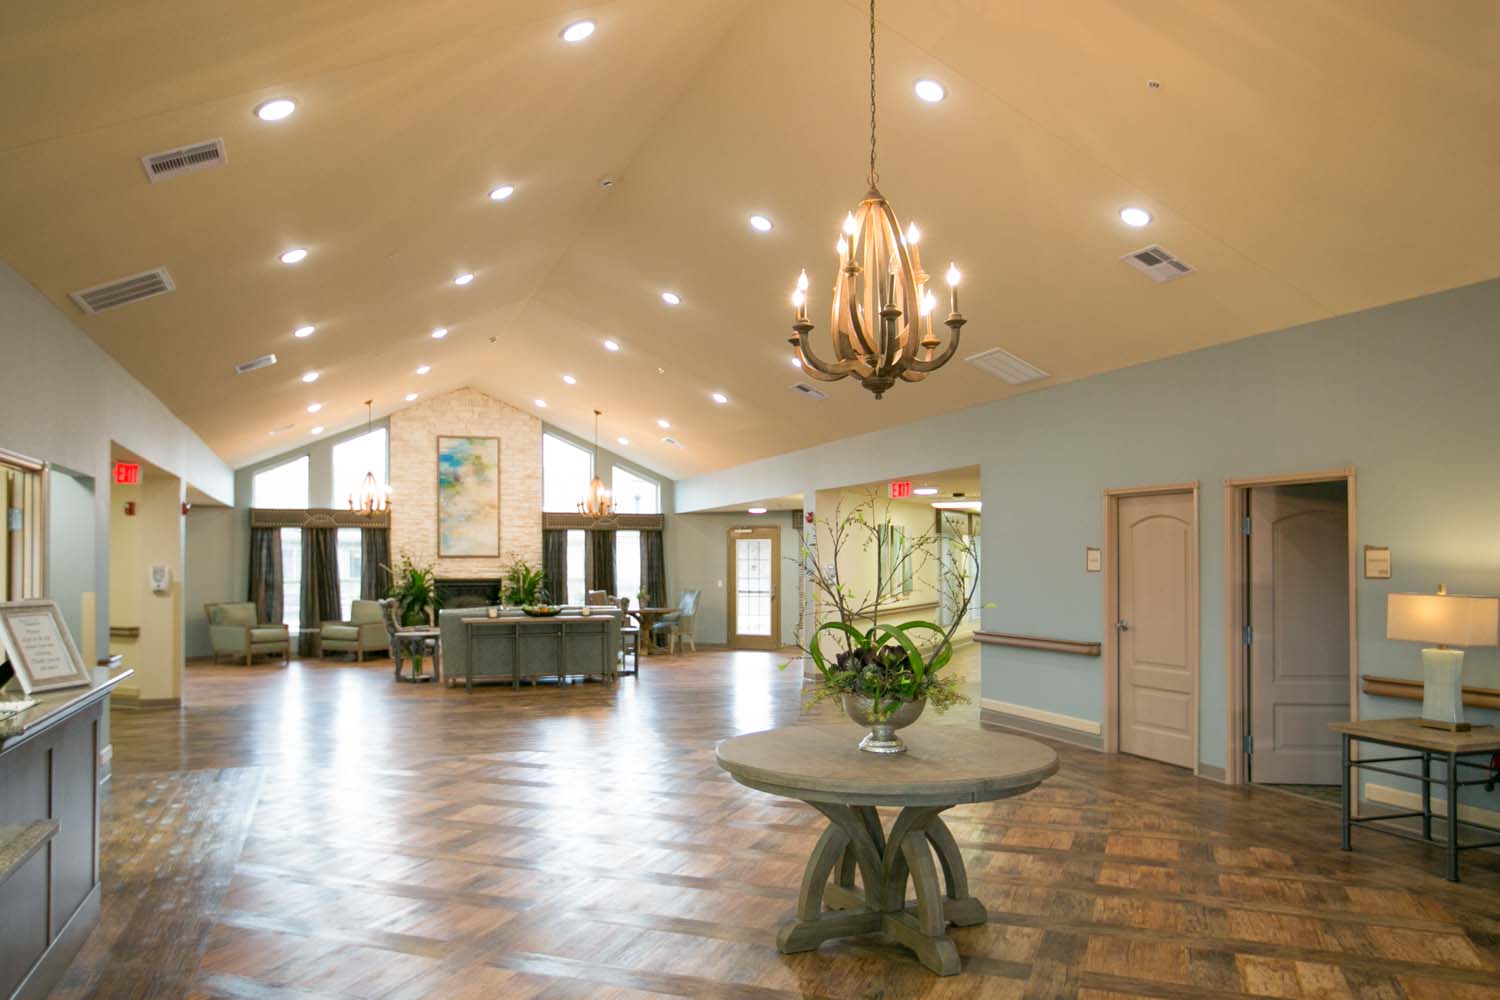
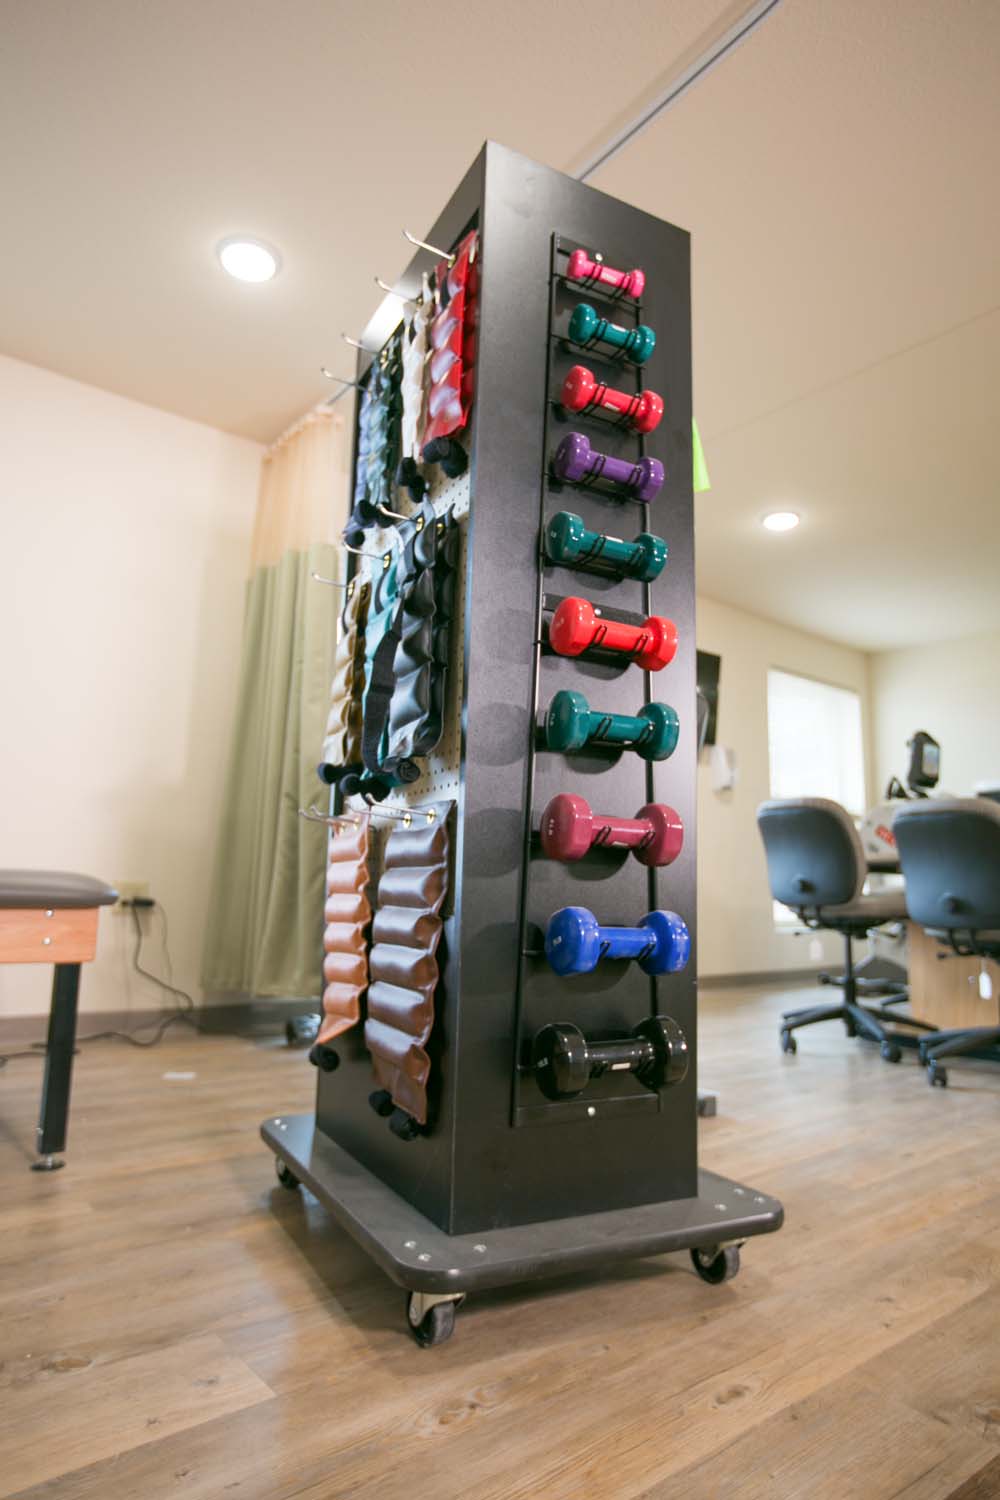
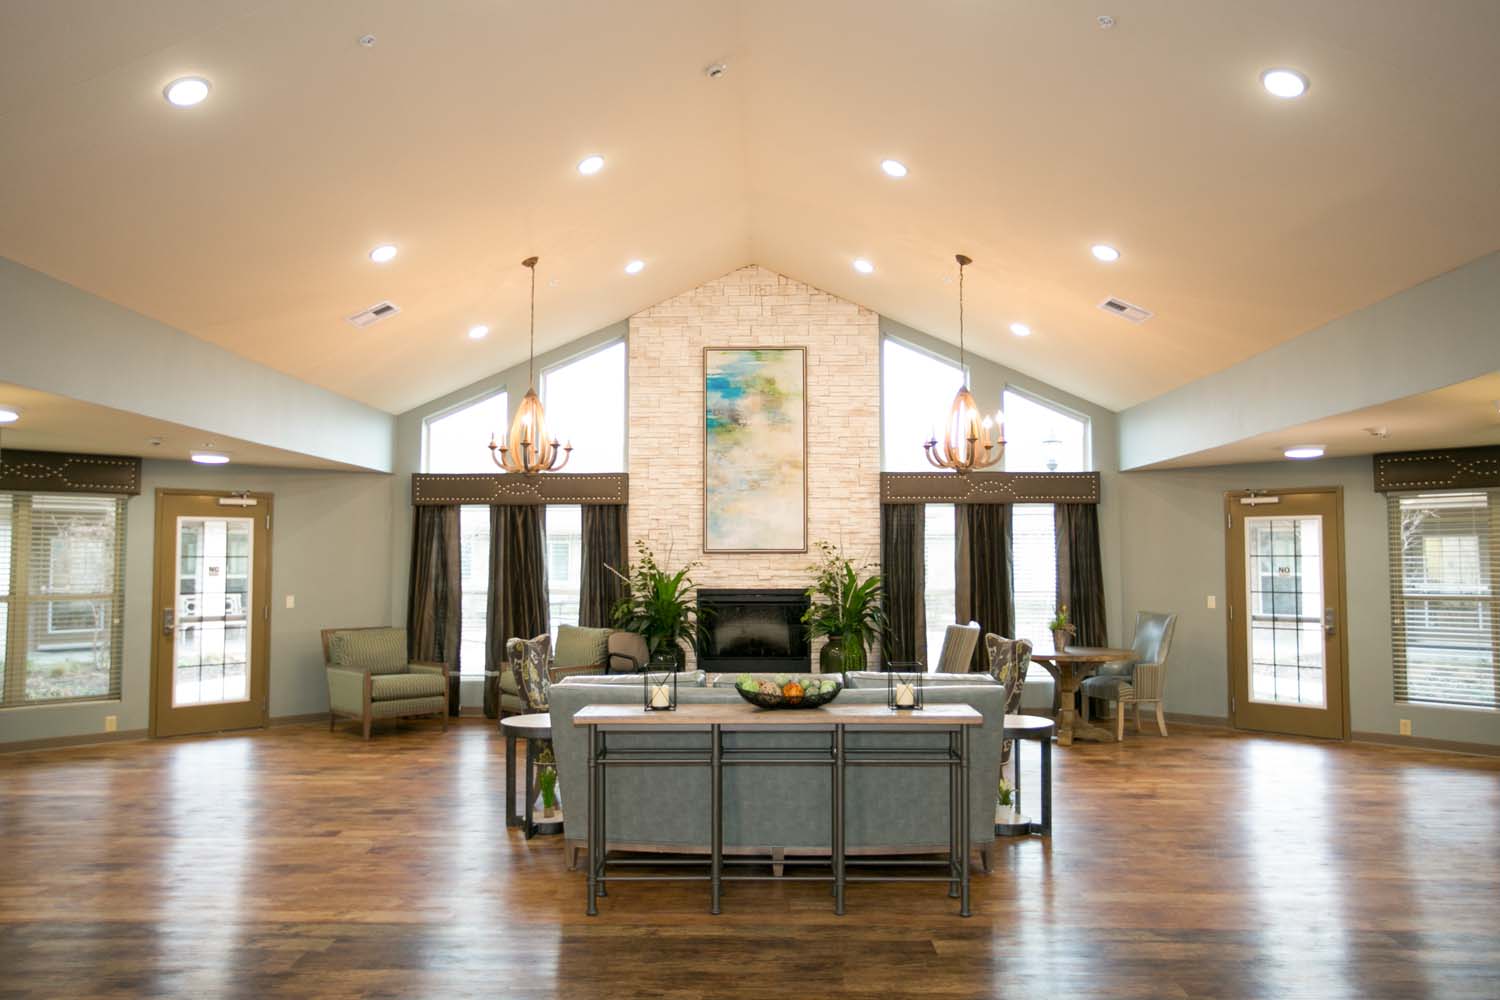
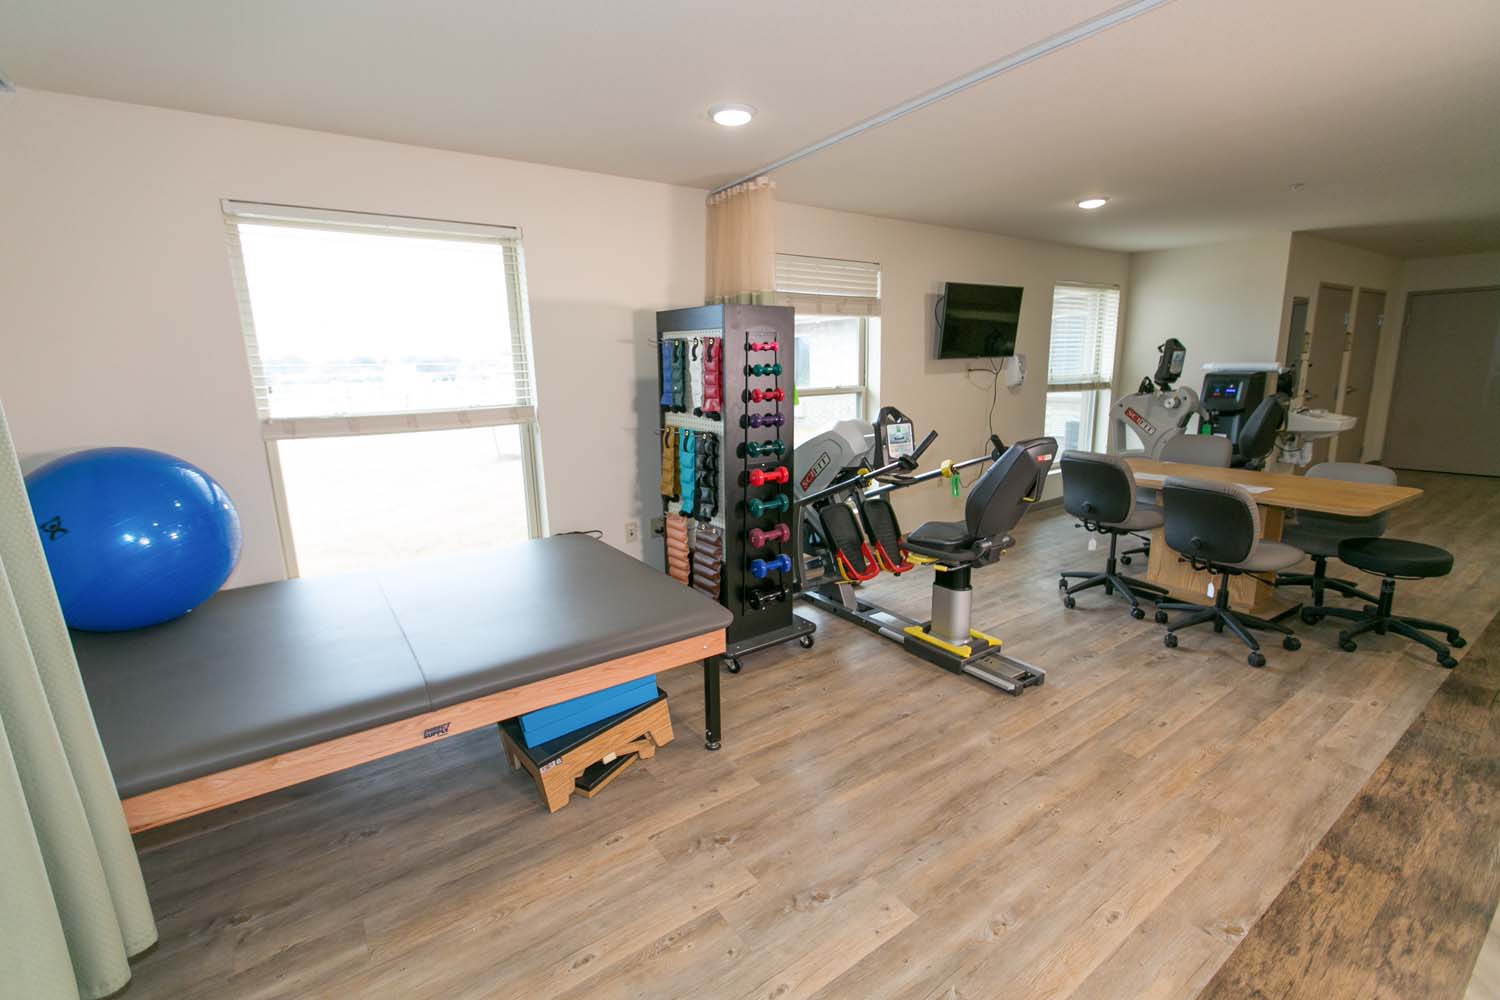
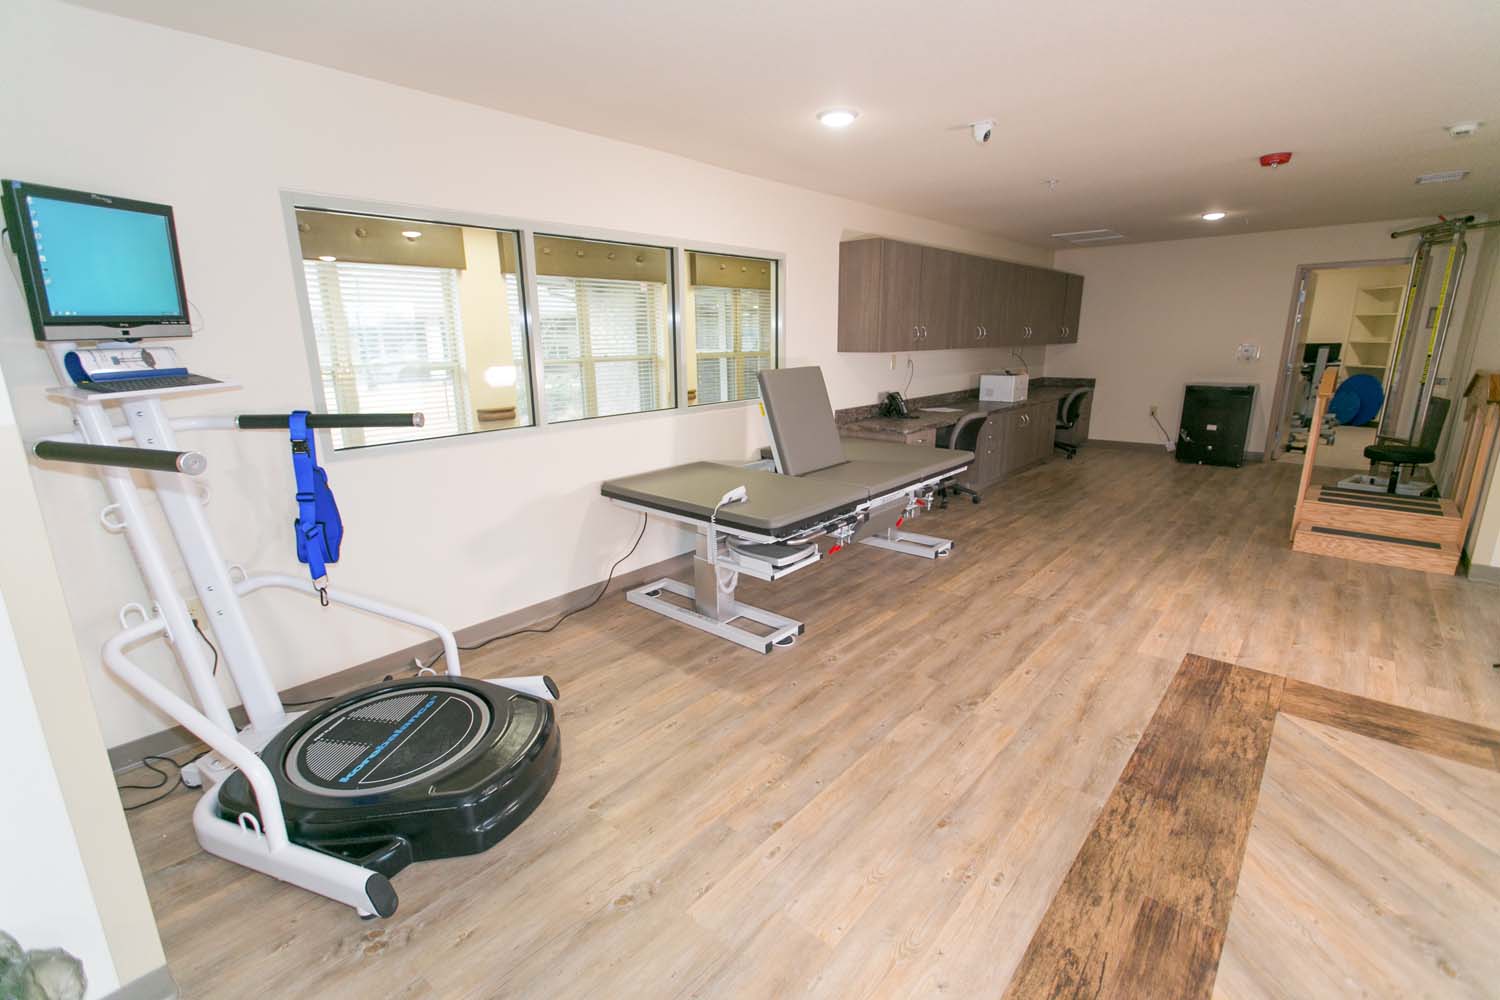
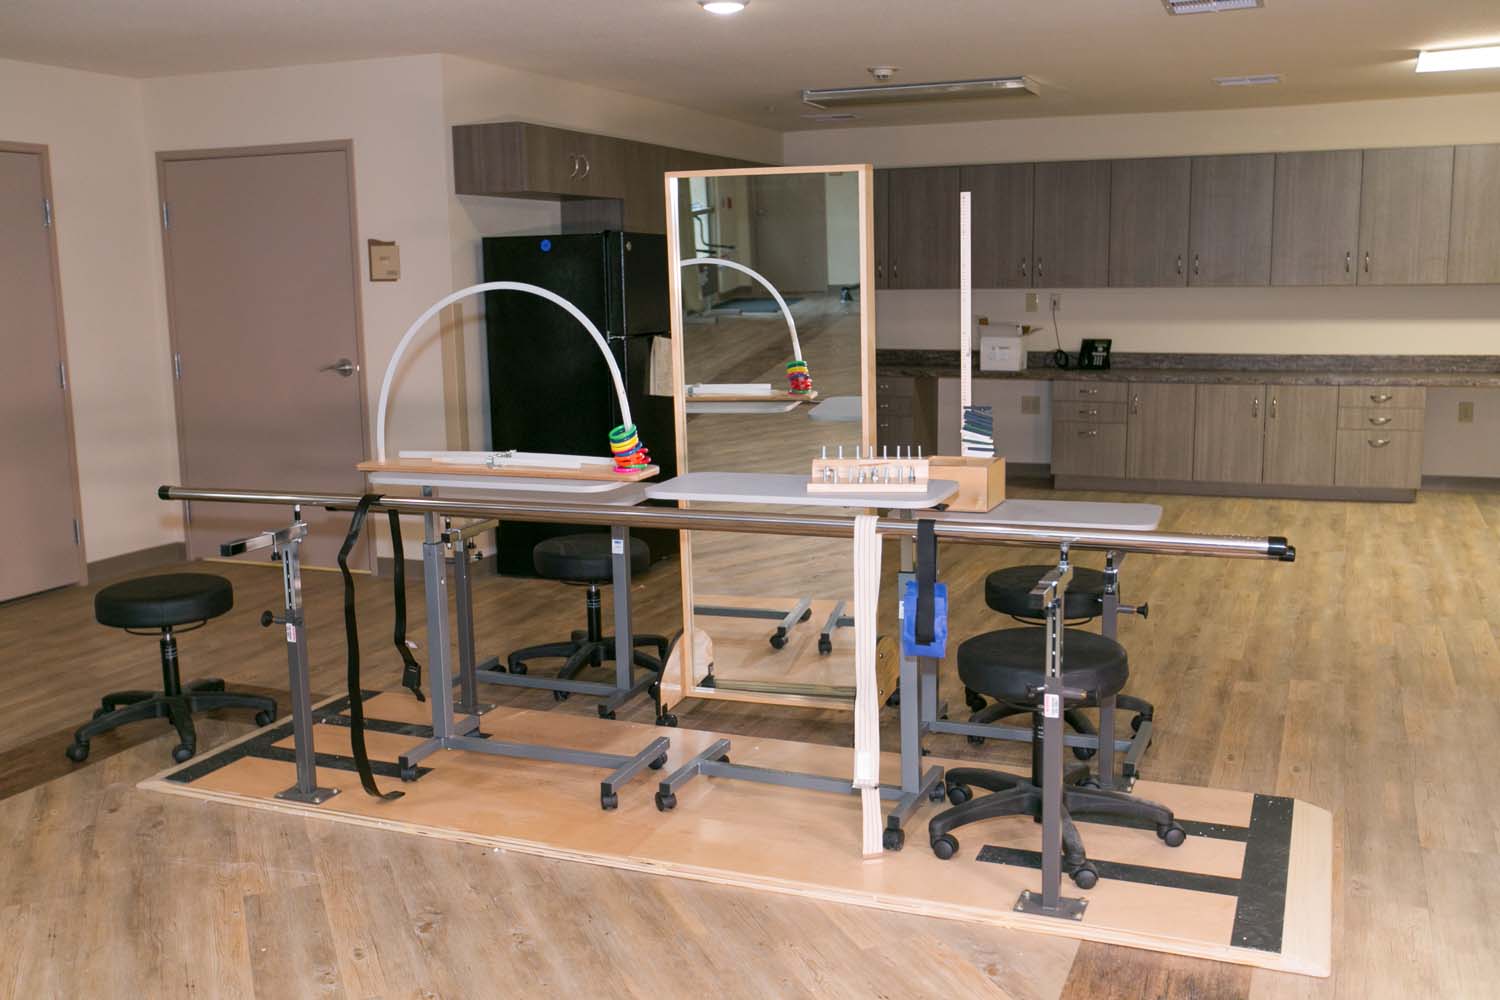
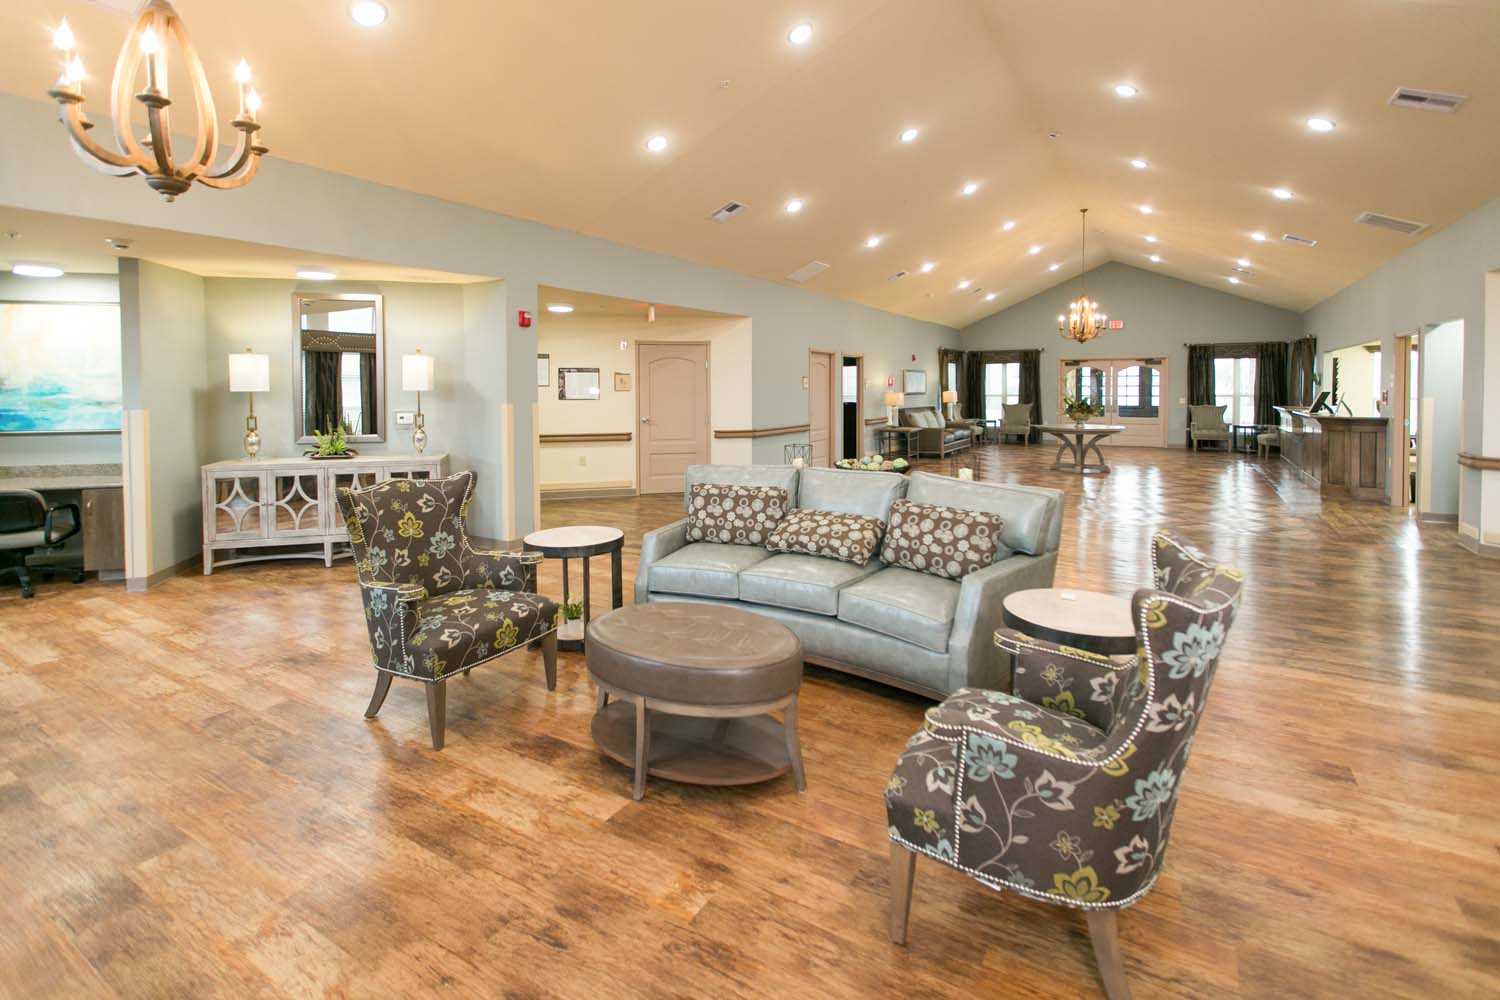
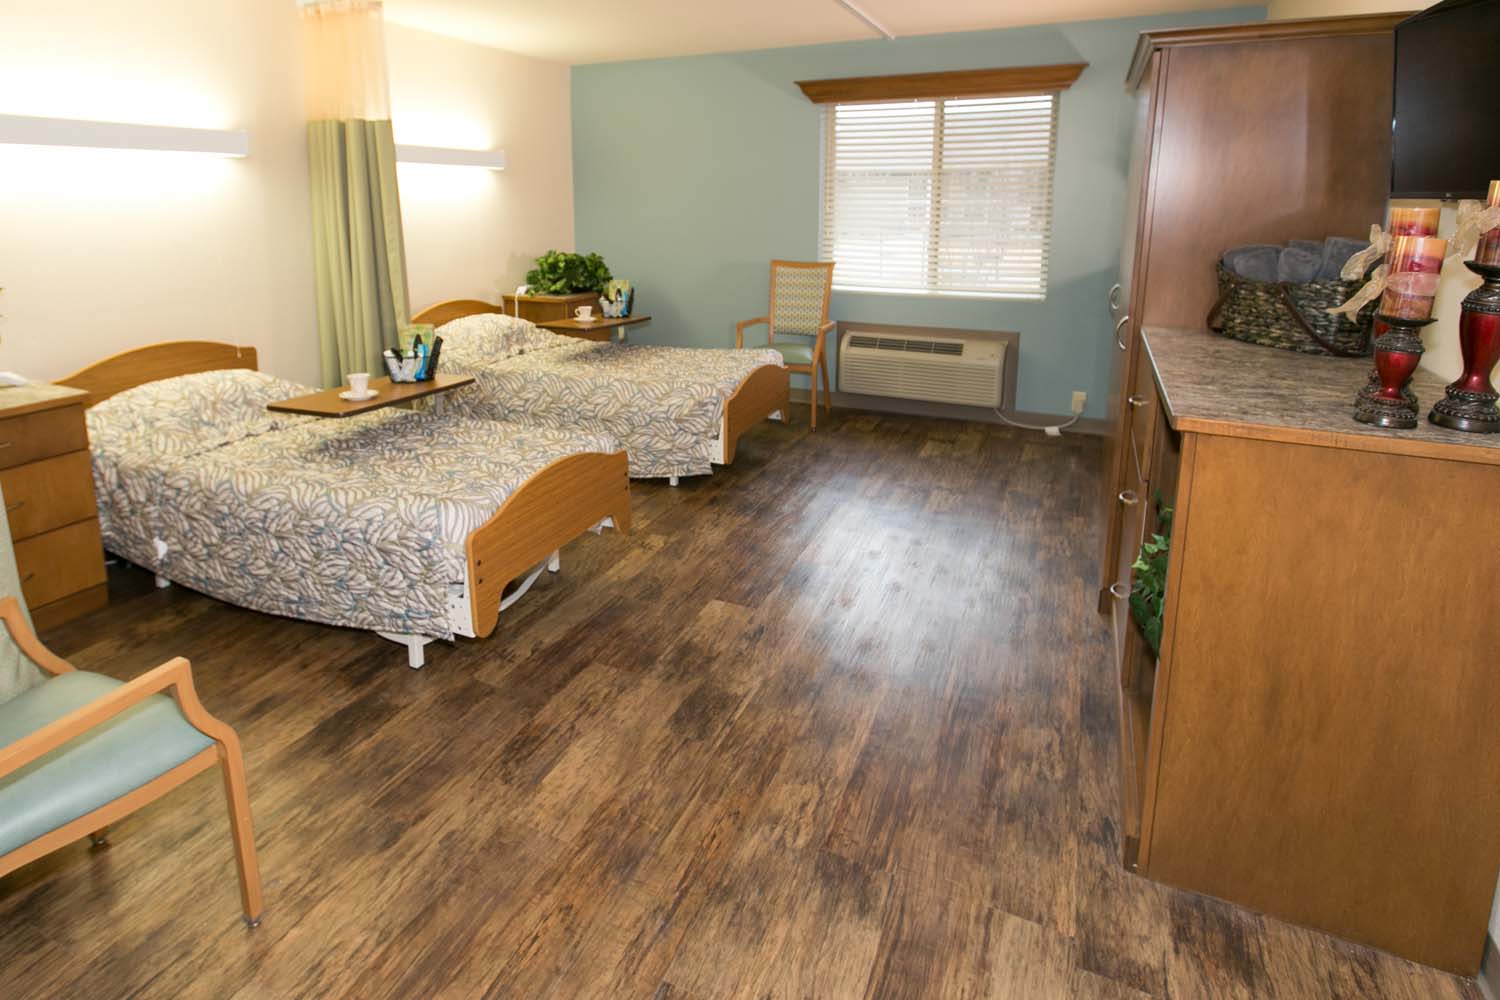

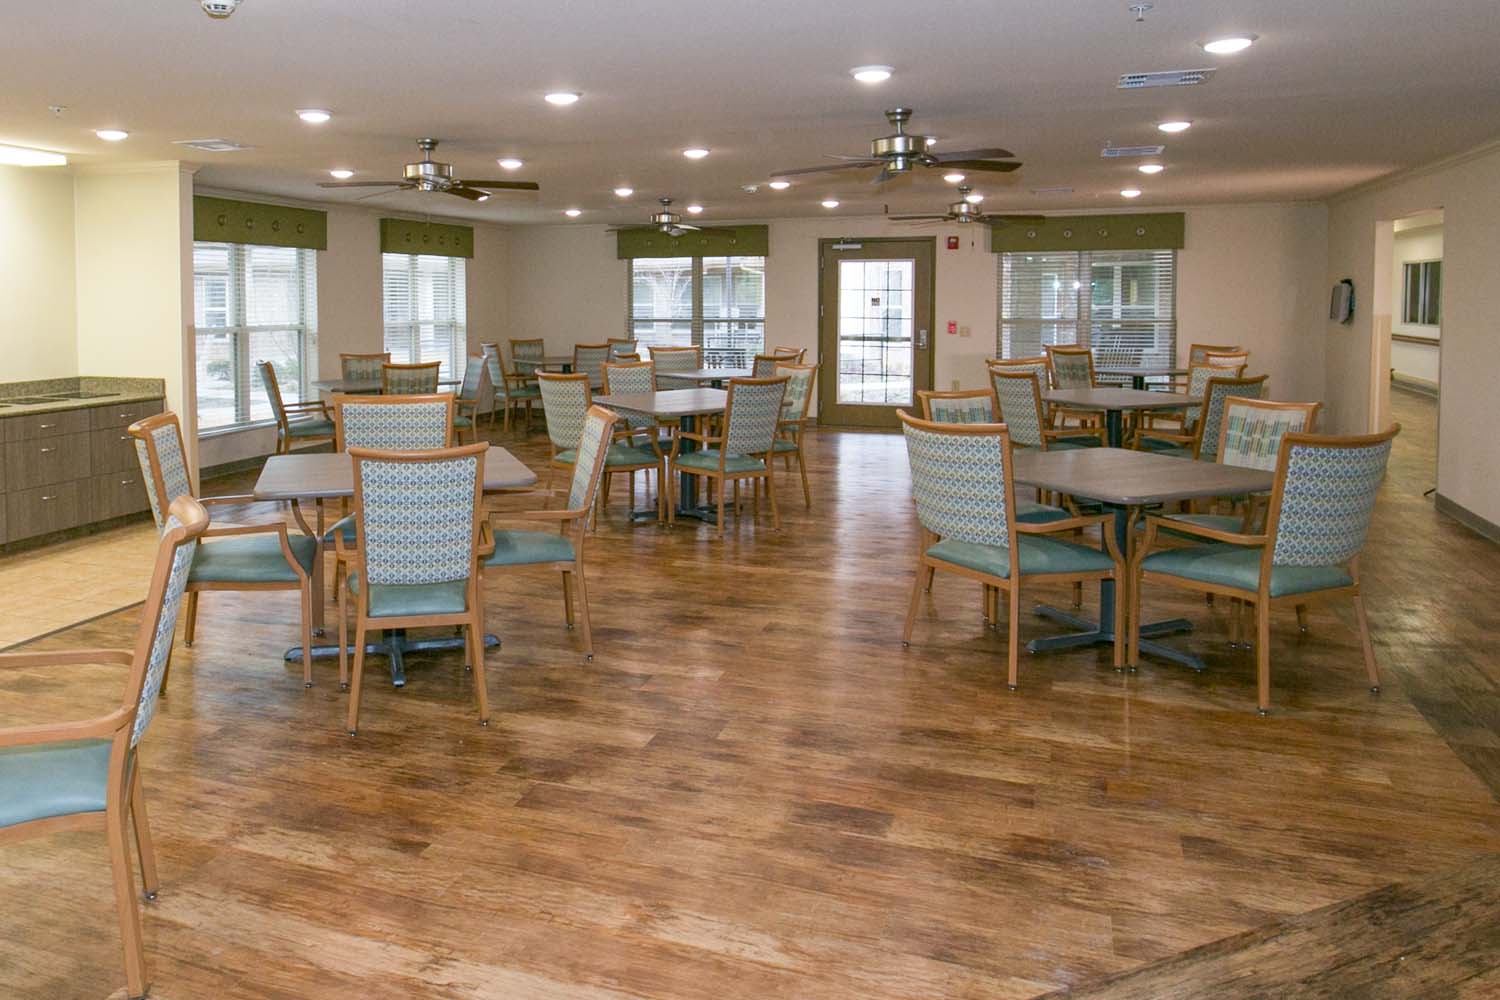
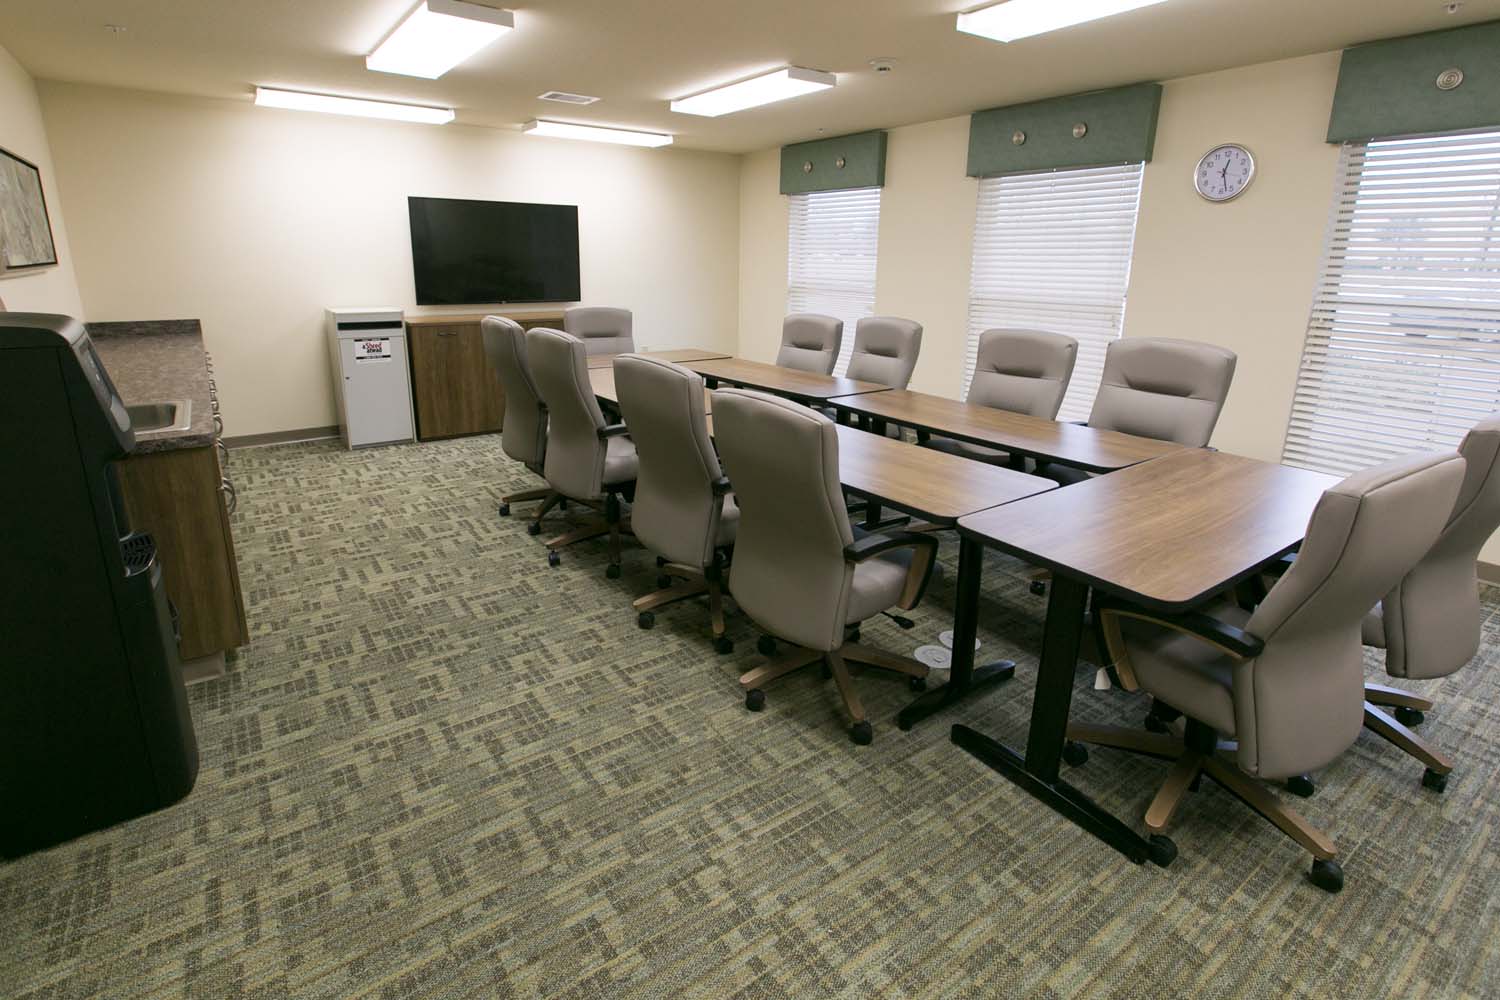

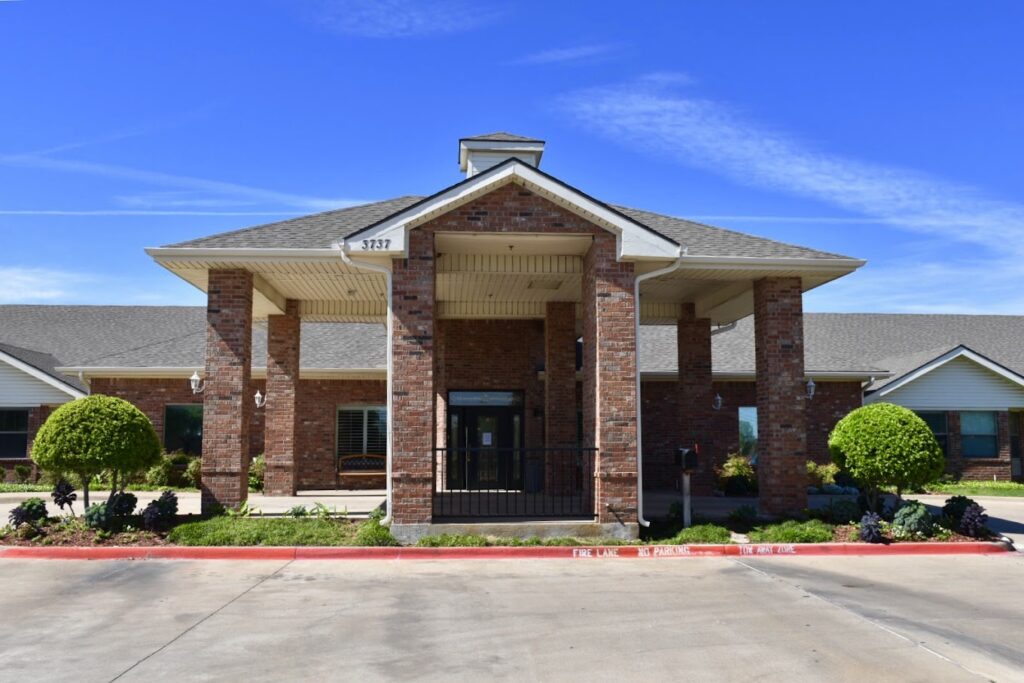
In Garland, Texas, Legend Oaks Healthcare & Rehabilitation boasts an exceptional team of senior care professionals, offering a cutting-edge approach to senior living. Tailoring their programs to meet the diverse needs of seniors, this dedicated team delivers services of the highest caliber. Their therapy programs are not only comprehensive but also customizable, benefiting from the expertise of experienced physical, occupational, and speech therapists. The therapy gym, equipped with state-of-the-art facilities, reflects the commitment to providing top-notch rehabilitation services.
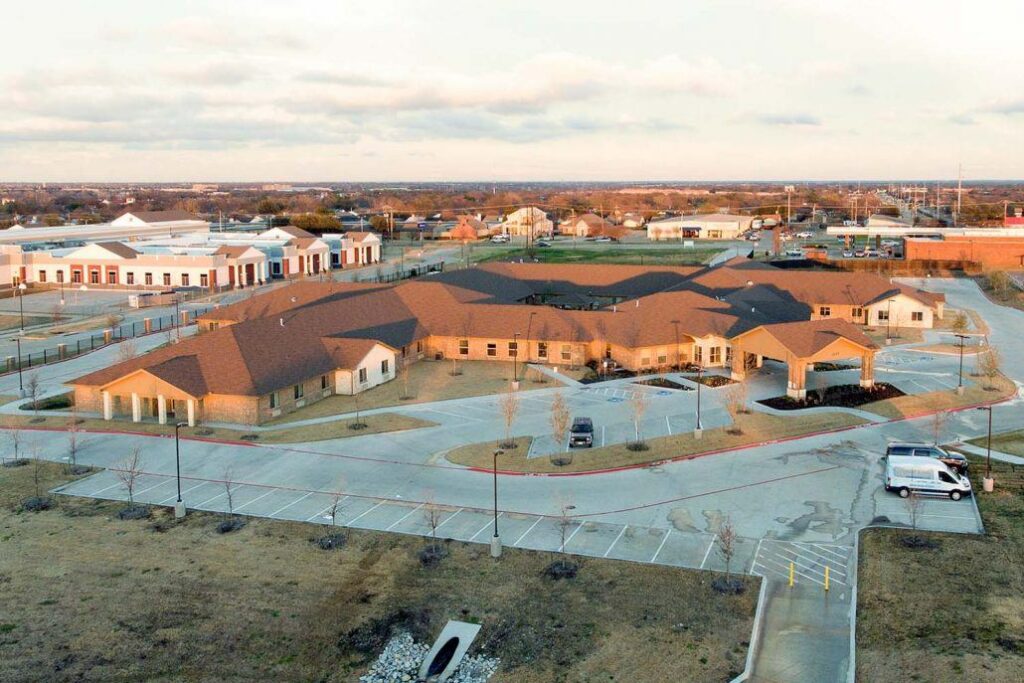
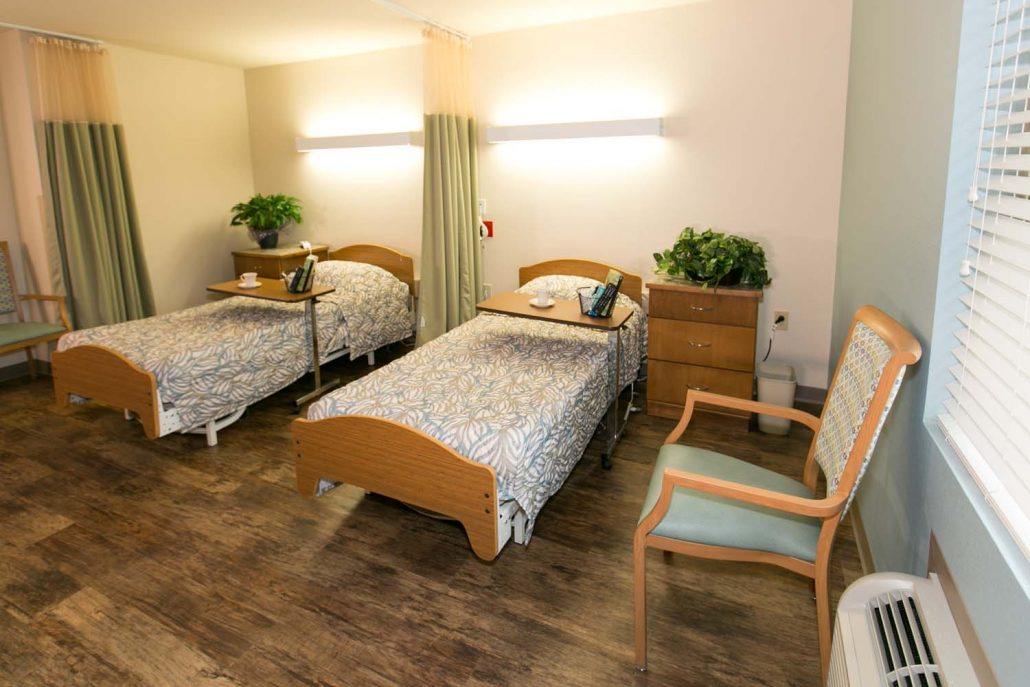
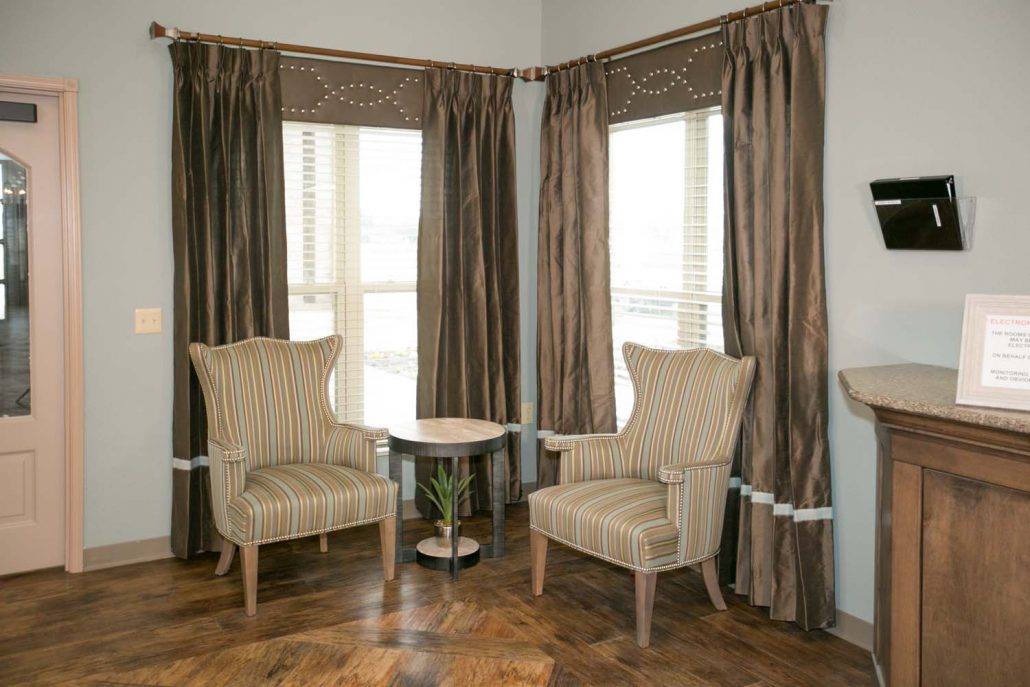
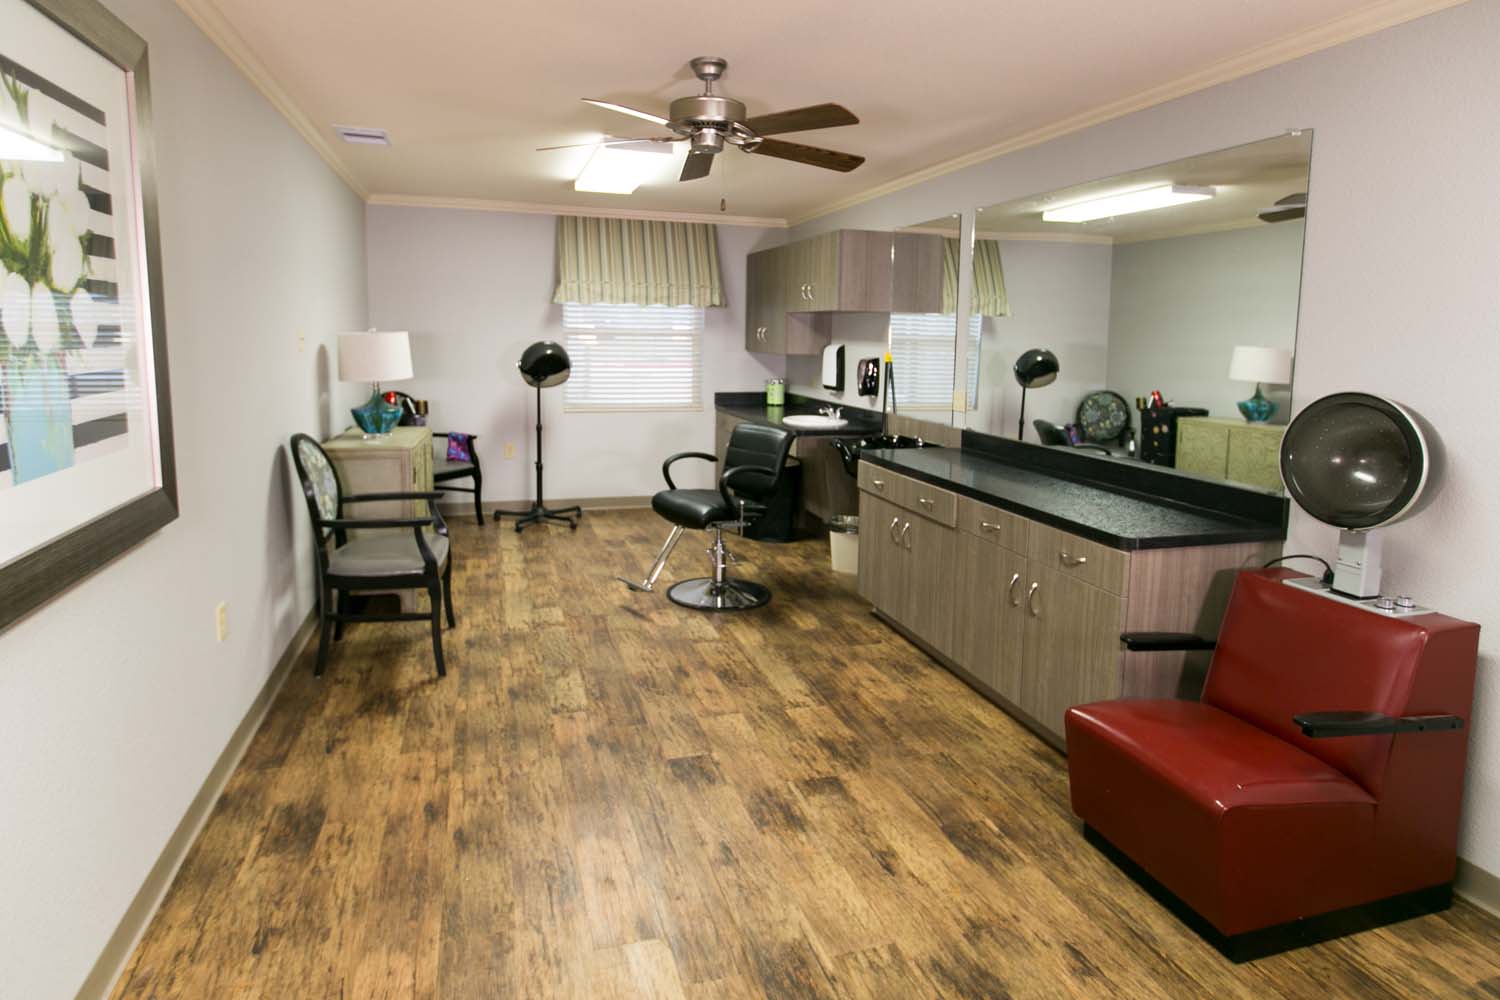
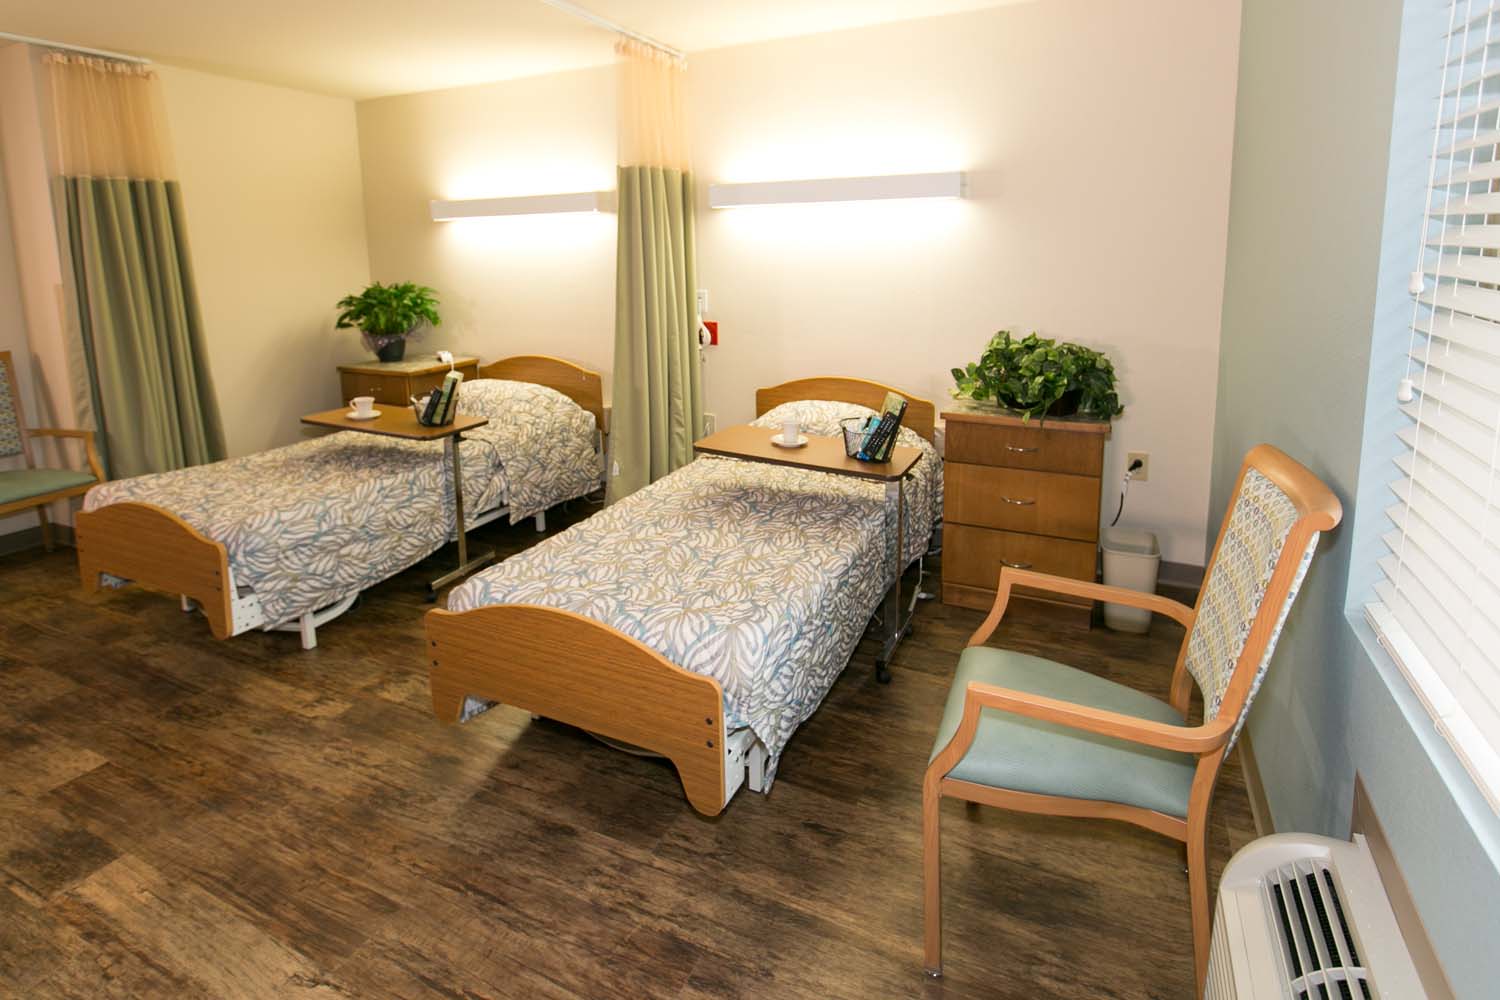
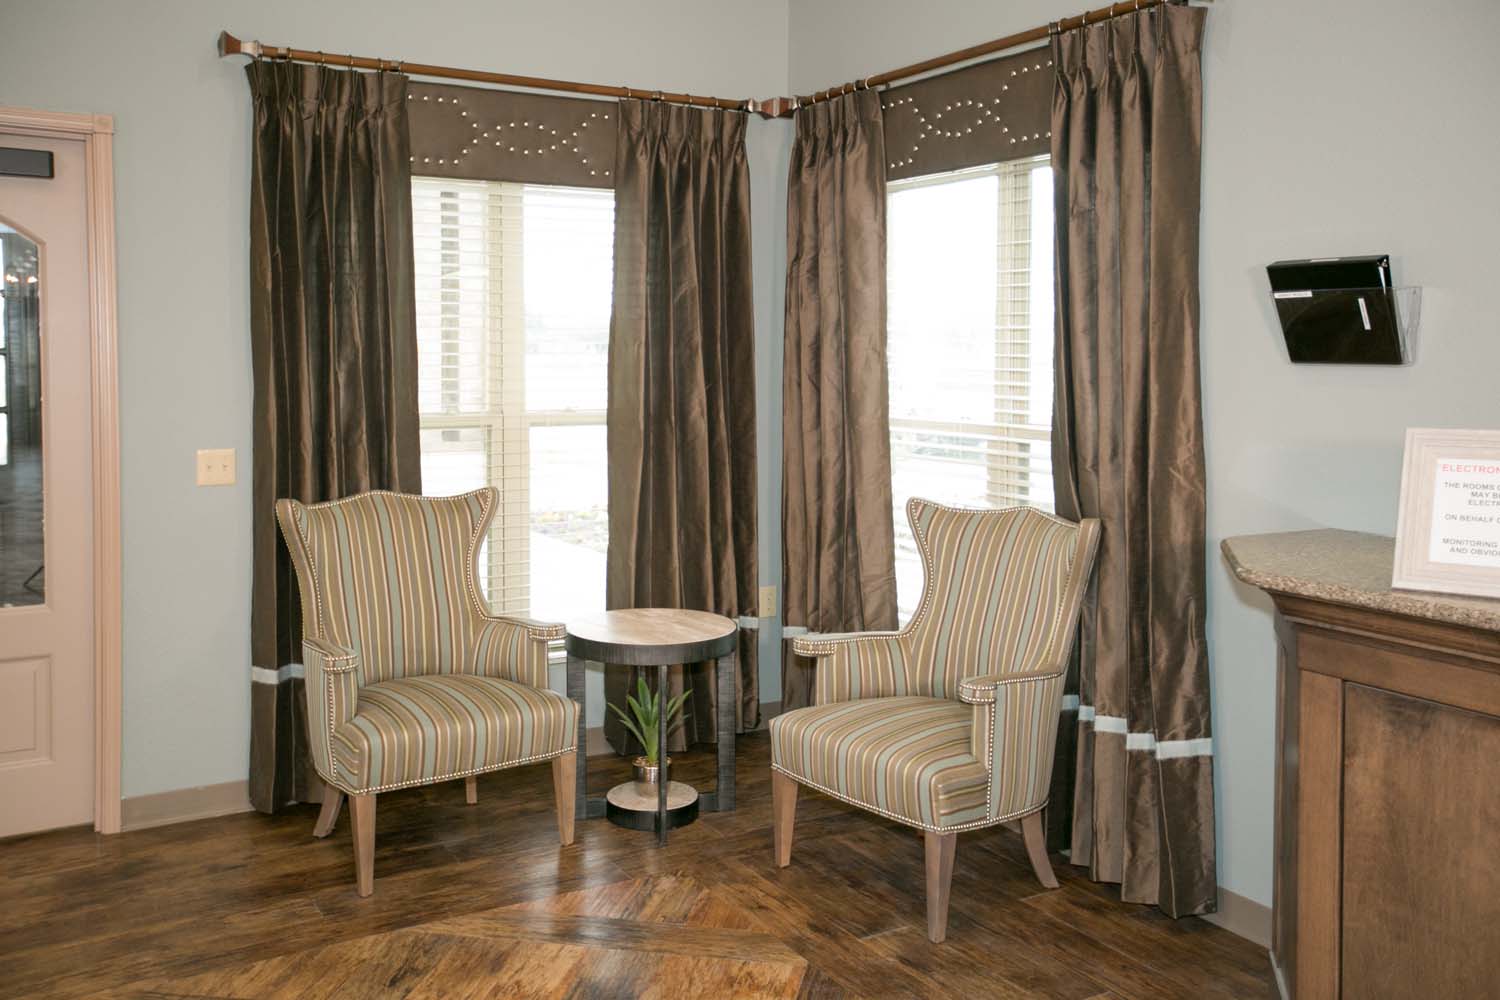
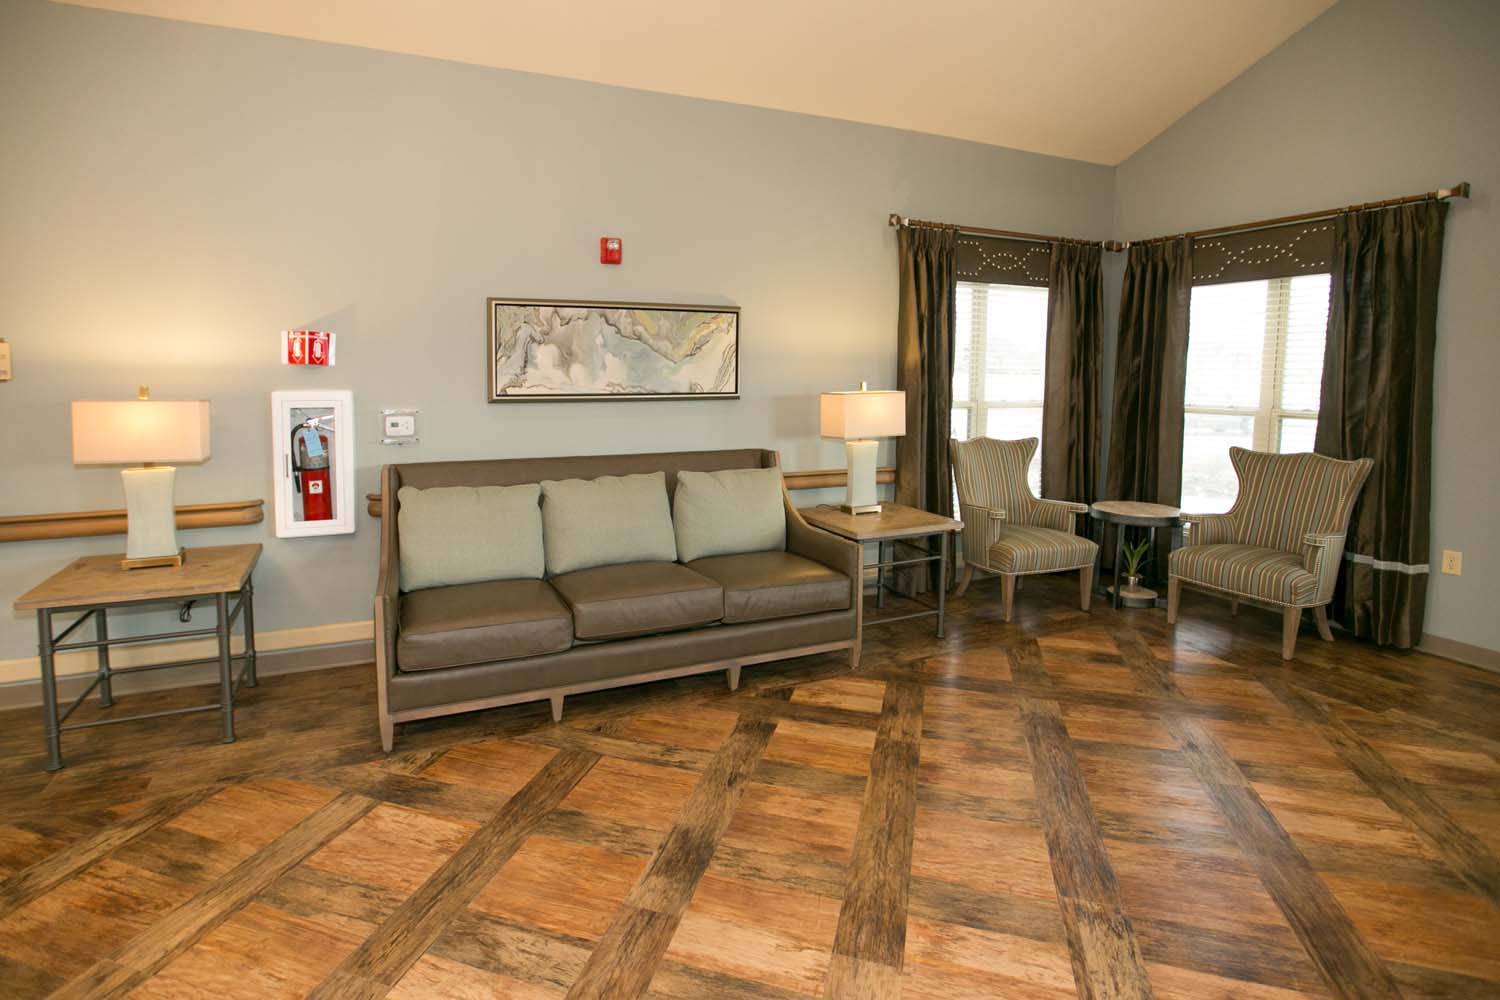
Beyond the therapeutic aspect, Legend Oaks Healthcare & Rehabilitation also embraces the importance of outdoor spaces, fostering a daily dose of fresh air and engaging recreational activities. The community exudes warmth, creating a soothing environment that enhances the overall well-being of its residents. With a focus on nursing home facilities, the center ensures a holistic and enriching experience for seniors, emphasizing personalized care and modern amenities.
Offers a balance of services and community atmosphere.
Lower occupancy suggests more openings may be available.
This home supports both short-term rehab and long-term care, with residents staying for a wide range of durations.
29% of new residents, usually for short-term rehab.
49% of new residents, often for short stays.
23% of new residents, often for long-term daily care.
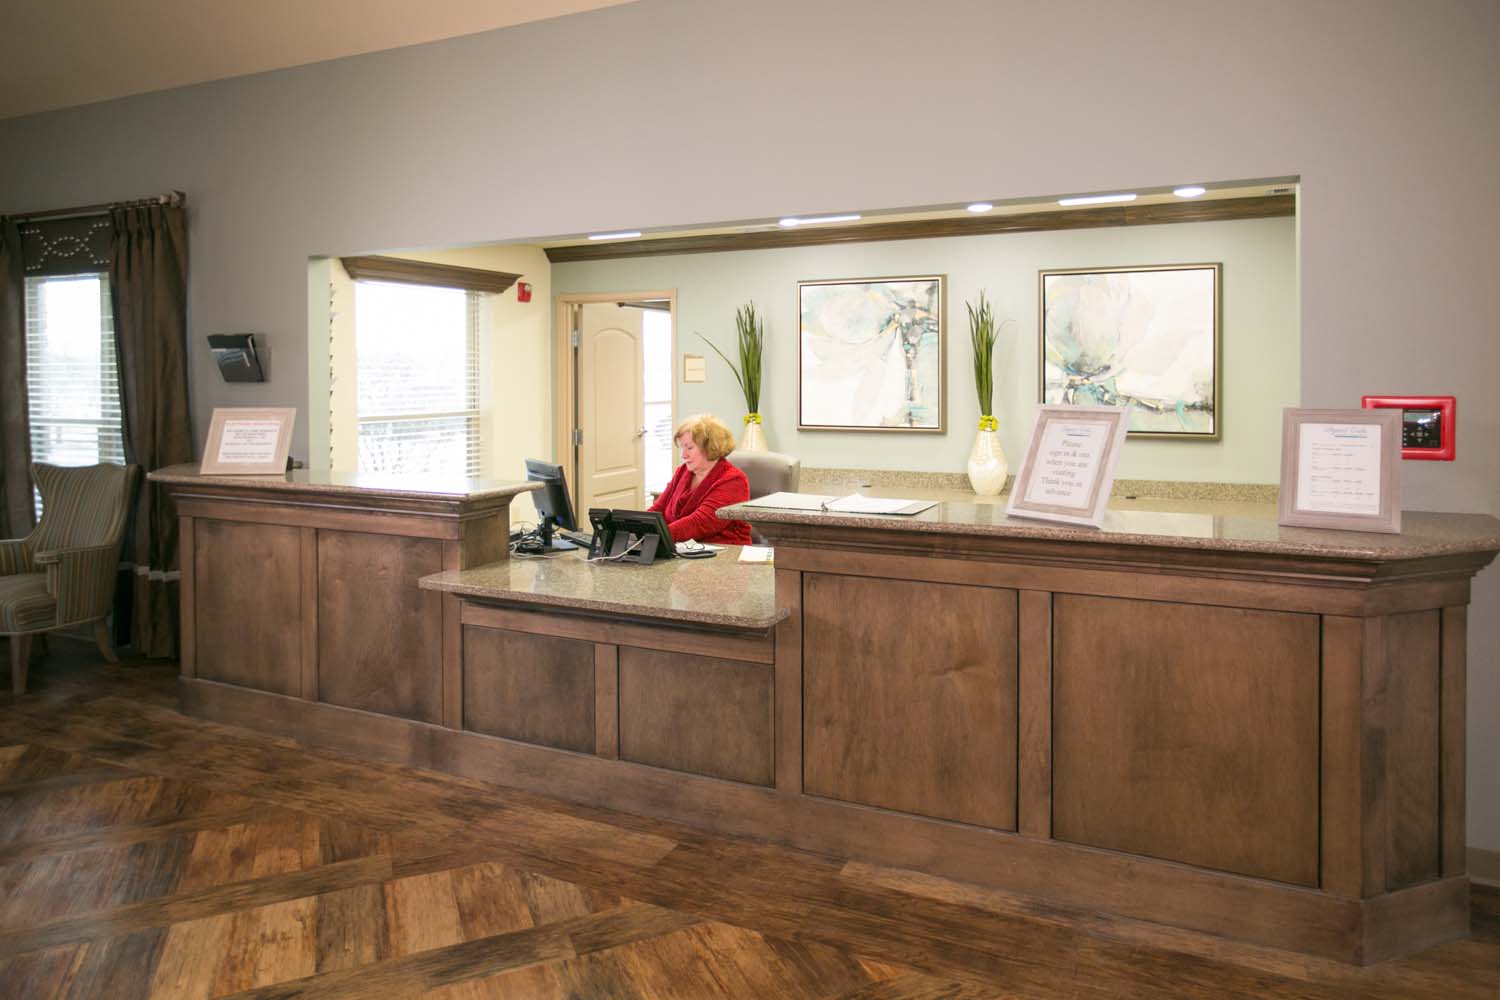
Legend Oaks Healthcare & Rehabilitation is administrated by MARTIN HARRIS.
Key information about the people who lead and staff this community.
In Texas, the Health and Human Services Commission (HHSC) is the primary regulatory body that conducts unannounced inspections and publishes quality reports for all long-term care homes.
5 visits/inspections triggered by complaints
3 routine inspections
9 with issues
0 without issues
Deficiencies indicate regulatory issues. A higher number implies the facility had several areas requiring improvement.
Texas average 7.4
Last Health inspection on Feb 2025
Texas average 25.9
Texas average 3.67
Health citations are formal notices following inspections when they fail to comply with safety and care standards.
8 of 30 citations resulted from standard inspections; 11 of 30 resulted from complaint investigations; and 11 of 30 came from combined inspections (standard and complaint).
Texas average: 2
Texas average: 0.4
Data sourced from CMS Health Deficiencies reports. Citation severity codes range from A (least serious) to L (most serious). Immediate Jeopardy (J-L) citations indicate situations where the facility's noncompliance has placed residents at risk of death or serious harm.
Nursing Home Licensed facility providing 24/7 skilled nursing care for residents with complex, ongoing medical needs. Staffed by RNs, LPNs, and CNAs. Inspected and star-rated annually by CMS. Accepts Medicare (short-term rehab) and Medicaid (long-term care).
Respite Care Short-term temporary care — days to weeks — to give family caregivers a break. Full care provided during the stay. Often used after hospitalization or to trial a facility before a permanent placement decision.
Nursing Home Licensed facility providing 24/7 skilled nursing care for residents with complex, ongoing medical needs. Staffed by RNs, LPNs, and CNAs. Inspected and star-rated annually by CMS. Accepts Medicare (short-term rehab) and Medicaid (long-term care).
Nursing Home Licensed facility providing 24/7 skilled nursing care for residents with complex, ongoing medical needs. Staffed by RNs, LPNs, and CNAs. Inspected and star-rated annually by CMS. Accepts Medicare (short-term rehab) and Medicaid (long-term care).
Respite Care Short-term temporary care — days to weeks — to give family caregivers a break. Full care provided during the stay. Often used after hospitalization or to trial a facility before a permanent placement decision.
Memory Care Secured, specialized care for people living with Alzheimer's or dementia. Staff trained in cognitive impairment, with higher staff-to-resident ratios and an environment designed to reduce confusion and wandering risk.
Nursing Home Licensed facility providing 24/7 skilled nursing care for residents with complex, ongoing medical needs. Staffed by RNs, LPNs, and CNAs. Inspected and star-rated annually by CMS. Accepts Medicare (short-term rehab) and Medicaid (long-term care).
Respite Care Short-term temporary care — days to weeks — to give family caregivers a break. Full care provided during the stay. Often used after hospitalization or to trial a facility before a permanent placement decision.
Nursing Home Licensed facility providing 24/7 skilled nursing care for residents with complex, ongoing medical needs. Staffed by RNs, LPNs, and CNAs. Inspected and star-rated annually by CMS. Accepts Medicare (short-term rehab) and Medicaid (long-term care).
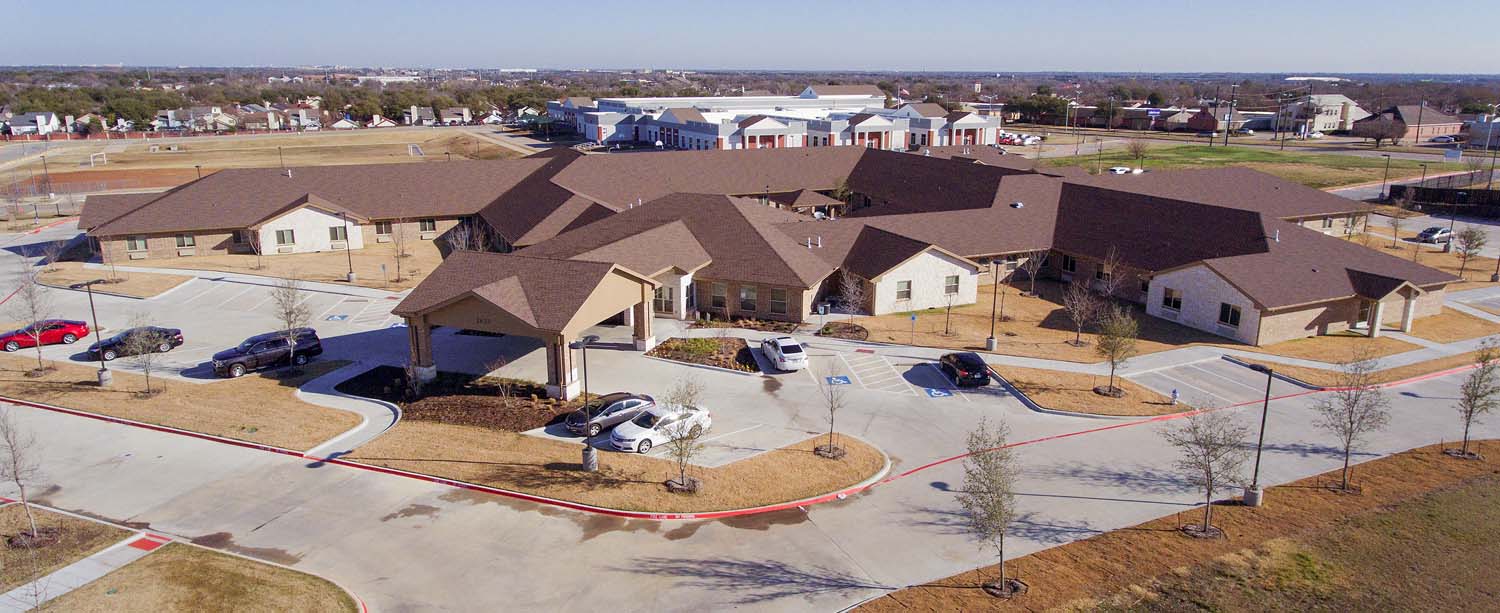
![]() 3.8 miles from city center — 6.59 miles to nearest hospital (Texas Oncology-Medical City Dallas Blood and Marrow Transplant)
3.8 miles from city center — 6.59 miles to nearest hospital (Texas Oncology-Medical City Dallas Blood and Marrow Transplant)
![]() 2625 Belt Line Rd, Garland, TX 75044
2625 Belt Line Rd, Garland, TX 75044
Add your location
This data corresponds to Q2 2025 and is based on CMS Payroll-Based Journal.
Texas average ratio: 1.51:1
Texas average: 8.1 hours
Manages medical care and health needs.
No contractors work on this role.
Assists with medical care and medications.
No contractors work on this role.
Helps with daily care and mobility.
No contractors work on this role.
Total hours from contractors
37 contractor hours this quarter
| Certified Nursing Assistant | 50 | 0 | 50 | 14,200 | 91 | 100% | 8.1 |
| Licensed Practical Nurse | 23 | 0 | 23 | 6,114 | 91 | 100% | 9.9 |
| Medication Aide/Technician | 13 | 0 | 13 | 3,331 | 90 | 99% | 8.4 |
| Registered Nurse | 11 | 0 | 11 | 3,274 | 91 | 100% | 10.6 |
| Qualified Social Worker | 11 | 0 | 11 | 2,317 | 82 | 90% | 6.9 |
| Respiratory Therapy Technician | 9 | 0 | 9 | 2,214 | 75 | 82% | 7.3 |
| Physical Therapy Aide | 10 | 0 | 10 | 1,982 | 74 | 81% | 7.2 |
| Physical Therapy Assistant | 7 | 0 | 7 | 1,573 | 75 | 82% | 7.4 |
| Clinical Nurse Specialist | 4 | 0 | 4 | 1,173 | 65 | 71% | 8.6 |
| Speech Language Pathologist | 11 | 0 | 11 | 1,090 | 78 | 86% | 6.8 |
| Dental Services Staff | 2 | 0 | 2 | 1,008 | 65 | 71% | 8 |
| Therapeutic Recreation Specialist | 2 | 0 | 2 | 671 | 70 | 77% | 6.6 |
| RN Director of Nursing | 3 | 0 | 3 | 614 | 65 | 71% | 8.9 |
| Dietitian | 1 | 0 | 1 | 509 | 58 | 64% | 8.8 |
| Administrator | 1 | 0 | 1 | 504 | 63 | 69% | 8 |
| Mental Health Service Worker | 1 | 0 | 1 | 496 | 62 | 68% | 8 |
| Nurse Practitioner | 1 | 0 | 1 | 495 | 55 | 60% | 9 |
| Occupational Therapy Aide | 0 | 1 | 1 | 37 | 9 | 10% | 4.1 |
Source: CMS Long-Term Care Facility Characteristics (Data as of Jan 2026)
Residents meet regularly to discuss policies, care quality, and activities
Organized group of residents that meets regularly to discuss facility policies, quality of life, and activities.
Data sourced from CMS Long-Term Care Facility Characteristics quarterly report. Payer mix reflects the current resident census by primary payment source.
These measures show how residents usually do over time at this home, based on health outcomes and preventive care.
Texas average: 8.6
Texas average: 16.0
Texas average: 16.2%
Texas average: 16.2%
Texas average: 15.7%
Texas average: 3.2%
Texas average: 4.4%
Texas average: 0.8%
Texas average: 3.5%
Texas average: 2.9%
Texas average: 7.9%
Texas average: 97.3%
Texas average: 97.9%
Texas average: 2.13
Texas average: 2.07
Texas average: 90.4%
Texas average: 1.4%
Texas average: 88.0%
Texas average: 25.9%
Texas average: 12.0%
Texas average: 0.8%
Texas average: 53.7%
Texas average: 50.6%
Quality measures are calculated from Minimum Data Set (MDS) assessments. For most measures, lower percentages indicate better care quality.
Federal penalties imposed by CMS for regulatory violations, including civil money penalties (fines) and denials of payment for new Medicare/Medicaid admissions.
Source: CMS Penalties Database (Data as of Jan 2026)
Texas average: $80K
Texas average: 2.5
Texas average: 0.2
Penalties are imposed by CMS for violations of federal nursing home regulations.
Last updated: Jan 2026
Historical financial and operational data for Legend Oaks Healthcare & Rehabilitation based on CMS SNF Cost Reports.
Loading trend charts...
Care Cost Calculator: See Prices in Your Area
Nursing Home Data Explorer
Don’t Wait Too Long: 7 Red Flag Signs Your Parent Needs Assisted Living Now
The True Cost of Assisted Living in 2025 – And How Families Are Paying For It
Understanding Senior Living Costs: Pricing Models, Discounts & Financial Assistance

Touring a community? Use this expert-backed checklist to stay organized, ask the right questions, and find the perfect fit.
We'll send you a PDF version of the touring checklist.