Winters Park Nursing and Rehabilitation Center
Nursing Home, Hospice Care, Memory Care, Palliative Care & Respite Care · Garland, TX
CMS overall rating Info CMS (the Centers for Medicare & Medicaid Services) is the federal agency that rates nursing home quality. Its Overall Rating runs from 1 to 5 stars, combining health inspections, staffing, and quality measures, with inspections weighted most heavily.

Winters Park Nursing and Rehabilitation Center

Nursing Home, Hospice Care, Memory Care, Palliative Care & Respite Care · Garland, TX
CMS overall rating Info CMS (the Centers for Medicare & Medicaid Services) is the federal agency that rates nursing home quality. Its Overall Rating runs from 1 to 5 stars, combining health inspections, staffing, and quality measures, with inspections weighted most heavily.
Calculator: See prices in your area
Winters Park Nursing and Rehabilitation Center accepts Medicare, Medicaid, and private pay.

Overview of Winters Park Nursing and Rehabilitation Center

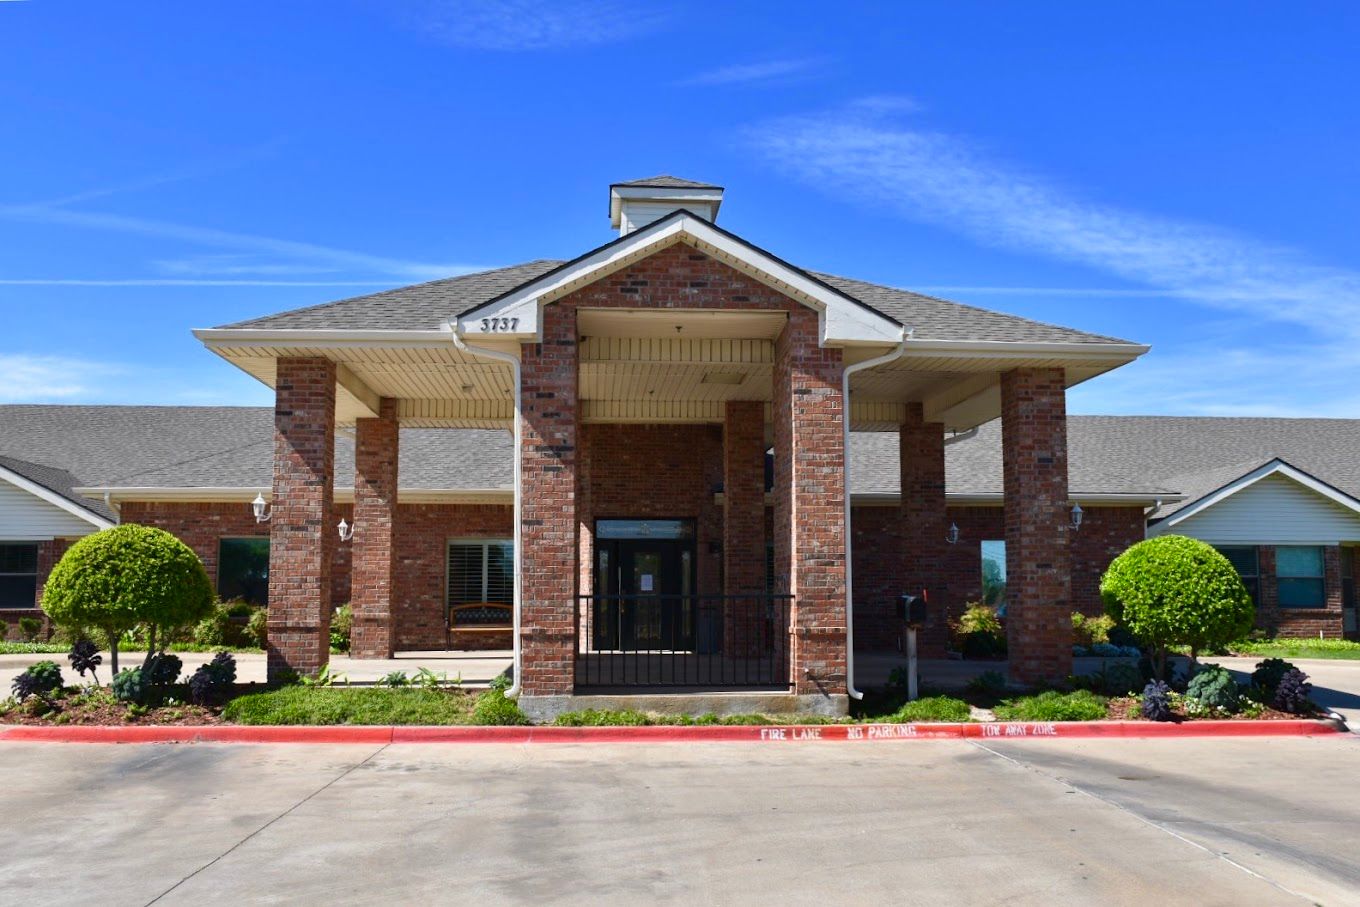
Tucked in Garland, Texas, the Winters Park Nursing and Rehabilitation Center exudes a distinctive charm as a nursing home, offering both short-term rehabilitation programs and long-term care services. With a focus on individualized care, the center boasts a competent staff, including a medical director, physicians, and a remarkable team of healthcare experts. Families can rest assured that their loved ones are in capable hands, benefiting from the expertise of professionals who understand their roles and responsibilities.

The facility maintains a clean environment with a friendly staff dedicated to assisting seniors in regaining their independence and maximizing their functioning at the earliest convenience. Its competent staff, which includes a medical director, physicians, and a stellar team of healthcare experts, ensures that each resident receives a tailored care plan. With a commitment to cleanliness and a welcoming atmosphere, the facility is not only reliable but also supportive in helping seniors regain their independence swiftly. Families can place their trust in this center, confident that their loved ones are in the care of professionals dedicated to enhancing their overall well-being.

(972) 495-7000

Quality ratings

Measured by Centers for Medicare & Medicaid Services (CMS)

Overall rating Info The Overall CMS Rating combines results from health inspections, staffing levels and quality measures. Health inspections carry the most weight. Staffing and quality scores can increase or decrease the final rating based on performance compared to state and national standards.
▼ 28.4% Below TX avg. ▼ 28.4% Below TX avg.TX average: 2.8Click the badge to see the full State ranking.Click here to see the full State ranking.
Health Inspection Info Based on the results of the facility's three most recent standard inspections and any complaint investigations. CMS reviews the number, scope, and severity of deficiencies, with more recent findings weighted more heavily.
▼ 27.6% Below TX avg. ▼ 27.6% Below TX avg.TX average: 2.8Click the badge to see the full State ranking.Click here to see the full State ranking.
Staffing Info Measures average nursing staff hours per resident per day, including Registered Nurses (RNs) and total nursing staff. Ratings are adjusted based on the level of care residents require and are compared to state and national benchmarks.
▲ 41.4% Above TX avg. ▲ 41.4% Above TX avg.TX average: 2.1Click the badge to see the full State ranking.Click here to see the full State ranking.
Quality Measures Info Based on clinical and physical health indicators reported to CMS, such as hospital readmissions, falls, pressure ulcers, and improvements in mobility. These measures reflect how well residents' health needs are being managed.
▲ 6.5% Above TX avg. ▲ 6.5% Above TX avg.TX average: 3.8Click the badge to see the full State ranking.Click here to see the full State ranking.

Staffing hours breakdown

Info Daily nursing hours per resident by staff type, reported to CMS. Higher is generally better — compare this facility to state and national averages to see where staffing stands.

Hours per resident per day — compared to Texas state averages

Total nursing care / resident Info This home is ranked 93rd out of 296 homes in Texas for nurse hours. Total adjusted nursing hours per resident per day, combining RN, LPN, and aide time. CMS adjusts this for case-mix so facilities can be fairly compared.
3h 50m per day
Rank #93 / 296Nurse hours — State benchmarkedThis home is ranked 93rd out of 296 homes in Texas. Shows adjusted nurse hours per resident per day benchmarked to the Texas average, with a ranking across 296 Texas facilities. More hours mean more direct care. The national average is about 3.5 hrs; below 3.0 is a red flag.Rankings are based only on facilities in Texas that report data for that category. Facilities without available data are excluded from the ranking.Click the rank badge to see the full State ranking.Click here to see the full State ranking.
This facility Texas avg (3h 38m per day)
vs Texas avg
+6%

1 of 6 metrics below state avg

Standout metric Physical Therapist is +78% above state avg
Staff typeHours / Day / Residentvs state avg
Registered Nurse (RN) Info RNs hold the highest nursing license and can assess residents, interpret test results, and direct care plans. More RN hours per day often signals stronger clinical oversight and faster response to health changes. 40m per day ▲ 52% State avg: 26m per day · National avg: 41m per day
LPN / LVN Info Licensed Practical Nurses (LPNs) or Licensed Vocational Nurses (LVNs) deliver routine hands-on care — medication administration, wound dressing, and monitoring vital signs. They work under RN supervision and make up a large share of daily bedside care. 35m per day ▼ 39% State avg: 57m per day · National avg: 52m per day
Nurse Aide Info Certified Nurse Aides (CNAs) provide the most direct day-to-day assistance: bathing, dressing, feeding, and mobility. Nurse aide hours are typically the largest staffing category and directly affect residents' quality of life. 2h 3m per day ■ Avg State avg: 2h 1m per day · National avg: 2h 21m per day
Weekend Total Nursing Info Combined nursing hours (RN + LPN + Nurse Aide) per resident per day on weekends. Staffing often drops on weekends — this figure reveals whether the facility maintains adequate coverage outside of weekday hours. 2h 58m per day ■ Avg State avg: 2h 59m per day · National avg: 3h 26m per day
Physical Therapist Info Hours per resident per day provided by licensed Physical Therapists (PTs) or PT Assistants. PT services help residents recover mobility after injury or illness and are especially important for post-acute (short-stay) rehabilitation. 7m per day ▲ 78% State avg: 4m per day · National avg: 4m per day
Weekend RN Info Registered nurse hours specifically on weekends. Facilities sometimes reduce RN presence on Saturdays and Sundays — a low weekend RN figure compared to weekday hours can indicate reduced clinical oversight when most administrative staff are absent. 35m per day ▲ 67% State avg: 21m per day · National avg: 29m per day

Capacity and availability

This home usually has availability

Lower occupancy than the Texas average: 63.5%
Occupancy rate
55.1% Rank #228 / 304Occupancy rate — State benchmarkedThis home is ranked 228th out of 304 homes in Texas. Shows this facility's occupancy rate versus the Texas average, with its Statewide rank out of 304. Higher occupancy signals strong local demand and financial stability.Rankings are based only on facilities in Texas that report data for that category. Facilities without available data are excluded from the ranking.Click the rank badge to see the full State ranking.Click here to see the full State ranking.
Avg. Length of Stay
154 days
Bed community size
132-bed community Rank #121 / 988Bed count — State benchmarkedThis home is ranked 121st out of 988 homes in Texas. Shows this facility's certified or reported bed count compared to other Texas facilities. Larger communities may offer more amenities, programs, and on-site services for residents and families.Rankings are based only on facilities in Texas that report data for that category. Facilities without available data are excluded from the ranking.Click the rank badge to see the full State ranking.Click here to see the full State ranking.
A larger shared setting that may offer more common spaces and organized community services.
Walk Score
Walk Score: 49 / 100 Rank #543 / 1391Walk Score — State benchmarkedThis home is ranked 543rd out of 1391 homes in Texas. Shows how walkable this facility's neighborhood is compared to the average Walk Score across Texas facilities. Higher scores benefit residents, families, and staff.Rankings are based only on facilities in Texas that report data for that category. Facilities without available data are excluded from the ranking.Click the rank badge to see the full State ranking.Click here to see the full State ranking.
Somewhat walkable. A few nearby services may be reachable on foot, but most trips require transportation.

About this community

License Details

CMS Certification Number676039

Staffing

Key information about the people who lead and staff this community.

Leadership

ContactEric Feinman, Administrator

Contact Winters Park Nursing and Rehabilitation Center

Inspection History

In Texas, the Health and Human Services Commission (HHSC) is the primary regulatory body that conducts unannounced inspections and publishes quality reports for all long-term care homes.

Since 2022 · 4 years of data 23 citations

Inspection Scorecard Info This scorecard compares key inspection, citation, and complaint metrics at this facility against the Texas state average. Metrics rated ≥15% worse than average are highlighted in red; those ≥15% better are highlighted in green.

Since 2022 vs. Texas state average
Overall vs. TX average 2 Worse Metrics worse than Texas average:
• Total citations (283% above)
• Citations per year (287% above)
0 Better No metrics in this bucket.
Latest Inspection December 9, 2025 Complaint Investigation

Citations Info Citations are formal regulatory issues recorded during state inspections.

This FacilityTX Averagevs. TX Avg
Total citations Info Formal regulatory issues recorded by inspectors across all inspection types. 236 This facility has 283% more total citations than a typical Texas nursing home (23 vs. TX avg 6).↑ 283% worse
Citations per year Info Average citations per year since 2022. 5.81.5 This facility has 287% more citations per year than a typical Texas nursing home (5.8 vs. TX avg 1.5).↑ 287% worse

Inspection Reports Summary Info An editor-reviewed summary of the themes and findings across this facility's recent inspection reports.

  • December 9, 2025 complaint investigation found 3 deficiencies including misappropriation of 11 Soma pills and failure to submit timely PASRR NFSS forms.
  • December 7, 2023 complaint investigation substantiated physical abuse of Resident #16 by CNA who pushed the resident to the floor, plus failures in care planning and food safety.
  • July 22, 2023 complaint investigation revealed Immediate Jeopardy for failure to notify physician of critical lab results and provide treatment; IJ was removed after corrective actions.

Health Inspection History

Inspections since 2022
Total health inspections 9

Texas average 7.4


Last Health inspection on Jan 2025

Total health citations
19 Rank #126 / 299Health citations — State benchmarkedThis home is ranked 126th out of 299 homes in Texas. Shows this facility's total health deficiency citations benchmarked to the Texas State average, with a ranking across all 299 TX facilities. Lower citation counts earn a better rank.Rankings are based only on facilities in Texas that report data for that category. Facilities without available data are excluded from the ranking.Click the rank badge to see the full State ranking.Click here to see the full State ranking.

Texas average 25.9

Citations per inspection
2.11 Rank #35 / 299Citations per inspection — State benchmarkedThis home is ranked 35th out of 299 homes in Texas. Shows average deficiency citations per CMS inspection for this facility versus the Texas mean across 299 facilities with citation data. Lower is better.Rankings are based only on facilities in Texas that report data for that category. Facilities without available data are excluded from the ranking.Click the rank badge to see the full State ranking.Click here to see the full State ranking.

Texas average 3.67


Health citations are formal notices following inspections when they fail to comply with safety and care standards.

5 of 19 citations resulted from standard inspections; 10 of 19 resulted from complaint investigations; and 4 of 19 came from combined inspections (standard and complaint).

Breakdown of citation severity (last 4 years)
Critical health citations
4
100% worse than Texas average

Texas average: 2


Serious health citations
0
100% better than Texas average

Texas average: 0.4

4 critical citations Texas average: 2

0 serious citations Texas average: 0.4

15 moderate citations Texas average: 23

0 minor citations Texas average: 0.4
Citations history (last 4 years)
Nutrition moderate citation Jan 30, 2025
Corrected

Care Planning moderate citation Mar 26, 2024
Corrected

Abuse/Neglect critical citation Dec 07, 2023
Corrected

Nutrition moderate citation Dec 07, 2023
Corrected

Staffing Data

Reporting period: October 1 – December 31, 2025 (Q4 2025). Source: CMS Payroll-Based Journal report.

Total staff 193
Employees 72
Contractors 121
Staff to resident ratio 2.72 : 1
84% more staff per resident than Texas average
Texas average ratio: 1.48 : 1 Texas average ratio: 1.48 : 1See full Texas ranking
Avg staff/day 44
Average shift 8.8 hours
9% better than Texas average
Texas average: 8.1 hours Texas average shift: 8.1 hoursSee full Texas ranking
Total staff hours (quarter) 35,691

Nursing staff breakdown

Q4 2025 · Oct 1 – Dec 31 More info This data comes from the CMS Payroll-Based Journal report covering October 1 – December 31, 2025.
Registered Nurse

Manages medical care and health needs.

RN Staff Info All 12 RN Staff are full-time employees. No contractors work on this role. 12
Average shift length Info Average shift length. Calculated as total hours divided by days worked and average staff per day. 9.5 hours
Licensed Practical Nurse

Assists with medical care and medications.

LPN Staff Info 46 total: 10 full-time employees and 36 contractors. 46
Average shift length Info Average shift length. Calculated as total hours divided by days worked and average staff per day. 9 hours
Certified Nursing Assistant

Helps with daily care and mobility.

CNA Staff Info 84 total: 35 full-time employees and 49 contractors. 84
Average shift length Info Average shift length. Calculated as total hours divided by days worked and average staff per day. 9.1 hours

Contractor staffing

Q4 2025 · Oct 1 – Dec 31 More info This data comes from the CMS Payroll-Based Journal report covering October 1 – December 31, 2025.

Total hours from contractors

24.7%

8,802 contractor hours this quarter

Certified Nursing Assistant: 49 Licensed Practical Nurse: 36 Medication Aide/Technician: 9 Physical Therapy Aide: 7 Speech Language Pathologist: 6 Physical Therapy Assistant: 4 Qualified Social Worker: 4 Respiratory Therapy Technician: 2 Clinical Nurse Specialist: 1 Occupational Therapy Aide: 1 Medical Director: 1 Occupational Therapy Assistant: 1

Staff by category

Q4 2025 · Oct 1 – Dec 31 More info This data comes from the CMS Payroll-Based Journal report covering October 1 – December 31, 2025.
Certified Nursing Assistant35498414,83092100%9.1
Registered Nurse120124,37692100%9.5
Licensed Practical Nurse1036463,73492100%9
Medication Aide/Technician69152,22992100%8.2
Speech Language Pathologist0661,9727076%9.4
Physical Therapy Aide0771,8827278%8.1
Qualified Social Worker0441,1166773%8.6
RN Director of Nursing2021,0829199%8.2
Respiratory Therapy Technician0229856773%9
Physical Therapy Assistant0447366571%6.7
Clinical Nurse Specialist1126346470%9.3
Administrator1015126470%8
Mental Health Service Worker2024946267%8
Dietitian2024805054%9.6
Nurse Practitioner1014725964%8
Occupational Therapy Aide011661112%6
Occupational Therapy Assistant0116189%7.6
Medical Director011301617%1.9
84 Certified Nursing Assistant
% of Days 100%
12 Registered Nurse
% of Days 100%
46 Licensed Practical Nurse
% of Days 100%
15 Medication Aide/Technician
% of Days 100%
6 Speech Language Pathologist
% of Days 76%
7 Physical Therapy Aide
% of Days 78%
4 Qualified Social Worker
% of Days 73%
2 RN Director of Nursing
% of Days 99%
2 Respiratory Therapy Technician
% of Days 73%
4 Physical Therapy Assistant
% of Days 71%
2 Clinical Nurse Specialist
% of Days 70%
1 Administrator
% of Days 70%
2 Mental Health Service Worker
% of Days 67%
2 Dietitian
% of Days 54%
1 Nurse Practitioner
% of Days 64%
1 Occupational Therapy Aide
% of Days 12%
1 Occupational Therapy Assistant
% of Days 9%
1 Medical Director
% of Days 17%

Penalties and fines

Includes penalties issued in 2023

Federal penalties imposed by CMS for regulatory violations, including civil money penalties (fines) and denials of payment for new Medicare/Medicaid admissions.

Source: CMS Penalties Database (Data as of Jan 2026)

Total fines amount $40K Rank #200 / 301Federal fines — State benchmarkedThis home is ranked 200th out of 301 homes in Texas. Shows this facility's cumulative CMS federal fine dollars versus the Texas average among facilities with fines, and where it ranks among 301 facilities in the pool. Lower total dollars mean a better rank.Rankings are based only on facilities in Texas that report data for that category. Facilities without available data are excluded from the ranking.Click the rank badge to see the full State ranking.Click here to see the full State ranking.
50% lower than Texas average

Texas average: $80K

Number of fines 2
20% fewer fines than Texas average

Texas average: 2.5

Payment Denials Info Serious action where Medicare and/or Medicaid temporarily stops payments for new residents until issues are fixed. 0
100% fewer payment denials than Texas average

Texas average: 0.2

Fines amount comparison
This facility $40K
Texas average $80K
Penalty History

Penalties are imposed by CMS for violations of federal nursing home regulations.

2 penalties in the past 3 years

Multiple penalties were reported in the last 3 years.

Civil Money Penalty Info Fines imposed for noncompliance, which can be assessed per day or per instance of violation. Dec 7, 2023
$10K
Civil Money Penalty Info Fines imposed for noncompliance, which can be assessed per day or per instance of violation. Jul 22, 2023
$30K

Last updated: Jan 2026

Quality of care over time

These measures show how residents usually do over time at this home, based on health outcomes and preventive care.

High-risk clinical events score Info A composite score based on pressure ulcers, falls with injury, weight loss, walking ability decline, and activities of daily living decline. 6.2
28% better than Texas average

Texas average: 8.6

Functional decline score Info A composite score based on activities of daily living decline, walking ability decline, and incontinence. 13.5
16% better than Texas average

Texas average: 16.0

Long-stay resident measures
Significantly above average Texas avg: 4.1 Info CMS star rating based on long-stay quality measure performance. 5 stars = significantly above average, 1 star = significantly below average.
Need for Help with Daily Activities Increased Info Percent of long-stay residents whose need for help with daily activities has increased 8.0%
50% better than Texas average

Texas average: 16.2%

Walking Ability Worsened Info Percent of long-stay residents whose ability to move independently worsened 11.0%
32% better than Texas average

Texas average: 16.2%

Low Risk Residents with Bowel/Bladder Incontinence Info Percent of low risk long-stay residents who lose control of their bowels or bladder 21.6%
38% worse than Texas average

Texas average: 15.7%

Falls with Major Injury Info Percent of long-stay residents experiencing one or more falls with major injury 1.1%
65% better than Texas average

Texas average: 3.2%

High Risk Residents with Pressure Ulcers Info Percent of long-stay high risk residents with pressure ulcers 7.4%
67% worse than Texas average

Texas average: 4.4%

Urinary Tract Infection Info Percent of long-stay residents with a urinary tract infection 0.0%
100% better than Texas average

Texas average: 0.8%

Lost Too Much Weight Info Percent of long-stay residents who lose too much weight 3.4%
In line with Texas average

Texas average: 3.5%

Depressive Symptoms Info Percent of long-stay residents who have depressive symptoms 0.0%
100% better than Texas average

Texas average: 2.9%

Antipsychotic Use Info Percent of long-stay residents who received an antipsychotic medication 4.0%
49% better than Texas average

Texas average: 7.9%

Pneumococcal Vaccine Info Percent of long-stay residents assessed and appropriately given the pneumococcal vaccine 100.0%
In line with Texas average

Texas average: 97.3%

Influenza Vaccine Info Percent of long-stay residents assessed and appropriately given the seasonal influenza vaccine 100.0%
In line with Texas average

Texas average: 97.9%

Short-stay resident measures
Pneumococcal Vaccine Info Percent of short-stay residents assessed and appropriately given the pneumococcal vaccine 97.0%
7% better than Texas average

Texas average: 90.4%

Antipsychotic medication increase Info Percent of short-stay residents who newly received an antipsychotic medication 3.4%
135% worse than Texas average

Texas average: 1.4%

Influenza Vaccine Info Percent of short-stay residents assessed and appropriately given the seasonal influenza vaccine 97.6%
11% better than Texas average

Texas average: 88.0%

Falls with major injury Info Percentage of SNF residents who experience falls with major injury during their stay. 0.0%
100% better than Texas average

Texas average: 0.8%

Ability to care for self at discharge Info Percentage of residents at or above expected ability to care for themselves at discharge. 55.0%
In line with Texas average

Texas average: 53.7%

Breakdown by payment type

Medicare

17% of new residents, usually for short-term rehab.

Typical stay 1 - 2 months

Private pay

47% of new residents, often for short stays.

Typical stay 2 - 3 months

Medicaid

37% of new residents, often for long-term daily care.

Typical stay 1 - 2 years

Facility Characteristics

Source: CMS Long-Term Care Facility Characteristics (Data as of Jan 2026)

Total residents 71
Medicare
1
1.4% of residents
Medicaid
48
67.6% of residents
Private pay or other
22
31% of residents
Programs & Services
Residents Group

Residents meet regularly to discuss policies, care quality, and activities

Active Resident Council

Organized group of residents that meets regularly to discuss facility policies, quality of life, and activities.

Finances and operations

Based on CMS SNF Cost Report for fiscal year ending in 12/2023.

Privately-owned community
Operated by a single business entity.
Net patient revenue Info Net patient revenue — what the home actually collects for resident care, after contractual allowances, bad debt and discounts are subtracted from its gross charges (CMS cost report, Worksheet G-3). It covers resident care only; money the home earns from other sources is shown separately as "Other income."
$4.8M
Net patient income Info Net patient income: net patient revenue minus the home's total operating expenses. A positive figure means it earns more from resident care than it spends to deliver it; a negative figure means the opposite. It excludes non-operating "other income."
-$4.1M
Privately-owned community Operated by a single business entity.
Net patient revenue Info Net patient revenue — what the home actually collects for resident care, after contractual allowances, bad debt and discounts are subtracted from its gross charges (CMS cost report, Worksheet G-3). It covers resident care only; money the home earns from other sources is shown separately as "Other income."
$4.8M Rank #188 / 304Revenue — State benchmarkedThis home is ranked 188th out of 304 homes in Texas. Shows this facility's annual revenue compared to the Texas average. Higher revenue generally means more resources for staffing and capital — read alongside Payroll %.Rankings are based only on facilities in Texas that report data for that category. Facilities without available data are excluded from the ranking.Click the rank badge to see the full State ranking.Click here to see the full State ranking.
Net patient income Info Net patient income: net patient revenue minus the home's total operating expenses. A positive figure means it earns more from resident care than it spends to deliver it; a negative figure means the opposite. It excludes non-operating "other income."
-$4.1M
Other income Info Money the home earns outside of resident care — such as investments, grants, rentals and other non-operating sources (CMS cost report, Worksheet G-3). It is tracked separately from net patient revenue: it is not part of that figure, and it is not included in net patient income.
$364.6K
Payroll costs Info Staff salaries plus wage-related costs — benefits such as payroll taxes, health insurance and retirement — from the home's own accounting records (CMS cost report, Worksheet A). Contract or agency labor is counted separately, under other operating costs. Rank #185 / 304Payroll — State benchmarkedThis home is ranked 185th out of 304 homes in Texas. Shows total annual staff payroll benchmarked to the Texas average. Higher payroll investment relative to peers often signals better staffing and less reliance on cheaper contract labor.Rankings are based only on facilities in Texas that report data for that category. Facilities without available data are excluded from the ranking.Click the rank badge to see the full State ranking.Click here to see the full State ranking.
$4.2M 86.8% of net patient revenue Info Payroll as a share of revenue: staff salaries and wage-related benefits divided by net patient revenue. A higher figure means more of each revenue dollar goes to staff pay. Rank #158 / 304Payroll % — State benchmarkedThis home is ranked 158th out of 304 homes in Texas. Shows payroll as a percentage of revenue versus the Texas average. Well-run Texas facilities typically land around 51–63% — the top third Statewide. Below 25% may signal understaffing or heavy agency use — read with Staffing ratings.Rankings are based only on facilities in Texas that report data for that category. Facilities without available data are excluded from the ranking.Click the rank badge to see the full State ranking.Click here to see the full State ranking.
Other operating costs Info Everything it costs to run the home apart from payroll — food, utilities, supplies, maintenance, contract labor and administration. Calculated as total operating expense minus payroll (staff salaries and wage-related benefits).
$4.8M
Total costs Info The home's total operating expense for the year — all the costs of running it, salaries included (CMS cost report, Worksheet G-3).
$9.0M

Who this home usually serves

TYPE OF STAY

Mostly long-term care residents

Most residents stay for extended periods and receive ongoing daily care.

New residents most often arrive under private pay (47% of admissions), and a typical private pay stay runs around 2 - 3 months.

Admissions
120 total

Coverage residents most often arrive under.

Medicare 17%
Private pay 47%
Medicaid 37%
Discharges
172 total

Coverage residents most often leave under.

Medicare 7%
Private pay 40%
Medicaid 53%

Places of interest near Winters Park Nursing and Rehabilitation Center

Address 3.2 miles from city center Info Estimated distance in miles from Garland's city center to Winters Park Nursing and Rehabilitation Center's address, calculated via Google Maps.

Calculate Travel Distance to Winters Park Nursing and Rehabilitation Center

Add your location

Address

Compare Nursing Homes around Garland

The information below is reported by the Texas Health and Human Services Commission.

5 facilities compared · CMS & TX Dept. of Health data

Winters Park Nursing and Rehabilitation Center
NH
HC
MC
PC
RC
Garland
132
Facility 132
TX AVG 80
Rank #121 / 988
55.1%
Facility 55.1%
TX AVG 63.5%
Rank #228 / 304
-13%
3.83
Facility 3.83
TX AVG 3.63
Rank #93 / 296
-19%+6%
$40.1k
Facility $40.1k
TX AVG $81.8k
Rank #200 / 301
19
Facility 19
TX AVG 25.9
Rank #126 / 299
2.1
Facility 2.1
TX AVG 3.7
Rank #35 / 299
490-
49
Facility 49
TX AVG 41
Rank #543 / 1391
Musaab Zaid
$4.8M
Facility $4.8M
TX AVG $8.4M
Rank #188 / 304
$4.2M
Facility $4.2M
TX AVG $3.5M
Rank #185 / 304
86.8%
Facility 86.8%
TX AVG 47%
Rank #158 / 304
676039
Legend Oaks Healthcare & Rehabilitation
NH
Garland
132
Facility 132
TX AVG 80
Rank #121 / 988
53.8%
Facility 53.8%
TX AVG 63.5%
Rank #234 / 304
-15%
3.50
Facility 3.50
TX AVG 3.63
Rank #146 / 296
-10%-4%
$0
Facility $0
TX AVG $81.8k
Rank #1 / 301
30
Facility 30
TX AVG 25.9
Rank #218 / 299
3.3
Facility 3.3
TX AVG 3.7
Rank #152 / 299
271-
54
Facility 54
TX AVG 41
Rank #409 / 1391
Duck Creek Healthcare, Inc
$9.7M
Facility $9.7M
TX AVG $8.4M
Rank #103 / 304
$5.3M
Facility $5.3M
TX AVG $3.5M
Rank #125 / 304
54.6%
Facility 54.6%
TX AVG 47%
Rank #204 / 304
676413
Pleasant Valley Healthcare Rehabilitation Center
NH
Garland
124
Facility 124
TX AVG 80
Rank #178 / 988
52.0%
Facility 52.0%
TX AVG 63.5%
Rank #242 / 304
-18%
3.58
Facility 3.58
TX AVG 3.63
Rank #128 / 296
-12%-1%
$53.4k
Facility $53.4k
TX AVG $81.8k
Rank #210 / 301
24
Facility 24
TX AVG 25.9
Rank #178 / 299
2.7
Facility 2.7
TX AVG 3.7
Rank #83 / 299
376-
44
Facility 44
TX AVG 41
Rank #647 / 1391
Primrose Healthcare, Inc
$8.5M
Facility $8.5M
TX AVG $8.4M
Rank #125 / 304
$5.3M
Facility $5.3M
TX AVG $3.5M
Rank #136 / 304
62.4%
Facility 62.4%
TX AVG 47%
Rank #183 / 304
675305
Advanced Health and Rehabilitation Center of Garland
NH
HC
MC
RC
Garland
139
Facility 139
TX AVG 80
Rank #93 / 988
27.3%
Facility 27.3%
TX AVG 63.5%
Rank #287 / 304
-57%
3.90
Facility 3.90
TX AVG 3.63
Rank #81 / 296
-31%+7%
$237.2k
Facility $237.2k
TX AVG $81.8k
Rank #288 / 301
27
Facility 27
TX AVG 25.9
Rank #207 / 299
3.4
Facility 3.4
TX AVG 3.7
Rank #168 / 299
238-
51
Facility 51
TX AVG 41
Rank #483 / 1391
Garland Hc LLC
$10.3M
Facility $10.3M
TX AVG $8.4M
Rank #55 / 304
$552.3k
Facility $552.3k
TX AVG $3.5M
Rank #193 / 304
5.3%
Facility 5.3%
TX AVG 47%
Rank #299 / 304
455731
Garland Nursing & Rehabilitation Center
NH
Garland
109
Facility 109
TX AVG 80
Rank #315 / 988
56.4%
Facility 56.4%
TX AVG 63.5%
Rank #221 / 304
-11%
3.17
Facility 3.17
TX AVG 3.63
Rank #222 / 296
+31%-13%
$81.6k
Facility $81.6k
TX AVG $81.8k
Rank #243 / 301
42
Facility 42
TX AVG 25.9
Rank #259 / 299
3.0
Facility 3.0
TX AVG 3.7
Rank #120 / 299
776-
52
Facility 52
TX AVG 41
Rank #457 / 1391
Slp Garland, LLC
$5.4M
Facility $5.4M
TX AVG $8.4M
Rank #245 / 304
$3.4M
Facility $3.4M
TX AVG $3.5M
Rank #250 / 304
62.3%
Facility 62.3%
TX AVG 47%
Rank #170 / 304
675790

Financial Assistance for
Nursing Home in Texas

Winters Park Nursing and Rehabilitation Center is located in Garland, Texas.
Here are the financial assistance programs available to residents in Texas.

Get Financial aid guidance

Community Care for the Aged and Disabled (CCAD)

TX Medicaid CCAD

Age 65+ or disabled
General Texas resident, Medicaid-eligible, care need (not always nursing home level).
Income Limits (2025) ~$2,829/month 300% FBR, individual
Asset Limits $2,000 (individual), $3,000 (couple).
TX

Large state; rural access challenges.

Benefits
Personal care (5-7 hours/day) Respite (240 hours/year) Adult day care (~$60/day) Home aides

Texas Community Care Services

TX CCS

Age 60+
General Texas resident, at risk of decline.
Income Limits ~$2,000/month individual, varies
Asset Limits $5,000 individual
TX

Limited funding; high demand in urban areas.

Benefits
In-home care (3-5 hours/week) Respite (up to 10 days/year) Transportation (~5 trips/month)

Area Agency on Aging (AAA) Services

Texas AAA Services

Age 60+
General TX resident; no income/asset limits.
Income Limits (2025) None; donations encouraged.
Asset Limits Not assessed.
TX

28 AAAs; includes Meals on Wheels in some areas.

Benefits
Meals (~$5-$7/meal) Transportation Homemaker services (~4 hours/week) Respite (~5 days/year) Legal aid

Medicare Savings Program (MSP)

Texas Medicare Savings Program

Age 65+ or disabled
General TX resident, Medicare Part A/B.
Income Limits (2025) ~$2,510/month (QMB), ~$3,380/month (SLMB), ~$3,598/month (QI)—individual.
Asset Limits $9,430 (individual), $14,130 (couple).
TX

Includes Extra Help for Part D; no waitlist.

Benefits
Covers Part B premiums ($174.70/month) Deductibles ($240/year) Copays (~20%)

Family Caregiver Support Program (FCSP)

Texas Family Caregiver Support Program

Age
General Caregivers of 60+ needing care or 55+ caregivers of others; TX resident; 2+ ADLs.
Income Limits (2025) No strict cap; prioritizes low-income ~$24,980/year
Asset Limits Not assessed.
TX

High rural demand; includes grandparent caregivers.

Benefits
Respite (4-6 hours/week or 5 days/year) Adult day care ($60/day) Training Supplies (~$500/year)

VA Aid and Attendance (A&A) and Housebound Benefits

Texas VA Aid and Attendance/Housebound

Age 65+ or disabled veteran/spouse
General TX resident, wartime service, ADL help (A&A) or homebound.
Income Limits (2025) Net income < ~$1,984/month (veteran with dependent, A&A); pension offsets income.
Asset Limits ~$155,356 net worth
TX

High veteran population; supports rural/urban needs.

Benefits
Cash (~$1,433-$2,642/month veteran, ~$951-$1,318 spouse) for care costs

Property Tax Exemption for Seniors

Texas Senior Property Tax Exemption

Age 65+
General TX resident, homeowner (homestead).
Income Limits (2025) None; tax-based eligibility.
Asset Limits Not assessed.
TX

$25,000+ exemption; optional freeze in some counties; saves ~$500-$1,000/year.

Benefits
Tax exemption or freeze (~$500-$1,000/year savings)

Senior Farmers’ Market Nutrition Program (SFMNP)

Texas SFMNP

Age 60+
General TX resident, low-income.
Income Limits (2025) ~$2,322/month 185% FPL
Asset Limits Not assessed.
TX

Vouchers (~$50/season); serves ~20,000 via 28 AAAs.

Benefits
Vouchers (~$50/season) for produce at farmers’ markets

Frequently Asked Questions about Winters Park Nursing and Rehabilitation Center

Is Winters Park Nursing and Rehabilitation Center in a walkable area?

Winters Park Nursing and Rehabilitation Center has a walk score of 49. Somewhat walkable. A few nearby services may be reachable on foot, but most trips require transportation.

What is the occupancy rate at Winters Park Nursing and Rehabilitation Center?

Winters Park Nursing and Rehabilitation Center's occupancy is 55.1%.

Are there photos of Winters Park Nursing and Rehabilitation Center?

Yes — there are 6 photos of Winters Park Nursing and Rehabilitation Center in the photo gallery on this page.

What is the address of Winters Park Nursing and Rehabilitation Center?

Winters Park Nursing and Rehabilitation Center is located at 3737 N Garland Ave, Garland, TX 75040.

What is the phone number of Winters Park Nursing and Rehabilitation Center?

(972) 495-7000 will put you in contact with the team at Winters Park Nursing and Rehabilitation Center.

Is Winters Park Nursing and Rehabilitation Center Medicare or Medicaid certified?

Yes — Winters Park Nursing and Rehabilitation Center is a CMS-certified provider of Medicare and Medicaid.

Guides for Better Senior Living

Care Cost Calculator: See Prices in Your Area

Nursing Home Data Explorer

Don’t Wait Too Long: 7 Red Flag Signs Your Parent Needs Assisted Living Now

The True Cost of Assisted Living in 2025 – And How Families Are Paying For It

Understanding Senior Living Costs: Pricing Models, Discounts & Financial Assistance