Life Care Center of Bountiful
Nursing Home · Salt Lake City, UT
CMS overall rating Info The Overall CMS Rating is scored from 1 to 5 stars and combines results from health inspections, staffing levels, and quality measures. Health inspections carry the most weight. Staffing and quality scores can increase or decrease the final rating based on performance compared to state and national standards.

Life Care Center of Bountiful

Nursing Home · Salt Lake City, UT
CMS overall rating Info The Overall CMS Rating is scored from 1 to 5 stars and combines results from health inspections, staffing levels, and quality measures. Health inspections carry the most weight. Staffing and quality scores can increase or decrease the final rating based on performance compared to state and national standards.
Calculator: See prices in your area
Life Care Center of Bountiful accepts Medicare, Medicaid, and private pay.

Overview of Life Care Center of Bountiful

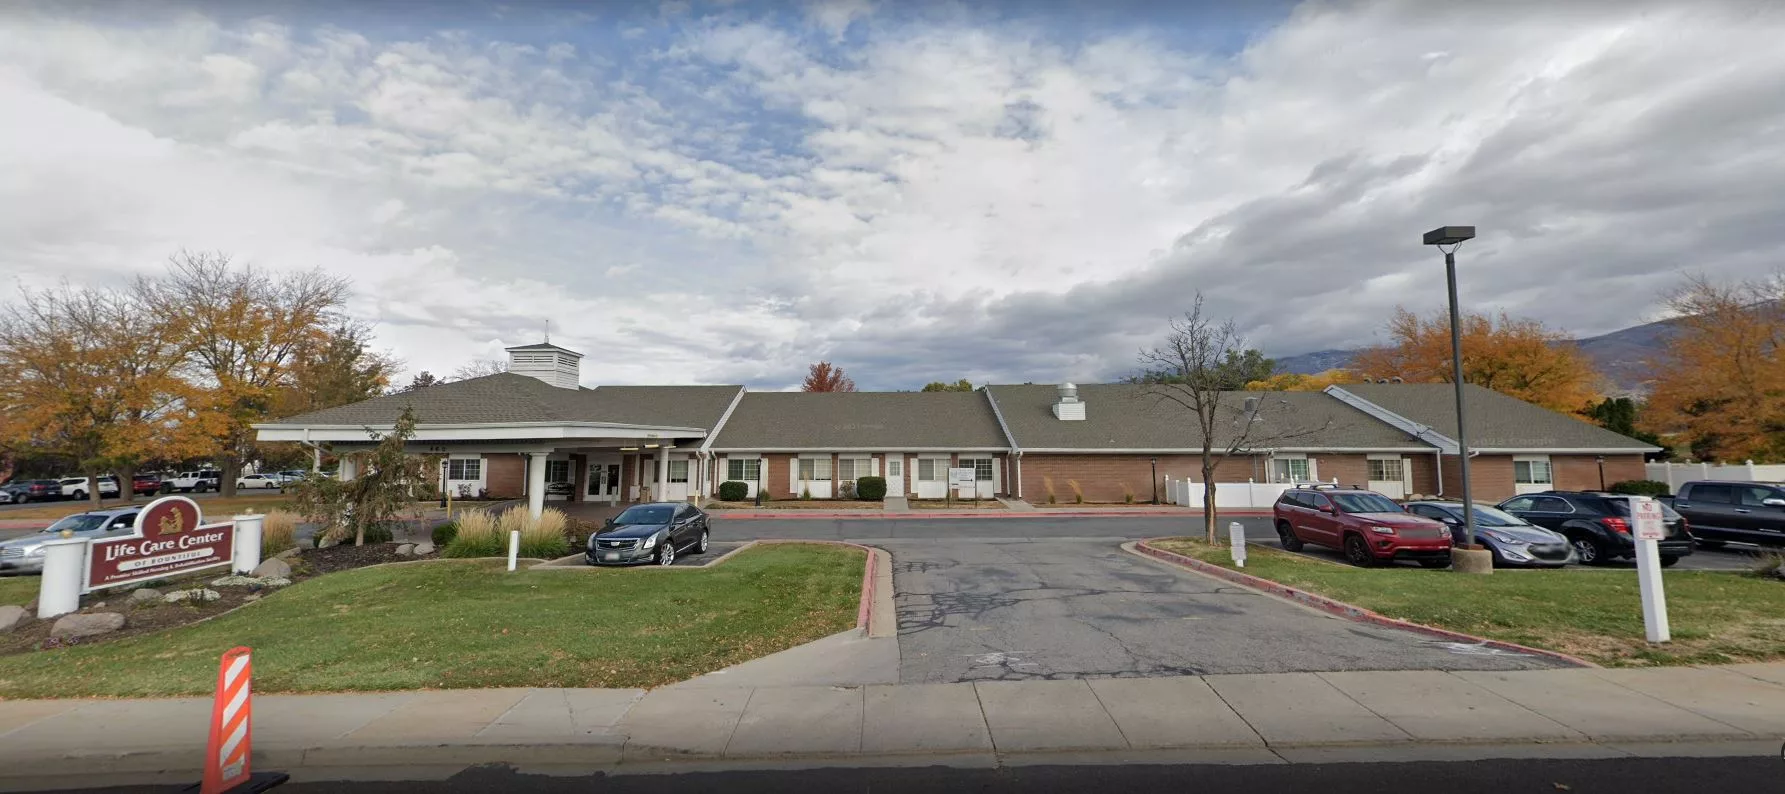
Life Care Center of Bountiful offers a wide range of skilled nursing and rehabilitation services. Whether it’s short-term rehab, long-term care, or post-operative recovery, residents can trust that they are in good hands. One of the best features of Life Care Center of Bountiful is its team of dedicated physical, speech, and occupational therapists who work tirelessly to provide personalized care to residents. With a certified dietitian on staff, residents’ nutritional needs are well taken care of, ensuring optimal health and well-being.
The home also has a unique cocooning ambiance. Residents can enjoy a serene library and on-site coffee shop, or relax in the peaceful courtyard. Flat-screen TVs provide entertainment, and housekeeping and laundry services ensure a comfortable and tidy living environment. With a strict non-smoking policy, Life Care Center of Bountiful prioritizes the health and well-being of its residents. The facility also offers flexible visiting hours, encouraging family and friends to maintain connections with their loved ones during their stay.

(801) 295-3135

Quality ratings

Measured by Centers for Medicare & Medicaid Services (CMS)

Overall rating Info The Overall CMS Rating combines results from health inspections, staffing levels and quality measures. Health inspections carry the most weight. Staffing and quality scores can increase or decrease the final rating based on performance compared to state and national standards.
▼ 40.3% Below UT avg. ▼ 40.3% Below UT avg.Click the badge to see the full State ranking.Click here to see the full State ranking.
Health Inspection Info Based on the results of the facility's three most recent standard inspections and any complaint investigations. CMS reviews the number, scope, and severity of deficiencies, with more recent findings weighted more heavily.
▼ 28.1% Below UT avg. ▼ 28.1% Below UT avg.Click the badge to see the full State ranking.Click here to see the full State ranking.
Staffing Info Measures average nursing staff hours per resident per day, including Registered Nurses (RNs) and total nursing staff. Ratings are adjusted based on the level of care residents require and are compared to state and national benchmarks.
▼ 67.6% Below UT avg. ▼ 67.6% Below UT avg.Click the badge to see the full State ranking.Click here to see the full State ranking.
Quality Measures Info Based on clinical and physical health indicators reported to CMS, such as hospital readmissions, falls, pressure ulcers, and improvements in mobility. These measures reflect how well residents' health needs are being managed.
▲ 14.9% Above UT avg. ▲ 14.9% Above UT avg.Click the badge to see the full State ranking.Click here to see the full State ranking.

Staffing hours breakdown

Info Daily nursing hours per resident by staff type, reported to CMS. Higher is generally better — compare this facility to state and national averages to see where staffing stands.

Hours per resident per day — compared to Utah state averages

Total nursing care / resident Info This home is ranked 59th out of 66 homes in Utah. Total adjusted nursing hours per resident per day, combining RN, LPN, and aide time. CMS adjusts this for case-mix so facilities can be fairly compared.
2h 55m per day
Rank #59 / 66Nurse hours — State benchmarkedThis home is ranked 59th out of 66 homes in Utah. Shows adjusted nurse hours per resident per day benchmarked to the Utah average, with a ranking across 66 Utah SNFs. More hours mean more direct care. The national average is about 3.5 hrs; below 3.0 is a red flag.Click the rank badge to see the full State ranking.Click here to see the full State ranking.
This facility Utah avg (3h 43m per day)
vs Utah avg
-21%

5 of 6 metrics below state avg

Standout metric LPN / LVN is +63% above state avg
Staff typeHours / Day / Residentvs state avg
Registered Nurse (RN) Info RNs hold the highest nursing license and can assess residents, interpret test results, and direct care plans. More RN hours per day often signals stronger clinical oversight and faster response to health changes. 42m per day ▼ 41% State avg: 1h 11m per day · National avg: 41m per day
LPN / LVN Info Licensed Practical Nurses (LPNs) or Licensed Vocational Nurses (LVNs) deliver routine hands-on care — medication administration, wound dressing, and monitoring vital signs. They work under RN supervision and make up a large share of daily bedside care. 49m per day ▲ 63% State avg: 30m per day · National avg: 52m per day
Nurse Aide Info Certified Nurse Aides (CNAs) provide the most direct day-to-day assistance: bathing, dressing, feeding, and mobility. Nurse aide hours are typically the largest staffing category and directly affect residents' quality of life. 2h 0m per day ▼ 15% State avg: 2h 22m per day · National avg: 2h 21m per day
Total Nursing (Weekend) Info Combined nursing hours (RN + LPN + Nurse Aide) per resident per day on weekends. Staffing often drops on weekends — this figure reveals whether the facility maintains adequate coverage outside of weekday hours. 2h 48m per day ▼ 20% State avg: 3h 31m per day · National avg: 3h 26m per day
Physical Therapist Info Hours per resident per day provided by licensed Physical Therapists (PTs) or PT Assistants. PT services help residents recover mobility after injury or illness and are especially important for post-acute (short-stay) rehabilitation. 2m per day ▼ 71% State avg: 7m per day · National avg: 4m per day
RN (Weekend) Info Registered nurse hours specifically on weekends. Facilities sometimes reduce RN presence on Saturdays and Sundays — a low weekend RN figure compared to weekday hours can indicate reduced clinical oversight when most administrative staff are absent. 33m per day ▼ 34% State avg: 50m per day · National avg: 29m per day

Capacity and availability

This home usually has availability

Occupancy lower than 85% suggests more openings may be available.

Lower occupancy than the Utah average: 70.1%
Occupancy rate 44.4% Rank #55 / 62Occupancy rate — State benchmarkedThis home is ranked 55th out of 62 homes in Utah. Shows this facility's occupancy rate versus the Utah average, with its Statewide rank out of 62. Higher occupancy signals strong local demand and financial stability.Click the rank badge to see the full State ranking.Click here to see the full State ranking.
Avg. Length of Stay 78 days
Occupancy rate
44.4% Rank #55 / 62Occupancy rate — State benchmarkedThis home is ranked 55th out of 62 homes in Utah. Shows this facility's occupancy rate versus the Utah average, with its Statewide rank out of 62. Higher occupancy signals strong local demand and financial stability.Click the rank badge to see the full State ranking.Click here to see the full State ranking.
Avg. Length of Stay
78 days
Walk Score
Walk Score: 62 / 100 Rank #30 / 67Walk Score — State benchmarkedThis home is ranked 30th out of 67 homes in Utah. Shows how walkable this facility's neighborhood is compared to the average Walk Score across Utah SNFs. Higher scores benefit residents, families, and staff.Click the rank badge to see the full State ranking.Click here to see the full State ranking.
Moderately walkable. Some errands can be accomplished on foot, with a mix of nearby amenities.

Contact Life Care Center of Bountiful

Staffing Data

Reporting period: April 1 – June 30, 2025 (Q2 2025). Source: CMS Payroll-Based Journal report.

Total staff 126
Employees 109
Contractors 17
Staff to resident ratio 2.80:1
32% better than Utah average
Utah average ratio: 2.12:1 Utah average ratio: 2.12:1See full Utah ranking
Avg staff/day 35
Average shift 7.8 hours
0% compared with Utah average
Utah average: 7.9 hours Utah average shift: 7.9 hoursSee full Utah ranking
Total staff hours (quarter) 24,721

Nursing staff breakdown

Q2 2025 · Apr 1 – Jun 30 More info This data comes from the CMS Payroll-Based Journal report covering April 1 – June 30, 2025.
Registered Nurse

Manages medical care and health needs.

Total count 17
Average shift length Info Average shift length. Calculated as total hours divided by days worked and average staff per day. 8.8 hours

No contractors work on this role.

Licensed Practical Nurse

Assists with medical care and medications.

Total count 16
Average shift length Info Average shift length. Calculated as total hours divided by days worked and average staff per day. 9 hours

No contractors work on this role.

Certified Nursing Assistant

Helps with daily care and mobility.

Total count 61
Average shift length Info Average shift length. Calculated as total hours divided by days worked and average staff per day. 7.6 hours

No contractors work on this role.

Contractor staffing

Q2 2025 · Apr 1 – Jun 30 More info This data comes from the CMS Payroll-Based Journal report covering April 1 – June 30, 2025.

Total hours from contractors

7.6%

1,889 contractor hours this quarter

Speech Language Pathologist: 4 Qualified Social Worker: 3 Physical Therapy Aide: 3 Physical Therapy Assistant: 2 Respiratory Therapy Technician: 2 Medical Director: 1 Occupational Therapy Aide: 1 Occupational Therapy Assistant: 1

Staff by category

Q2 2025 · Apr 1 – Jun 30 More info This data comes from the CMS Payroll-Based Journal report covering April 1 – June 30, 2025.
Certified Nursing Assistant6106111,50691100%7.6
Licensed Practical Nurse160163,82691100%9
Registered Nurse170173,79291100%8.8
Clinical Nurse Specialist3037046470%7.8
Nurse Practitioner2026566470%8
Administrator1015126470%8
Dietitian1015126470%8
Speech Language Pathologist0445006673%5.8
Other Dietary Services Staff1015006774%7.5
RN Director of Nursing1014725965%8
Qualified Social Worker0334236369%6.5
Physical Therapy Assistant0224156470%6.5
Dental Services Staff3032843538%7.4
Respiratory Therapy Technician0221795662%2.9
Physical Therapy Aide0331614549%3.6
Occupational Therapy Aide0111043033%3.5
Medical Director011911314%7
Nurse Aide in Training303701213%5.8
Occupational Therapy Assistant0111622%8.2
61 Certified Nursing Assistant
% of Days 100%
16 Licensed Practical Nurse
% of Days 100%
17 Registered Nurse
% of Days 100%
3 Clinical Nurse Specialist
% of Days 70%
2 Nurse Practitioner
% of Days 70%
1 Administrator
% of Days 70%
1 Dietitian
% of Days 70%
4 Speech Language Pathologist
% of Days 73%
1 Other Dietary Services Staff
% of Days 74%
1 RN Director of Nursing
% of Days 65%
3 Qualified Social Worker
% of Days 69%
2 Physical Therapy Assistant
% of Days 70%
3 Dental Services Staff
% of Days 38%
2 Respiratory Therapy Technician
% of Days 62%
3 Physical Therapy Aide
% of Days 49%
1 Occupational Therapy Aide
% of Days 33%
1 Medical Director
% of Days 14%
3 Nurse Aide in Training
% of Days 13%
1 Occupational Therapy Assistant
% of Days 2%

Penalties and fines

Includes penalties issued in 2024-2025

Federal penalties imposed by CMS for regulatory violations, including civil money penalties (fines) and denials of payment for new Medicare/Medicaid admissions.

Source: CMS Penalties Database (Data as of Jan 2026)

Total fines amount $34K Rank #50 / 66Federal fines — State benchmarkedThis home is ranked 50th out of 66 homes in Utah. Shows this facility's cumulative CMS federal fine dollars versus the Utah average among facilities with fines, and where it ranks among 66 skilled nursing facilities in the pool. Lower total dollars mean a better rank.Click the rank badge to see the full State ranking.Click here to see the full State ranking.
36% lower than Utah average

Utah average: $53K

Number of fines 3
55% more fines than Utah average

Utah average: 1.9

Payment Denials Info Serious action where Medicare and/or Medicaid temporarily stops payments for new residents until issues are fixed. 0
100% fewer payment denials than Utah average

Utah average: 0.3

Fines amount comparison
This facility $34K
Utah average $53K
Penalty History

Penalties are imposed by CMS for violations of federal nursing home regulations.

2 penalties in the past 3 years

Multiple penalties were reported in the last 3 years.

Civil Money Penalty Info Fines imposed for noncompliance, which can be assessed per day or per instance of violation. Jun 9, 2025
$17K
Civil Money Penalty Info Fines imposed for noncompliance, which can be assessed per day or per instance of violation. Dec 18, 2024
$14K

Last updated: Jan 2026

Quality of care over time

These measures show how residents usually do over time at this home, based on health outcomes and preventive care.

High-risk clinical events score Info A composite score based on pressure ulcers, falls with injury, weight loss, walking ability decline, and activities of daily living decline. 11.7
25% worse than Utah average

Utah average: 9.3

Functional decline score Info A composite score based on activities of daily living decline, walking ability decline, and incontinence. 22.6
12% worse than Utah average

Utah average: 20.1

Long-stay resident measures
Significantly above average Utah avg: 4.0 Info CMS star rating based on long-stay quality measure performance. 5 stars = significantly above average, 1 star = significantly below average.
Need for Help with Daily Activities Increased Info Percent of long-stay residents whose need for help with daily activities has increased 16.0%
In line with Utah average

Utah average: 15.7%

Walking Ability Worsened Info Percent of long-stay residents whose ability to move independently worsened 29.7%
40% worse than Utah average

Utah average: 21.3%

Low Risk Residents with Bowel/Bladder Incontinence Info Percent of low risk long-stay residents who lose control of their bowels or bladder 21.9%
5% better than Utah average

Utah average: 23.1%

Falls with Major Injury Info Percent of long-stay residents experiencing one or more falls with major injury 1.1%
58% better than Utah average

Utah average: 2.6%

High Risk Residents with Pressure Ulcers Info Percent of long-stay high risk residents with pressure ulcers 7.9%
88% worse than Utah average

Utah average: 4.2%

Urinary Tract Infection Info Percent of long-stay residents with a urinary tract infection 2.3%
10% worse than Utah average

Utah average: 2.1%

Lost Too Much Weight Info Percent of long-stay residents who lose too much weight 3.5%
15% better than Utah average

Utah average: 4.1%

Depressive Symptoms Info Percent of long-stay residents who have depressive symptoms 12.0%
27% better than Utah average

Utah average: 16.5%

Antipsychotic Use Info Percent of long-stay residents who received an antipsychotic medication 2.5%
81% better than Utah average

Utah average: 13.5%

Pneumococcal Vaccine Info Percent of long-stay residents assessed and appropriately given the pneumococcal vaccine 98.9%
In line with Utah average

Utah average: 97.1%

Influenza Vaccine Info Percent of long-stay residents assessed and appropriately given the seasonal influenza vaccine 94.1%
In line with Utah average

Utah average: 98.0%

Hospitalizations per 1,000 days Info Number of hospitalizations per 1,000 long-stay resident days. 0.81
32% better than Utah average

Utah average: 1.19

ED visits per 1,000 days Info Number of outpatient emergency department visits per 1,000 long-stay resident days. 1.21
19% better than Utah average

Utah average: 1.50

Short-stay resident measures
Significantly above average Utah avg: 3.3 Info CMS star rating based on short-stay quality measure performance. 5 stars = much above average, 1 star = much below average.
Pneumococcal Vaccine Info Percent of short-stay residents assessed and appropriately given the pneumococcal vaccine 98.2%
6% better than Utah average

Utah average: 92.9%

Antipsychotic medication increase Info Percent of short-stay residents who newly received an antipsychotic medication 1.4%
31% worse than Utah average

Utah average: 1.1%

Influenza Vaccine Info Percent of short-stay residents assessed and appropriately given the seasonal influenza vaccine 76.1%
16% worse than Utah average

Utah average: 91.0%

Re-hospitalized after SNF stay Info Percentage of short-stay residents who were re-hospitalized after their nursing home admission. 9.1%
48% better than Utah average

Utah average: 17.4%

Emergency department visits Info Percentage of short-stay residents who had an outpatient emergency department visit. 8.8%
25% better than Utah average

Utah average: 11.8%

Falls with major injury Info Percentage of SNF residents who experience falls with major injury during their stay. 0.0%
100% better than Utah average

Utah average: 0.8%

Ability to care for self at discharge Info Percentage of residents at or above expected ability to care for themselves at discharge. 48.9%
9% worse than Utah average

Utah average: 53.7%

Successful return to home or community Info Rate of successful return to home or community from a skilled nursing facility. 67.6%
34% better than Utah average

Utah average: 50.6%

Breakdown by payment type

Medicare

41% of new residents, usually for short-term rehab.

Typical stay 1 - 2 months

Private pay

50% of new residents, often for short stays.

Typical stay 1 - 2 months

Medicaid

9% of new residents, often for long-term daily care.

Typical stay 1 years

Facility Characteristics

Source: CMS Long-Term Care Facility Characteristics (Data as of Jan 2026)

Total residents 45
Medicare
3
6.7% of residents
Medicaid
33
73.3% of residents
Private pay or other
9
20% of residents
Programs & Services
Residents Group

Residents meet regularly to discuss policies, care quality, and activities

Nurse Aide Training

State-approved Nurse Aide Training and Competency Evaluation Program on-site

Active Resident Council

Organized group of residents that meets regularly to discuss facility policies, quality of life, and activities.

Finances and operations

Privately-owned community
Home revenue
$7.7M
Operating loss
-$1.1M
Privately-owned community
Home revenue
$7.7M Rank #37 / 63Revenue — State benchmarkedThis home is ranked 37th out of 63 homes in Utah. Shows this facility's annual revenue compared to the Utah SNF average. Higher revenue generally means more resources for staffing and capital — read alongside Payroll %.Click the rank badge to see the full State ranking.Click here to see the full State ranking.
Operating loss
-$1.1M
Payroll costs Info The portion of the home's budget spent on staff, including nurses, caregivers, and other employees who support care and operations. Rank #29 / 63Payroll — State benchmarkedThis home is ranked 29th out of 63 homes in Utah. Shows total annual staff payroll benchmarked to the Utah average. Higher payroll investment relative to peers often signals better staffing and less reliance on cheaper contract labor.Click the rank badge to see the full State ranking.Click here to see the full State ranking.
$4.4M
57.8% of revenue Rank #6 / 63Payroll % — State benchmarkedThis home is ranked 6th out of 63 homes in Utah. Shows payroll as a percentage of revenue versus the Utah average. Well-run Utah SNFs typically land around 52–58% — the top third Statewide. Below 25% may signal understaffing or heavy agency use — read with Staffing ratings.Click the rank badge to see the full State ranking.Click here to see the full State ranking.
Other operating costs Info All remaining costs needed to run the home, such as food, utilities, building maintenance, supplies and administrative expenses.
$4.4M
Total costs $8.8M

Who this home usually serves

TYPE OF STAY

Mix of rehab and long-term care

This home supports both short-term rehab and long-term care, with residents staying for a wide range of durations.

Places of interest near Life Care Center of Bountiful

Address 0.6 miles from city center Info Estimated distance in miles from Woods Cross's city center to Life Care Center of Bountiful's address, calculated via Google Maps. — 2.02 miles to nearest hospital (Lakeview Hospital)

Calculate Travel Distance to Life Care Center of Bountiful

Add your location

Address

Financial Assistance for
Nursing Home in Utah

Life Care Center of Bountiful is located in Woods Cross, Utah.
Here are the financial assistance programs available to residents in Utah.

Get Financial aid guidance

Aging Waiver

UT Medicaid Aging Waiver

Age 65+
General Utah resident, Medicaid-eligible, nursing home-level care need.
Income Limits (2025) ~$2,829/month 300% FBR, individual
Asset Limits $2,000 (individual), $3,000 (couple).
UT

Rural challenges; waitlists possible.

Benefits
Personal care (5-7 hours/day) Respite (240 hours/year) Adult day care ($65/day) Home modifications ($1,500 avg.)

Utah Alternatives Program

UT Alternatives

Age 60+
General Utah resident, at risk of nursing home.
Income Limits ~$2,000/month individual, varies
Asset Limits $5,000 individual
UT

Limited funding; rural focus.

Benefits
In-home care (3-5 hours/week) Respite (up to 10 days/year) Transportation (~5 trips/month)

Older Americans Act (OAA) Services

Utah OAA Services

Age 60+
General UT resident; no income/asset limits.
Income Limits (2025) None; donations encouraged.
Asset Limits Not assessed.
UT

12 AAAs; includes Meals on Wheels; rural emphasis.

Benefits
Meals (~$5-$7/meal) Transportation Homemaker services (~4 hours/week) Respite (5 days/year) Legal aid

Medicare Savings Program (MSP)

Utah Medicare Savings Program

Age 65+ or disabled
General UT resident, Medicare Part A/B.
Income Limits (2025) ~$2,510/month (QMB), ~$3,380/month (SLMB), ~$3,598/month (QI)—individual.
Asset Limits $9,430 (individual), $14,130 (couple).
UT

Includes Extra Help for Part D; no waitlist.

Benefits
Covers Part B premiums ($174.70/month) Deductibles ($240/year) Copays (~20%)

Home Energy Assistance Target (HEAT) Program

Utah HEAT Program

Age 60+ prioritized
General UT resident, low-income household.
Income Limits (2025) ~$3,970/month 185% FPL
Asset Limits Not assessed.
UT

Covers gas, electric, propane; emergency aid available.

Benefits
Heating/cooling aid ($300-$1,000/season) Crisis aid ($500 max)

Utah Caregiver Support Program

Utah Family Caregiver Support Program (FCSP)

Age
General Caregivers of 60+ needing care or 55+ caregivers of others; UT resident; 2+ ADLs.
Income Limits (2025) No strict cap; prioritizes low-income ~$24,980/year
Asset Limits Not assessed.
UT

Includes grandparent caregivers; serves ~1,500 annually.

Benefits
Respite (4-6 hours/week or 5 days/year) Adult day care ($60/day) Training Supplies (~$500/year)

VA Aid and Attendance (A&A) and Housebound Benefits

Utah VA Aid and Attendance/Housebound

Age 65+ or disabled veteran/spouse
General UT resident, wartime service, ADL help (A&A) or homebound.
Income Limits (2025) Net income < ~$1,984/month (veteran with dependent, A&A); pension offsets income.
Asset Limits ~$155,356 net worth
UT

Supports rural veterans; high demand near VA centers.

Benefits
Cash (~$1,433-$2,642/month veteran, ~$951-$1,318 spouse) for care costs

Property Tax Abatement and Deferral Programs

Utah Circuit Breaker and Deferral Programs

Age 66+ (abatement) or 75+ (deferral)
General UT resident 10+ months/year, homeowner.
Income Limits (2025) ~$40,000/year (household, abatement); no limit for deferral.
Asset Limits Not assessed; home value < ~$500,000 typical.
UT

Abatement up to $1,200; deferral accrues interest (2.5%-5%).

Benefits
Tax relief (~$500-$1,200/year) or deferral (postpones payment)

Senior Farmers’ Market Nutrition Program (SFMNP)

Utah SFMNP

Age 60+
General UT resident, low-income.
Income Limits (2025) ~$2,322/month 185% FPL
Asset Limits Not assessed.
UT

Vouchers (~$50/season); serves ~5,000 via 12 AAAs.

Benefits
Vouchers (~$50/season) for produce at farmers’ markets

Compare Nursing Home around Salt Lake City

The information below is reported by the Utah Department of Health and Human Services, Health Facility Licensing.

3 facilities compared · CMS & UT Dept. of Health data

Filter by care type
City Creek Post Acute
NH

Nursing Home Licensed facility providing 24/7 skilled nursing care for residents with complex, ongoing medical needs. Staffed by RNs, LPNs, and CNAs. Inspected and star-rated annually by CMS. Accepts Medicare (short-term rehab) and Medicaid (long-term care).

AL

Assisted Living A licensed, long-term care setting for seniors or individuals with disabilities who need help with daily activities — like bathing, dressing, and medication management — but not 24-hour skilled nursing. Offers housing, meals, and around-the-clock support while aiming to maximize resident independence.

Salt Lake City (East Central)108 70.8% +1%3.79 -36%+2%$0186.0267- 75 Avenues Healthcare, Inc.$7.5M$4.9M66.2%465072
Holladay Healthcare Center
NH

Nursing Home Licensed facility providing 24/7 skilled nursing care for residents with complex, ongoing medical needs. Staffed by RNs, LPNs, and CNAs. Inspected and star-rated annually by CMS. Accepts Medicare (short-term rehab) and Medicaid (long-term care).

AL

Assisted Living A licensed, long-term care setting for seniors or individuals with disabilities who need help with daily activities — like bathing, dressing, and medication management — but not 24-hour skilled nursing. Offers housing, meals, and around-the-clock support while aiming to maximize resident independence.

Salt Lake City120 80.0% +14%3.48 -50%-6%$0258.3-81A+ 72 Olympus Health, Inc.$11.9M$6.7M56.6%465109
Life Care Center of Bountiful
NH

Nursing Home Licensed facility providing 24/7 skilled nursing care for residents with complex, ongoing medical needs. Staffed by RNs, LPNs, and CNAs. Inspected and star-rated annually by CMS. Accepts Medicare (short-term rehab) and Medicaid (long-term care).

AL

Assisted Living A licensed, long-term care setting for seniors or individuals with disabilities who need help with daily activities — like bathing, dressing, and medication management — but not 24-hour skilled nursing. Offers housing, meals, and around-the-clock support while aiming to maximize resident independence.

Woods Cross100 44.4% -37%2.92 -20%-21%$34.0k214.2469- 62 Monument Health Bountiful LLC$7.7M$4.4M57.8%465112

Frequently Asked Questions about Life Care Center of Bountiful

Is Life Care Center of Bountiful in a walkable area?

Life Care Center of Bountiful has a walk score of 62. Moderately walkable. Some errands can be accomplished on foot, with a mix of nearby amenities.

What is the occupancy rate at Life Care Center of Bountiful?

Life Care Center of Bountiful's occupancy is 44.4%.

What is the phone number of Life Care Center of Bountiful?

(801) 295-3135 will put you in contact with the team at Life Care Center of Bountiful.

Is Life Care Center of Bountiful Medicare or Medicaid certified?

Yes — Life Care Center of Bountiful is a CMS-certified provider of Medicare and Medicaid.

Guides for Better Senior Living

Care Cost Calculator: See Prices in Your Area

Nursing Home Data Explorer

Don’t Wait Too Long: 7 Red Flag Signs Your Parent Needs Assisted Living Now

The True Cost of Assisted Living in 2025 – And How Families Are Paying For It

Understanding Senior Living Costs: Pricing Models, Discounts & Financial Assistance

Explore Open Rooms
1 Contact details
2 What type of senior care service are you looking for?
3 What budget do you have in mind for senior care?
4 How soon do you need to find care?
5 Additional details

Thank you for your interest!

Our team will be in touch shortly to help with next steps.