Total health inspections
5
Hawaii average 4.4
Last Health inspection on May 2025

We arrange tours, appointments, and even moving support so you don’t have to
Thank you for your interest!
Our team will be in touch shortly to help with next steps.
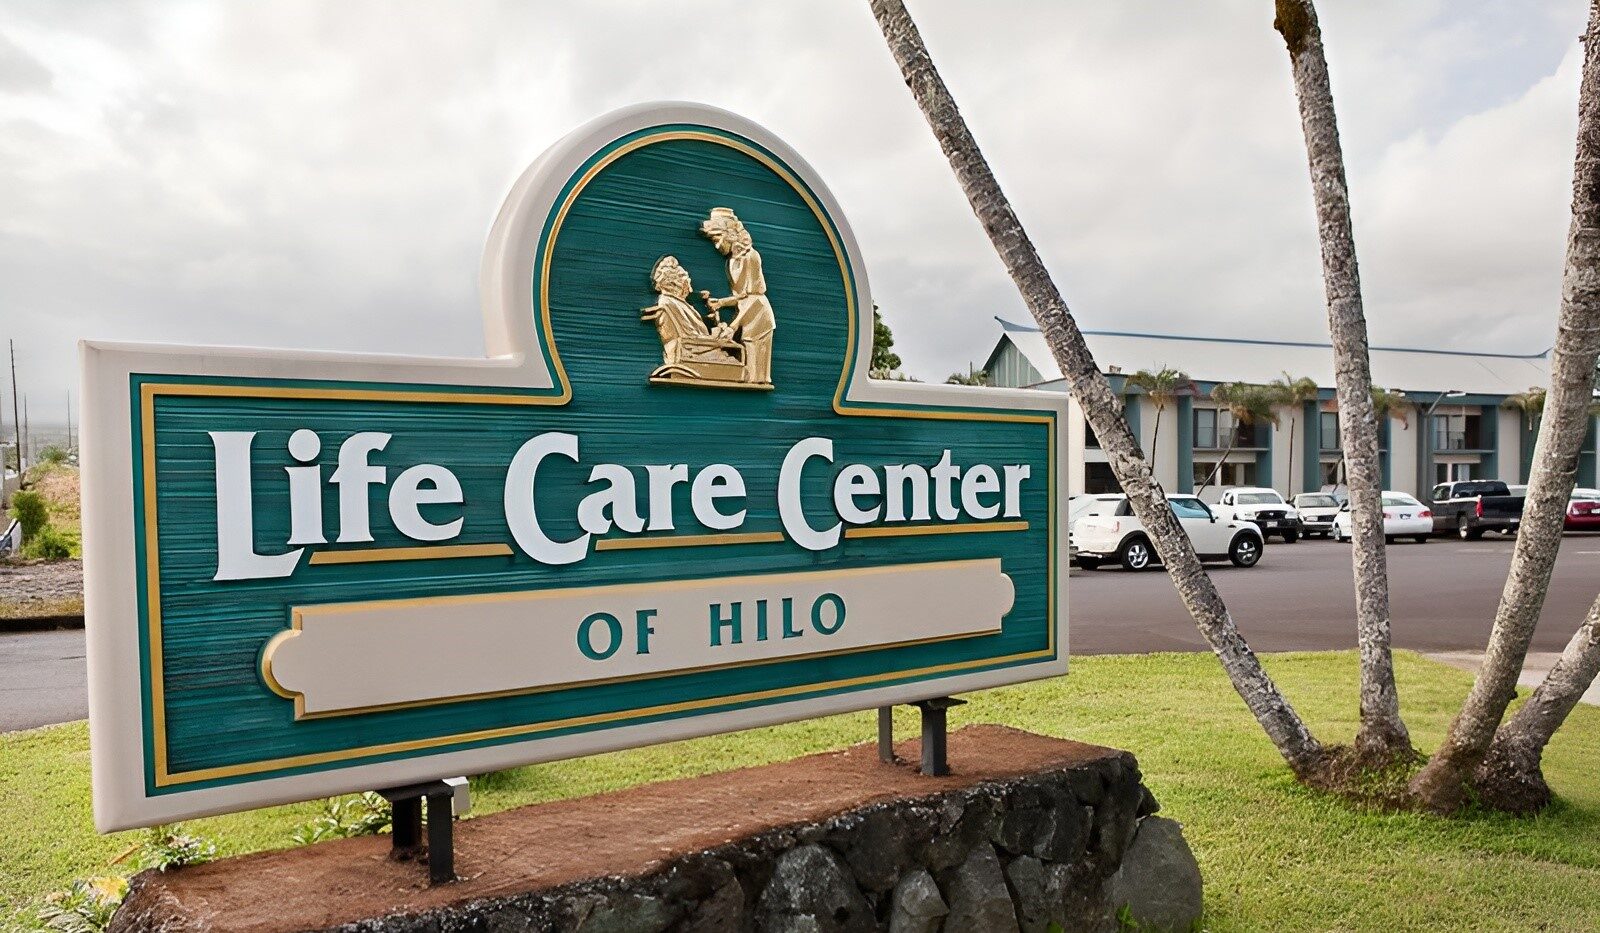
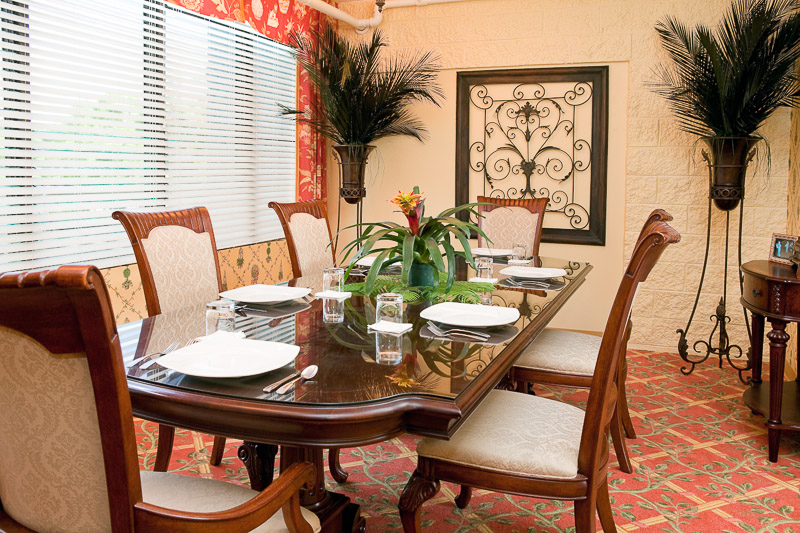
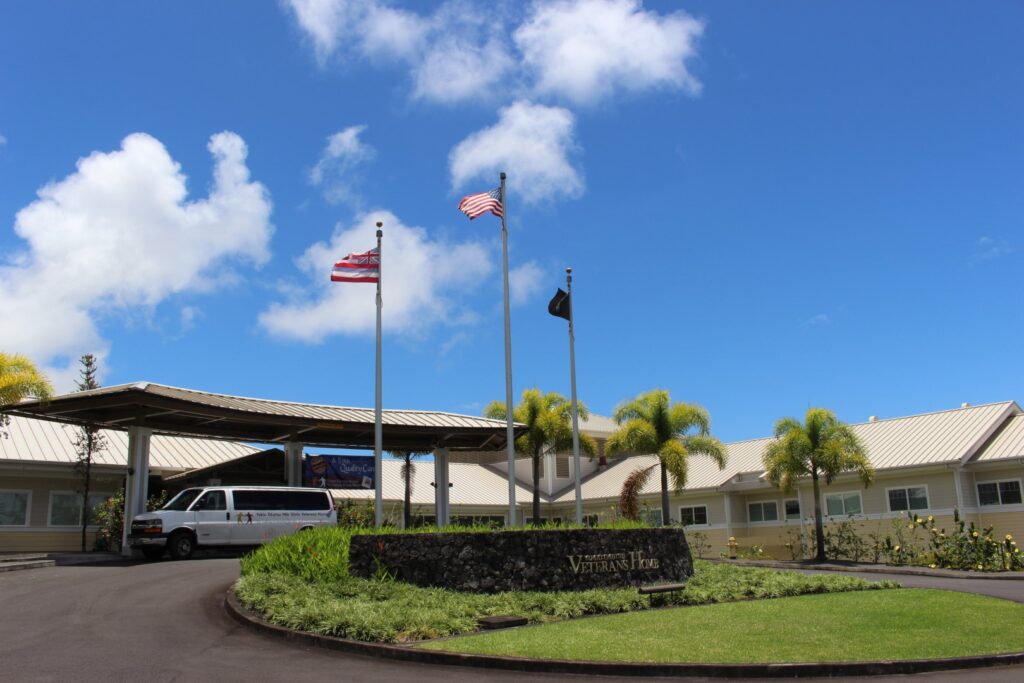
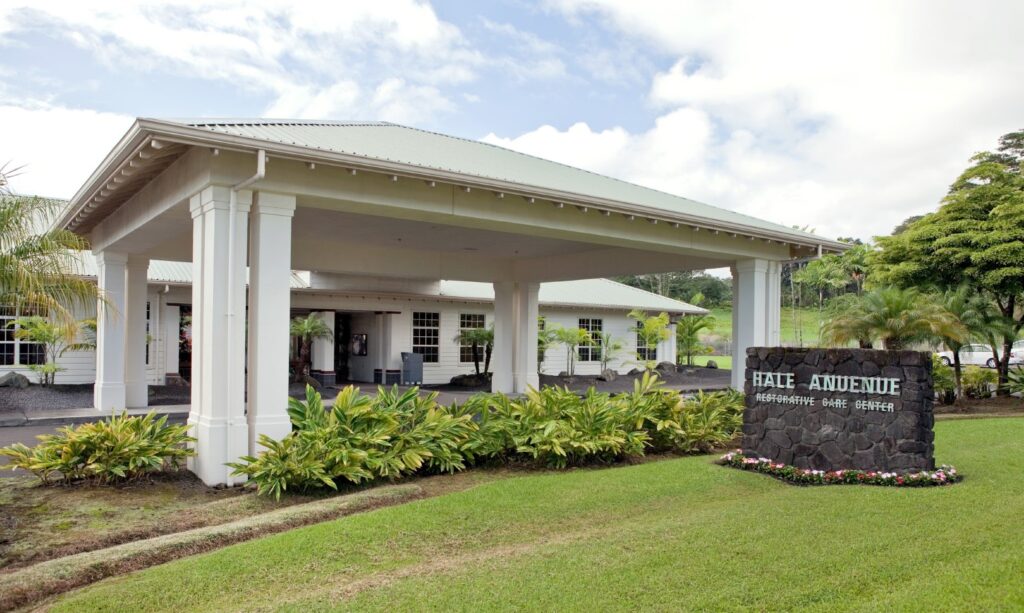
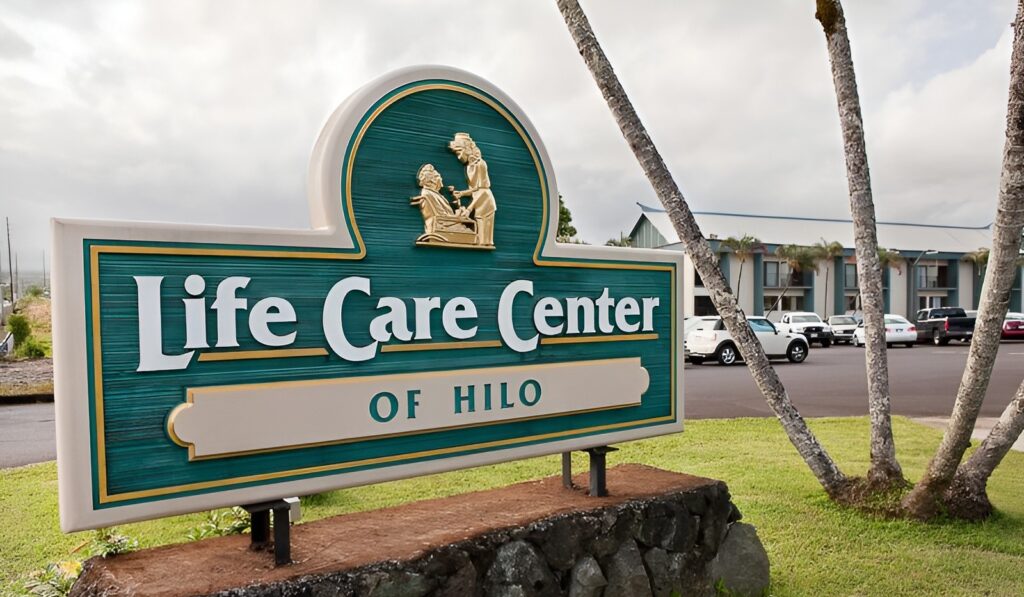
Age with dignity with at Life Care Center of Hilo, an exceptional community situated near Ahualani Park and Ainaola Park in Hilo, HI, that offers rehabilitation and skilled nursing. Residents receive the highest quality of care tailored to their unique needs from a compassionate and well-trained team available around the clock. Purposely designed and spacious accommodations are available in a warm and nurtuiring environment, ensuring residents feel at ease during their stay.
Residents are encouraged to live actively with a robust calendar of fun recreational activities and engaging programs, highlighting their interests and strengths. Delicious and well-balanced meals are served for residents to enjoy a satisfactory dining experience that cater to their dietary needs and preferences. The community is ideal for those seeking exceptional care to recover quickly and live up to their potential.
May provide extensive amenities, services and programs.
Lower occupancy suggests more openings may be available.
Most residents stay for extended periods and receive ongoing daily care.
25% of new residents, usually for short-term rehab.
49% of new residents, often for short stays.
26% of new residents, often for long-term daily care.
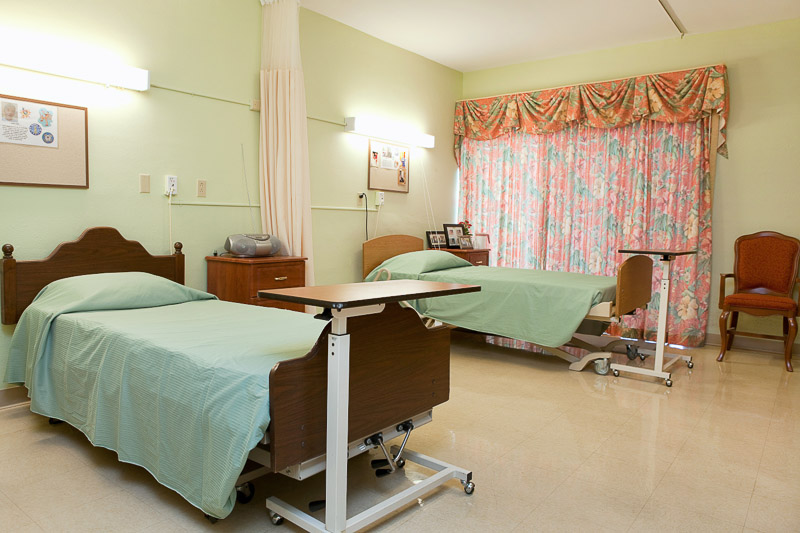
Housing Options: Private / Semi-Private Rooms
Building Type: 3-story
Dining Services
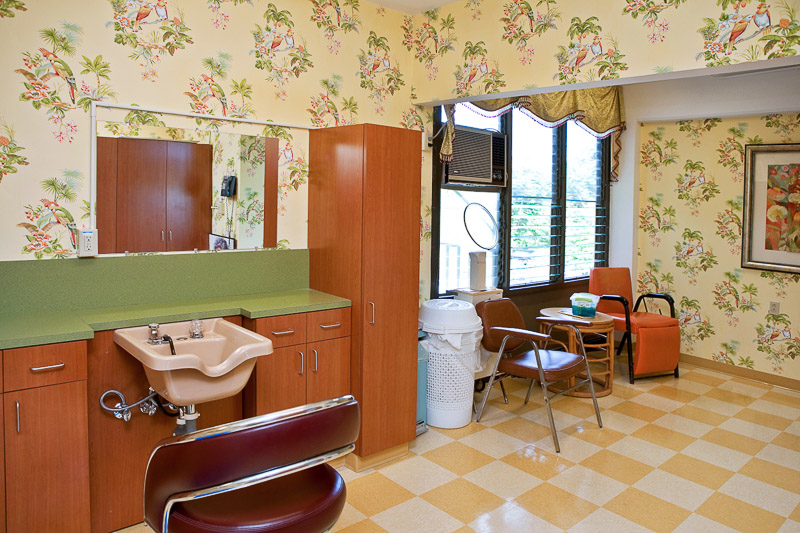
Beauty Services
Transportation Services
Housekeeping Services
Social and Recreational Activities

On-site Medical Care and Health Services
Hawaii average 4.4
Last Health inspection on May 2025
Hawaii average 35.5
Hawaii average 8.23
Health citations are formal notices following inspections when they fail to comply with safety and care standards.
36 of 40 citations resulted from standard inspections; 3 of 40 resulted from complaint investigations; and 1 of 40 came from combined inspections (standard and complaint).
Hawaii average: 0.1
Hawaii average: 1
Data sourced from CMS Health Deficiencies reports. Citation severity codes range from A (least serious) to L (most serious). Immediate Jeopardy (J-L) citations indicate situations where the facility's noncompliance has placed residents at risk of death or serious harm.
Home Care Professional care delivered in the person's own home — from companionship and errands to skilled nursing and therapy. Allows seniors to age in place. Medicare covers skilled home health when medically necessary.
Nursing Home Licensed facility providing 24/7 skilled nursing care for residents with complex, ongoing medical needs. Staffed by RNs, LPNs, and CNAs. Inspected and star-rated annually by CMS. Accepts Medicare (short-term rehab) and Medicaid (long-term care).
Respite Care Short-term temporary care — days to weeks — to give family caregivers a break. Full care provided during the stay. Often used after hospitalization or to trial a facility before a permanent placement decision.
Nursing Home Licensed facility providing 24/7 skilled nursing care for residents with complex, ongoing medical needs. Staffed by RNs, LPNs, and CNAs. Inspected and star-rated annually by CMS. Accepts Medicare (short-term rehab) and Medicaid (long-term care).
Memory Care Secured, specialized care for people living with Alzheimer's or dementia. Staff trained in cognitive impairment, with higher staff-to-resident ratios and an environment designed to reduce confusion and wandering risk.
Nursing Home Licensed facility providing 24/7 skilled nursing care for residents with complex, ongoing medical needs. Staffed by RNs, LPNs, and CNAs. Inspected and star-rated annually by CMS. Accepts Medicare (short-term rehab) and Medicaid (long-term care).
![]() 3.6 miles from city center
3.6 miles from city center
![]() 944 W Kawailani St, Hilo, HI 96720
944 W Kawailani St, Hilo, HI 96720
Add your location
This data corresponds to Q2 2025 and is based on CMS Payroll-Based Journal.
Hawaii average ratio: 1.64:1
Hawaii average: 7.8 hours
Manages medical care and health needs.
This role is partially covered by contractors.
Assists with medical care and medications.
This role is partially covered by contractors.
Helps with daily care and mobility.
No contractors work on this role.
Total hours from contractors
1,639 contractor hours this quarter
| Certified Nursing Assistant | 98 | 0 | 98 | 40,333 | 91 | 100% | 8.1 |
| Registered Nurse | 38 | 1 | 39 | 14,360 | 91 | 100% | 8.5 |
| Licensed Practical Nurse | 19 | 2 | 21 | 8,553 | 91 | 100% | 8.7 |
| Other Dietary Services Staff | 11 | 0 | 11 | 4,104 | 91 | 100% | 7.2 |
| Clinical Nurse Specialist | 6 | 0 | 6 | 2,843 | 70 | 77% | 8.5 |
| Respiratory Therapy Technician | 6 | 1 | 7 | 2,151 | 88 | 97% | 7.9 |
| Nurse Aide in Training | 13 | 0 | 13 | 1,555 | 87 | 96% | 8.6 |
| Physical Therapy Assistant | 4 | 2 | 6 | 1,284 | 73 | 80% | 7.4 |
| Dental Services Staff | 3 | 0 | 3 | 1,175 | 72 | 79% | 8.1 |
| Qualified Social Worker | 3 | 1 | 4 | 1,032 | 72 | 79% | 6 |
| Physical Therapy Aide | 2 | 0 | 2 | 908 | 76 | 84% | 7.2 |
| Speech Language Pathologist | 3 | 0 | 3 | 805 | 63 | 69% | 7.2 |
| Occupational Therapy Aide | 3 | 0 | 3 | 680 | 68 | 75% | 6.2 |
| Other Physician | 0 | 1 | 1 | 551 | 77 | 85% | 7.2 |
| Administrator | 1 | 0 | 1 | 520 | 65 | 71% | 8 |
| Nurse Practitioner | 1 | 0 | 1 | 520 | 65 | 71% | 8 |
| Mental Health Service Worker | 1 | 0 | 1 | 520 | 65 | 71% | 8 |
| Dietitian | 1 | 0 | 1 | 469 | 59 | 65% | 8 |
| Therapeutic Recreation Specialist | 1 | 0 | 1 | 443 | 58 | 64% | 7.6 |
| Occupational Therapy Assistant | 0 | 1 | 1 | 63 | 9 | 10% | 7 |
| Medical Director | 0 | 1 | 1 | 34 | 3 | 3% | 11.2 |
Source: CMS Long-Term Care Facility Characteristics (Data as of Jan 2026)
Residents meet regularly to discuss policies, care quality, and activities
Family members meet regularly to discuss policies, care quality, and activities
Organized group of family members that meets regularly to discuss facility policies, resident care, and activities.
Organized group of residents that meets regularly to discuss facility policies, quality of life, and activities.
Data sourced from CMS Long-Term Care Facility Characteristics quarterly report. Payer mix reflects the current resident census by primary payment source.
These measures show how residents usually do over time at this home, based on health outcomes and preventive care.
Hawaii average: 10.2
Hawaii average: 20.0
Hawaii average: 17.6%
Hawaii average: 25.8%
Hawaii average: 18.3%
Hawaii average: 2.1%
Hawaii average: 3.6%
Hawaii average: 2.4%
Hawaii average: 4.7%
Hawaii average: 1.5%
Hawaii average: 10.1%
Hawaii average: 96.3%
Hawaii average: 95.4%
Hawaii average: 1.34
Hawaii average: 0.89
Hawaii average: 83.4%
Hawaii average: 1.2%
Hawaii average: 84.7%
Hawaii average: 19.6%
Hawaii average: 10.9%
Hawaii average: 0.8%
Hawaii average: 53.7%
Hawaii average: 50.6%
Quality measures are calculated from Minimum Data Set (MDS) assessments. For most measures, lower percentages indicate better care quality.
Historical financial and operational data for Life Care Center of Hilo based on CMS SNF Cost Reports.
Loading trend charts...
Care Cost Calculator: See Prices in Your Area
Nursing Home Data Explorer
Don’t Wait Too Long: 7 Red Flag Signs Your Parent Needs Assisted Living Now
The True Cost of Assisted Living in 2025 – And How Families Are Paying For It
Understanding Senior Living Costs: Pricing Models, Discounts & Financial Assistance

Touring a community? Use this expert-backed checklist to stay organized, ask the right questions, and find the perfect fit.
We'll send you a PDF version of the touring checklist.