Hale Anuenue Restorative Care

Nursing Home in Hilo

CMS overall rating Info The Overall CMS Rating is scored from 1 to 5 stars and combines results from health inspections, staffing levels, and quality measures. Health inspections carry the most weight. Staffing and quality scores can increase or decrease the final rating based on performance compared to state and national standards.
Calculator: See prices in your area
Hale Anuenue Restorative Care accepts Medicare, Medicaid, and private pay.

Overview of Hale Anuenue Restorative Care

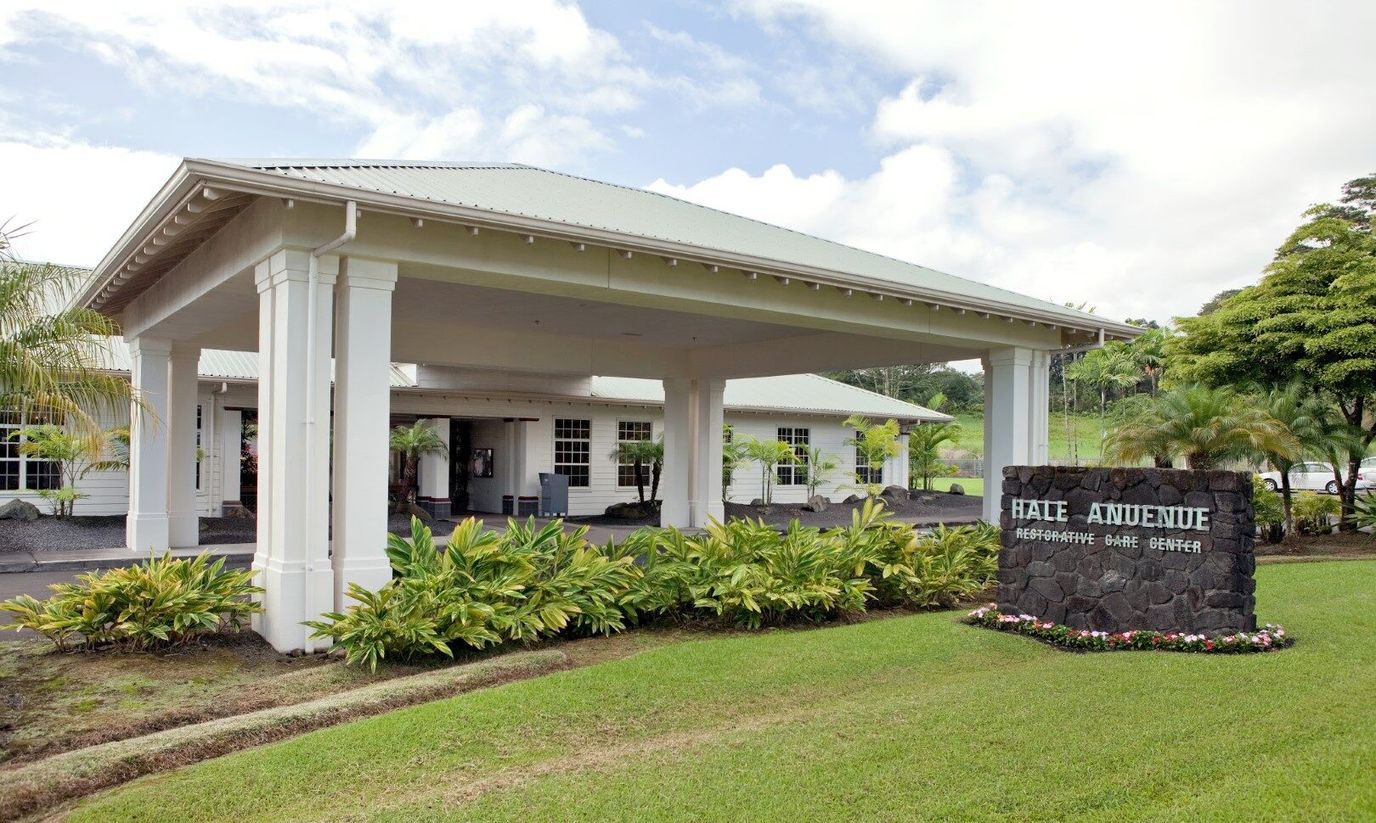
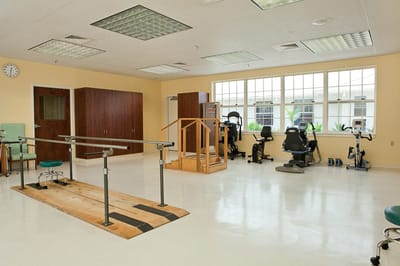
Experience a better quality of life with Hale Anuenue Restorative Care, an putstanding community surrounded by delightful local amenities in Waianuenue Avenue, HIlo, HI, that offers skilled nursing and rehabilitation. Dedicated to improving residents’ well-being, a kind and highly qualified team provides exceptional care around the clock to optimize comfort and safety. As a member of Life Care Centers of America, the community promotes a cozy and nurturing environment so residents can thrive and live up to their potential.

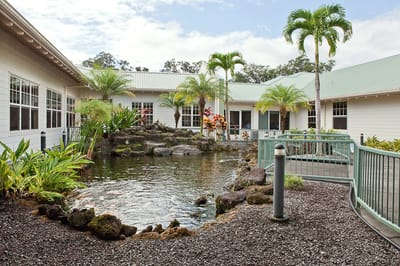
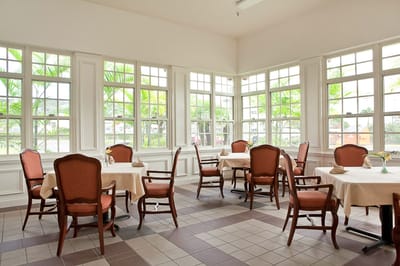
Aside from their healthcare needs, the community strives to satisfy residents’ leisure and wellness with engaging recreational activities and enriching programs. Residents enjoy fine dining experience with delightful and healthy meals that satisfy their dietary needs and preferences. With its beautifully maintained grounds and purposely crafted amenities, residents make the most of their best years without worries.

(808) 961-6644

Quality ratings

Measured by Centers for Medicare & Medicaid Services (CMS)

Overall rating Info The Overall CMS Rating combines results from health inspections, staffing levels and quality measures. Health inspections carry the most weight. Staffing and quality scores can increase or decrease the final rating based on performance compared to state and national standards.
3/5 ▼ 0.4 Hawaii average: 3.4/5
Health Inspection Info Based on the results of the facility's three most recent standard inspections and any complaint investigations. CMS reviews the number, scope, and severity of deficiencies, with more recent findings weighted more heavily.
2/5 ▼ 0.9 Hawaii average: 2.9/5
Staffing Info Measures average nursing staff hours per resident per day, including Registered Nurses (RNs) and total nursing staff. Ratings are adjusted based on the level of care residents require and are compared to state and national benchmarks.
4/5 ■ Avg Hawaii average: 4.0/5
Quality Measures Info Based on clinical and physical health indicators reported to CMS, such as hospital readmissions, falls, pressure ulcers, and improvements in mobility. These measures reflect how well residents' health needs are being managed.
5/5 ▲ 0.8 Hawaii average: 4.2/5

Staffing hours breakdown

Info Daily nursing hours per resident by staff type, reported to CMS. Higher is generally better — compare this facility to state and national averages to see where staffing stands.

Hours per resident per day — compared to Hawaii state averages

Total nursing care / resident Info This home is ranked 19th out of 25 homes in Hawaii.

Total adjusted nursing hours per resident per day, combining RN, LPN, and aide time. CMS adjusts this for case-mix so facilities can be fairly compared.
3h 47m per day
Rank #19 / 25Nurse hours — state benchmarkedThis home is ranked 19th out of 25 homes in Hawaii.Shows adjusted nurse hours per resident per day benchmarked to the Hawaii average, with a ranking across 25 Hawaii SNFs. More hours mean more direct care. The national average is about 3.5 hrs; below 3.0 is a red flag.
This facility Hawaii avg (4h 12m per day)
vs Hawaii avg
-10%

4 of 6 metrics below state avg

Standout metric Physical Therapist is +80% above state avg
Staff typeHours / dayvs state avg
Registered Nurse (RN) Info RNs hold the highest nursing license and can assess residents, interpret test results, and direct care plans. More RN hours per day often signals stronger clinical oversight and faster response to health changes. 1h 1m per day ▼ 38% State avg: 1h 38m per day · National avg: 41m per day
LPN / LVN Info Licensed Practical Nurses (LPNs) or Licensed Vocational Nurses (LVNs) deliver routine hands-on care — medication administration, wound dressing, and monitoring vital signs. They work under RN supervision and make up a large share of daily bedside care. 31m per day ▲ 48% State avg: 21m per day · National avg: 52m per day
Nurse Aide Info Certified Nurse Aides (CNAs) provide the most direct day-to-day assistance: bathing, dressing, feeding, and mobility. Nurse aide hours are typically the largest staffing category and directly affect residents' quality of life. 2h 6m per day ▼ 23% State avg: 2h 44m per day · National avg: 2h 21m per day
Total Nursing (Weekend) Info Combined nursing hours (RN + LPN + Nurse Aide) per resident per day on weekends. Staffing often drops on weekends — this figure reveals whether the facility maintains adequate coverage outside of weekday hours. 3h 16m per day ▼ 22% State avg: 4h 11m per day · National avg: 3h 26m per day
Physical Therapist Info Hours per resident per day provided by licensed Physical Therapists (PTs) or PT Assistants. PT services help residents recover mobility after injury or illness and are especially important for post-acute (short-stay) rehabilitation. 9m per day ▲ 80% State avg: 5m per day · National avg: 4m per day
RN (Weekend) Info Registered nurse hours specifically on weekends. Facilities sometimes reduce RN presence on Saturdays and Sundays — a low weekend RN figure compared to weekday hours can indicate reduced clinical oversight when most administrative staff are absent. 45m per day ▼ 39% State avg: 1h 14m per day · National avg: 29m per day

Capacity and availability

This home usually has availability

Occupancy lower than 85% suggests more openings may be available.

Lower occupancy than the Hawaii average: 74.2%
Occupancy rate 68.7% Rank #18 / 24Occupancy rate — state benchmarkedThis home is ranked 18th out of 24 homes in Hawaii.Shows this facility's occupancy rate versus the Hawaii average, with its statewide rank out of 24. Higher occupancy signals strong local demand and financial stability.
Avg. Length of Stay 101 days
Occupancy rate
68.7% Rank #18 / 24Occupancy rate — state benchmarkedThis home is ranked 18th out of 24 homes in Hawaii.Shows this facility's occupancy rate versus the Hawaii average, with its statewide rank out of 24. Higher occupancy signals strong local demand and financial stability.
Avg. Length of Stay
101 days

Who this home usually serves

TYPE OF STAY

Mostly short-term rehab stays

Most residents typically stay for a few weeks or months before returning home or moving on.

Breakdown by payment type

Medicare

43% of new residents, usually for short-term rehab.

Typical stay 1 months

Private pay

41% of new residents, often for short stays.

Typical stay 1 - 2 months

Medicaid

16% of new residents, often for long-term daily care.

Typical stay 1 - 2 years

Finances and operations

Privately-owned community
Operated by a partnership between two or more business owners.
Home revenue
$17.5M
Profit
$83.1K
Privately-owned community Operated by a partnership between two or more business owners.
Home revenue
$17.5M Rank #14 / 24Revenue — state benchmarkedThis home is ranked 14th out of 24 homes in Hawaii.Shows this facility's annual revenue compared to the Hawaii SNF average. Higher revenue generally means more resources for staffing and capital — read alongside Payroll %.
Profit
$83.1K
Payroll costs Info The portion of the home's budget spent on staff, including nurses, caregivers, and other employees who support care and operations. Rank #18 / 24Payroll — state benchmarkedThis home is ranked 18th out of 24 homes in Hawaii.Shows total annual staff payroll benchmarked to the Hawaii average. Higher payroll investment relative to peers often signals better staffing and less reliance on cheaper contract labor.
$5.7M
32.5% of revenue Rank #16 / 24Payroll % — state benchmarkedThis home is ranked 16th out of 24 homes in Hawaii.Shows payroll as a percentage of revenue versus the Hawaii average. Well-run SNFs often land around 55–65%. Below 25% may signal understaffing or heavy agency use — read with Staffing ratings.
Other operating costs Info All remaining costs needed to run the home, such as food, utilities, building maintenance, supplies and administrative expenses.
$11.7M
Total costs $17.4M
Walk Score
Walk Score: 7 / 100 Rank #27 / 27Walk Score — state benchmarkedThis home is ranked 27th out of 27 homes in Hawaii.Shows how walkable this facility's neighborhood is compared to the average Walk Score across Hawaii SNFs. Higher scores benefit residents, families, and staff.
Car-dependent. Most errands require a car, with limited nearby walkable options.

What does this home offer?

Housing options icon

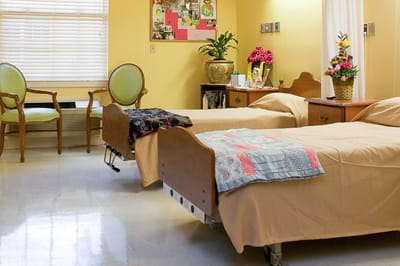
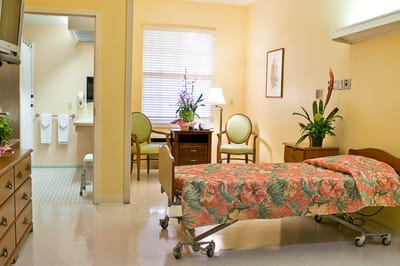
Housing Options: Private / Semi-Private Rooms

Building type icon
Building type icon

Building Type: Single-story
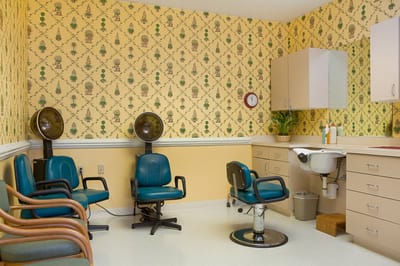
Dining services icon

Dining Services

Beauty services icon

Beauty Services

Transportation services icon

Transportation Services

Housekeeping icon
Housekeeping icon

Housekeeping Services

Social and recreational activities icon

Social and Recreational Activities

On-site medical care and health services icon

On-site Medical Care and Health Services

Types of Care at Hale Anuenue Restorative Care

Nursing Home

Contact Hale Anuenue Restorative Care

Health Inspection History

Inspections
Total health inspections 5

Hawaii average 4.4


Last Health inspection on Feb 2024

Total health citations
31 Rank #8 / 26Health citations — state benchmarkedThis home is ranked 8th out of 26 homes in Hawaii.Shows this facility's total health deficiency citations benchmarked to the Hawaii state average, with a ranking across all 26 HI SNFs. Lower citation counts earn a better rank.

Hawaii average 35.5

Citations per inspection
6.2 Rank #5 / 26Citations per inspection — state benchmarkedThis home is ranked 5th out of 26 homes in Hawaii.Shows average deficiency citations per CMS inspection for this facility versus the Hawaii mean across 26 SNFs with citation data. Lower is better.

Hawaii average 8.23


Health citations are formal notices following inspections when they fail to comply with safety and care standards.

23 of 31 citations resulted from standard inspections; 6 of 31 resulted from complaint investigations; and 2 of 31 came from combined inspections (standard and complaint).

Breakdown of citation severity (last 3 years)
Critical Health citations More info
0
100% better than Hawaii average

Hawaii average: 0.1


Serious Health citations More info 2
100% worse than Hawaii average

Hawaii average: 1

0 critical citations More info Hawaii average: 0.1

2 serious citations More info Hawaii average: 1

28 moderate citations More info Hawaii average: 34.2

1 minor citation More info Hawaii average: 0.1
Citations history (last 3 years)
Infection Control moderate citation Info Issues related to preventing and controlling infections, including hygiene practices and safety protocols. Feb 02, 2024
Corrected

Nursing Services moderate citation Info Issues related to the availability and quality of nursing staff and the care they provide. Feb 02, 2024
Corrected

Nutrition moderate citation Info Issues related to food quality, meal service, and resident's nutritional needs. Feb 02, 2024
Corrected

Nutrition moderate citation Info Issues related to food quality, meal service, and resident's nutritional needs. Feb 02, 2024
Corrected

Financial Assistance for
Nursing Home in Hawaii

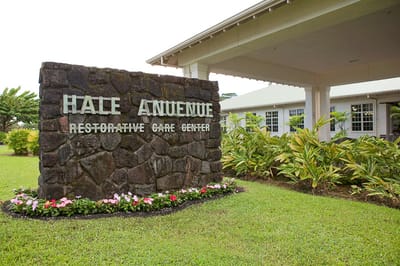
Hale Anuenue Restorative Care is located in Hilo, Hawaii.
Here are the financial assistance programs available to residents in Hawaii.

Get Financial aid guidance

QUEST Integration

Hawaii Medicaid QUEST Integration

Age 65+ or disabled
General Hawaii resident, Medicaid-eligible, long-term care need.
Income Limits (2025) ~$2,829/month 300% FBR, individual
Asset Limits $2,000 (individual), $3,000 (couple).
HI

High cost of living adjustments.

Benefits
In-home care (6-8 hours/day) Nursing home Respite (240 hours/year) Medical services

Kupuna Care

Hawaii Kupuna Care

Age 60+
General Hawaii resident, unable to perform 2+ ADLs.
Income Limits No strict limit; prioritizes low-income.
Asset Limits Not applicable.
HI

Limited funding; island-specific delivery.

Benefits
In-home care (3-5 hours/week) Adult day care (~$70/day) Transportation (~5 trips/month)

Program of All-Inclusive Care for the Elderly (PACE)

Hawaii Medicaid PACE

Age 55+
General Hawaii resident, nursing home-level care need, safe with PACE support.
Income Limits (2025) ~$2,829/month 300% FBR
Asset Limits $2,000 (individual), $3,000 (couple).
HI

Limited to Oahu (e.g., Maluhia in Honolulu); few providers.

Benefits
Personal care (5-7 hours/day) Medical care Meals Transportation Therapy Respite

Medicare Savings Program (MSP)

Hawaii Medicare Savings Program

Age 65+ or disabled
General Hawaii resident, Medicare Part A/B.
Income Limits (2025) ~$2,510/month (QMB), ~$3,380/month (SLMB), ~$3,598/month (QI)—individual, adjusted annually.
Asset Limits $9,430 (individual), $14,130 (couple).
HI

Three tiers; no waitlist.

Benefits
Covers Part B premiums ($174.70/month) Deductibles ($240/year) Copays (~20%)

Senior Community Service Employment Program (SCSEP)

Hawaii SCSEP (Federally Funded, State-Administered)

Age 55+
General unemployed, low-income, Hawaii resident.
Income Limits (2025) ~$1,983/month 125% FPL
Asset Limits Not specified; income-focused.
HI

~800 slots; prioritizes veterans, rural residents.

Benefits
Paid training (~20 hours/week at ~$7.25/hour) Job placement

National Family Caregiver Support Program (NFCSP) Respite

Hawaii NFCSP Respite Care

Age
General Caregivers of 60+ needing care or 55+ caregivers of others; Hawaii resident; functional needs (2+ ADLs).
Income Limits (2025) Prioritizes ~$24,980/year (individual); no strict cap.
Asset Limits Not assessed; need-based.
HI

Four county AAAs; prioritizes low-income.

Benefits
Respite (4-6 hours/week or 5 days/year) Adult day care ($80/day) Counseling

VA Aid and Attendance (A&A) and Housebound Benefits

Hawaii VA Aid and Attendance/Housebound

Age 65+ or disabled veteran/surviving spouse
General Hawaii resident, wartime service, need for aid with ADLs (A&A) or homebound status.
Income Limits (2025) Net income < ~$1,984/month (veteran with dependent, A&A); pension offsets income.
Asset Limits ~$155,356 2025 net worth limit
HI

Applies statewide; high demand due to veteran population.

Benefits
Cash (~$1,433-$2,642/month veteran, ~$951-$1,318 spouse) for care costs (e.g., in-home, assisted living)

Senior Companion Program (SCP)

Hawaii Senior Companion Program

Age
General Volunteers: 55+, low-income, Hawaii resident, able to work 20 hours/week. Recipients: Frail elders needing companionship.
Income Limits (2025) Volunteers: ~$24,980/year (200% FPL); recipients: no limit.
Asset Limits Not specified for volunteers; need-based for recipients.
HI

Statewide; managed by DHS Social Services.

Benefits
Volunteers paid ~$4/hour for companionship (~20 hours/week); recipients get free support (~4-6 hours/week)

Places of interest near Hale Anuenue Restorative Care

Address 2.3 miles from city center Info Estimated distance in miles from Hilo's city center to Hale Anuenue Restorative Care's address, calculated via Google Maps.

Calculate Travel Distance to Hale Anuenue Restorative Care

Add your location

Address

Staffing Data (Q2 2025)

This data corresponds to Q2 2025 and is based on CMS Payroll-Based Journal.

Total staff 106
Employees 103
Contractors 3
Staff to resident ratio 1.16:1
29% worse than Hawaii average

Hawaii average ratio: 1.64:1

Avg staff/day 55
Average shift 7.7 hours
0% compared with Hawaii average

Hawaii average: 7.8 hours

Total staff hours (quarter) 38,384
Nursing staff breakdown
Registered Nurse

Manages medical care and health needs.

Total count 17
Average shift length Info Average shift length. Calculated as total hours divided by days worked and average staff per day. 8.4 hours

No contractors work on this role.

Licensed Practical Nurse

Assists with medical care and medications.

Total count 7
Average shift length Info Average shift length. Calculated as total hours divided by days worked and average staff per day. 8.7 hours

No contractors work on this role.

Certified Nursing Assistant

Helps with daily care and mobility.

Total count 49
Average shift length Info Average shift length. Calculated as total hours divided by days worked and average staff per day. 7.2 hours

No contractors work on this role.

Contractor staffing

Total hours from contractors

0.2%

83 contractor hours this quarter

Qualified Social Worker: 1 Medical Director: 1 Occupational Therapy Assistant: 1
Staff by category
Certified Nursing Assistant4904917,30391100%7.2
Registered Nurse170175,91091100%8.4
Licensed Practical Nurse7074,30991100%8.7
Clinical Nurse Specialist4041,9046673%8.3
Other Dietary Services Staff4041,86091100%7.5
Speech Language Pathologist3031,1068290%7.9
Respiratory Therapy Technician3031,1008796%8.7
Physical Therapy Assistant4046836167%6.8
Nurse Aide in Training2025305358%7
Administrator1015206571%8
Occupational Therapy Aide1014766066%7.9
Nurse Practitioner1014725965%8
Dental Services Staff1014716167%7.7
Mental Health Service Worker1014695965%8
Other Social Services Staff1014645864%8
Physical Therapy Aide3034426571%6.5
Qualified Social Worker1123264853%6.5
Medical Director0112933%9.5
Occupational Therapy Assistant0111122%5.5
49 Certified Nursing Assistant
% of Days 100%
17 Registered Nurse
% of Days 100%
7 Licensed Practical Nurse
% of Days 100%
4 Clinical Nurse Specialist
% of Days 73%
4 Other Dietary Services Staff
% of Days 100%
3 Speech Language Pathologist
% of Days 90%
3 Respiratory Therapy Technician
% of Days 96%
4 Physical Therapy Assistant
% of Days 67%
2 Nurse Aide in Training
% of Days 58%
1 Administrator
% of Days 71%
1 Occupational Therapy Aide
% of Days 66%
1 Nurse Practitioner
% of Days 65%
1 Dental Services Staff
% of Days 67%
1 Mental Health Service Worker
% of Days 65%
1 Other Social Services Staff
% of Days 64%
3 Physical Therapy Aide
% of Days 71%
2 Qualified Social Worker
% of Days 53%
1 Medical Director
% of Days 3%
1 Occupational Therapy Assistant
% of Days 2%

Facility Characteristics

Source: CMS Long-Term Care Facility Characteristics (Data as of Jan 2026)

Total residents 91
Medicare
17
18.7% of residents
Medicaid
58
63.7% of residents
Private pay or other
16
17.6% of residents
Programs & Services
Residents Group

Residents meet regularly to discuss policies, care quality, and activities

Active Resident Council

Organized group of residents that meets regularly to discuss facility policies, quality of life, and activities.

Quality of care over time

These measures show how residents usually do over time at this home, based on health outcomes and preventive care.

High-risk clinical events score Info A composite score based on pressure ulcers, falls with injury, weight loss, walking ability decline, and activities of daily living decline. 6.8
33% better than Hawaii average

Hawaii average: 10.2

Functional decline score Info A composite score based on activities of daily living decline, walking ability decline, and incontinence. 16.0
20% better than Hawaii average

Hawaii average: 20.0

Long-stay resident measures
Significantly above average Hawaii avg: 4.4 Info CMS star rating based on long-stay quality measure performance. 5 stars = significantly above average, 1 star = significantly below average.
Need for Help with Daily Activities Increased Info Percent of long-stay residents whose need for help with daily activities has increased 12.1%
31% better than Hawaii average

Hawaii average: 17.6%

Walking Ability Worsened Info Percent of long-stay residents whose ability to move independently worsened 17.3%
33% better than Hawaii average

Hawaii average: 25.8%

Low Risk Residents with Bowel/Bladder Incontinence Info Percent of low risk long-stay residents who lose control of their bowels or bladder 18.6%
In line with Hawaii average

Hawaii average: 18.3%

Falls with Major Injury Info Percent of long-stay residents experiencing one or more falls with major injury 1.7%
19% better than Hawaii average

Hawaii average: 2.1%

High Risk Residents with Pressure Ulcers Info Percent of long-stay high risk residents with pressure ulcers 1.4%
60% better than Hawaii average

Hawaii average: 3.6%

Urinary Tract Infection Info Percent of long-stay residents with a urinary tract infection 0.0%
100% better than Hawaii average

Hawaii average: 2.4%

Lost Too Much Weight Info Percent of long-stay residents who lose too much weight 1.5%
69% better than Hawaii average

Hawaii average: 4.7%

Depressive Symptoms Info Percent of long-stay residents who have depressive symptoms 1.8%
21% worse than Hawaii average

Hawaii average: 1.5%

Antipsychotic Use Info Percent of long-stay residents who received an antipsychotic medication 2.1%
80% better than Hawaii average

Hawaii average: 10.1%

Pneumococcal Vaccine Info Percent of long-stay residents assessed and appropriately given the pneumococcal vaccine 96.6%
In line with Hawaii average

Hawaii average: 96.3%

Influenza Vaccine Info Percent of long-stay residents assessed and appropriately given the seasonal influenza vaccine 98.7%
In line with Hawaii average

Hawaii average: 95.4%

Hospitalizations per 1,000 days Info Number of hospitalizations per 1,000 long-stay resident days. 1.10
18% better than Hawaii average

Hawaii average: 1.34

ED visits per 1,000 days Info Number of outpatient emergency department visits per 1,000 long-stay resident days. 0.46
48% better than Hawaii average

Hawaii average: 0.89

Short-stay resident measures
Significantly above average Hawaii avg: 3.0 Info CMS star rating based on short-stay quality measure performance. 5 stars = much above average, 1 star = much below average.
Pneumococcal Vaccine Info Percent of short-stay residents assessed and appropriately given the pneumococcal vaccine 91.2%
9% better than Hawaii average

Hawaii average: 83.4%

Antipsychotic medication increase Info Percent of short-stay residents who newly received an antipsychotic medication 0.9%
20% better than Hawaii average

Hawaii average: 1.2%

Influenza Vaccine Info Percent of short-stay residents assessed and appropriately given the seasonal influenza vaccine 92.1%
9% better than Hawaii average

Hawaii average: 84.7%

Re-hospitalized after SNF stay Info Percentage of short-stay residents who were re-hospitalized after their nursing home admission. 10.7%
45% better than Hawaii average

Hawaii average: 19.6%

Emergency department visits Info Percentage of short-stay residents who had an outpatient emergency department visit. 14.4%
32% worse than Hawaii average

Hawaii average: 10.9%

Falls with major injury Info Percentage of SNF residents who experience falls with major injury during their stay. 0.0%
100% better than Hawaii average

Hawaii average: 0.8%

Ability to care for self at discharge Info Percentage of residents at or above expected ability to care for themselves at discharge. 95.1%
77% better than Hawaii average

Hawaii average: 53.7%

Successful return to home or community Info Rate of successful return to home or community from a skilled nursing facility. 66.3%
31% better than Hawaii average

Hawaii average: 50.6%

Penalties and fines

Federal penalties imposed by CMS for regulatory violations, including civil money penalties (fines) and denials of payment for new Medicare/Medicaid admissions.

Source: CMS Penalties Database

Penalty History

Penalties are imposed by CMS for violations of federal nursing home regulations.

No penalties in the past 3 years

No civil money penalties or payment denials were reported in the last 3 years.

Compare Nursing Homes around Hilo The information below is reported by the Hawaii Department of Health, Office of Health Care Assurance.

3 facilities compared · CMS & HI Dept. of Health data · Updated Apr 2026

Filter by care type
Yukio Okutsu State Veterans Home
HC

Home Care Professional care delivered in the person's own home — from companionship and errands to skilled nursing and therapy. Allows seniors to age in place. Medicare covers skilled home health when medically necessary.

NH

Nursing Home Licensed facility providing 24/7 skilled nursing care for residents with complex, ongoing medical needs. Staffed by RNs, LPNs, and CNAs. Inspected and star-rated annually by CMS. Accepts Medicare (short-term rehab) and Medicaid (long-term care).

RC

Respite Care Short-term temporary care — days to weeks — to give family caregivers a break. Full care provided during the stay. Often used after hospitalization or to trial a facility before a permanent placement decision.

Hilo (Piʻihonua)95 62.4% -16%4.67 -13%+11%13913.0364 9 East Hawaii State Veterans Home$13.8M$5.9M42.4%125058
Hale Anuenue Restorative Care
NH

Nursing Home Licensed facility providing 24/7 skilled nursing care for residents with complex, ongoing medical needs. Staffed by RNs, LPNs, and CNAs. Inspected and star-rated annually by CMS. Accepts Medicare (short-term rehab) and Medicaid (long-term care).

Hilo120 68.7% -7%3.78 -22%-10%0316.2292 7 Kahookele, Gail$17.5M$5.7M32.5%125045
Life Care Center of Hilo
MC

Memory Care Secured, specialized care for people living with Alzheimer's or dementia. Staff trained in cognitive impairment, with higher staff-to-resident ratios and an environment designed to reduce confusion and wandering risk.

NH

Nursing Home Licensed facility providing 24/7 skilled nursing care for residents with complex, ongoing medical needs. Staffed by RNs, LPNs, and CNAs. Inspected and star-rated annually by CMS. Accepts Medicare (short-term rehab) and Medicaid (long-term care).

Hilo252 81.7% +10%3.38 -15%-20%0408.00222 11 Lemanua, Lemapu$42.9M$12.1M28.2%125040

Guides for Better Senior Living

Care Cost Calculator: See Prices in Your Area

Nursing Home Data Explorer

Don’t Wait Too Long: 7 Red Flag Signs Your Parent Needs Assisted Living Now

The True Cost of Assisted Living in 2025 – And How Families Are Paying For It

Understanding Senior Living Costs: Pricing Models, Discounts & Financial Assistance

Explore Open Rooms
1 Contact details
2 What type of senior care service are you looking for?
3 What budget do you have in mind for senior care?
4 How soon do you need to find care?
5 Additional details

Thank you for your interest!

Our team will be in touch shortly to help with next steps.