Yukio Okutsu State Veterans Home
Nursing Home, Hospice Care & Respite Care · Hilo, HI
CMS overall rating Info CMS (the Centers for Medicare & Medicaid Services) is the federal agency that rates nursing home quality. Its Overall Rating runs from 1 to 5 stars, combining health inspections, staffing, and quality measures, with inspections weighted most heavily.

Yukio Okutsu State Veterans Home

Nursing Home, Hospice Care & Respite Care · Hilo, HI
CMS overall rating Info CMS (the Centers for Medicare & Medicaid Services) is the federal agency that rates nursing home quality. Its Overall Rating runs from 1 to 5 stars, combining health inspections, staffing, and quality measures, with inspections weighted most heavily.
Calculator: See prices in your area
Yukio Okutsu State Veterans Home accepts Medicaid, Medicare, and private pay.

Overview of Yukio Okutsu State Veterans Home

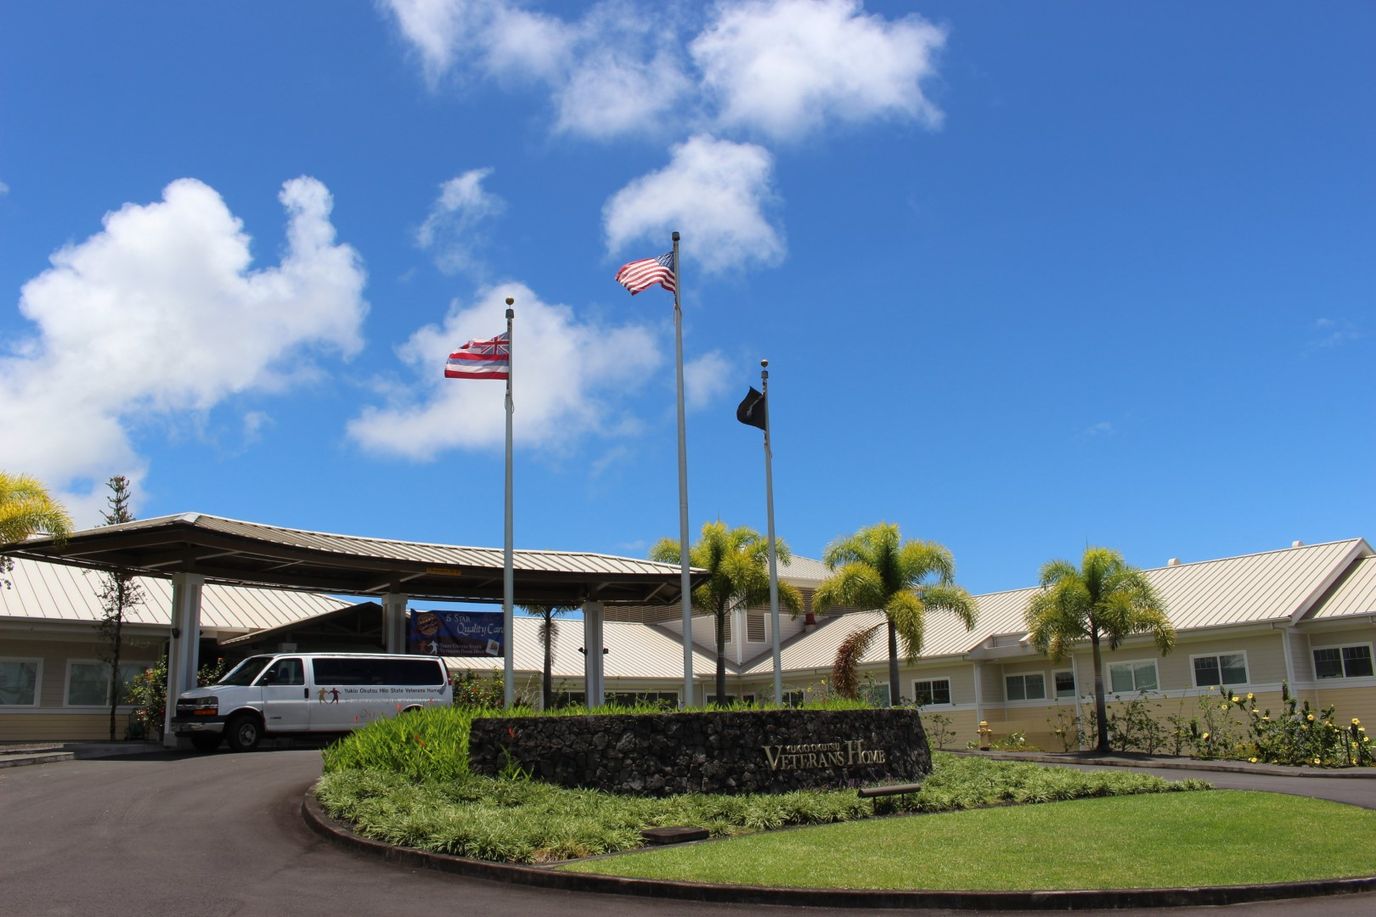
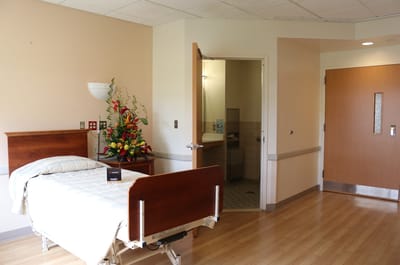
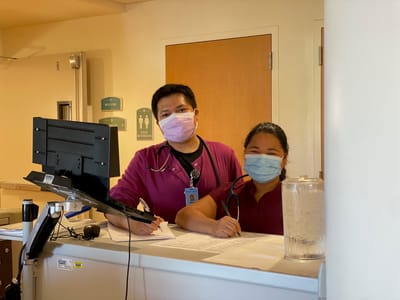
Conveniently located near Hilo Benioff Medical Center and Wailuku River State Park in Hilo, HI, Yukio Okutsu State Veterans Home is a distinct community that offers veterans care. Featuring different levels of care, including skilled nursing, respite, and hospice care, the community strives to meet Veterans’ unique needs. Here, residents also enjoy a maintenance-free lifestyle with a kind and highly skilled team helping with their daily living activities and household chores 24/7.

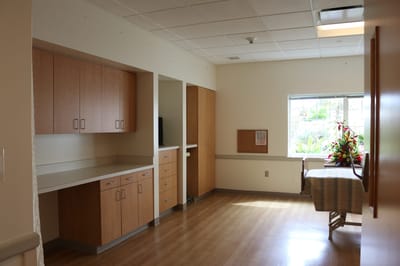
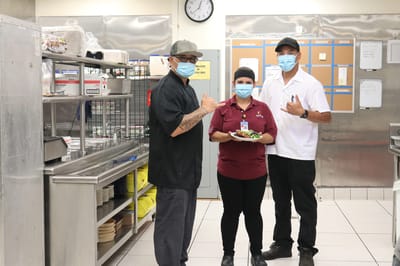
Activities are carefully curated according to residents’ interests and strengths to maximize enjoyment and wellness. With delicious and well-balanced dining options, residents can rest assured of having the finest dining experience that satisfy their dietary needs and preferences. The community also provides physical, occupational, and speech therapy to enhance residents’ living experiences. Veterans ease their worries and receive the utmost care they deserve amidst the community’s friendly setting and welcoming spaces.

Quality ratings

Measured by Centers for Medicare & Medicaid Services (CMS)

Overall rating Info The Overall CMS Rating combines results from health inspections, staffing levels and quality measures. Health inspections carry the most weight. Staffing and quality scores can increase or decrease the final rating based on performance compared to state and national standards.
▲ 16.3% Above HI avg. ▲ 16.3% Above HI avg.HI average: 3.4Click the badge to see the full State ranking.Click here to see the full State ranking.
Health Inspection Info Based on the results of the facility's three most recent standard inspections and any complaint investigations. CMS reviews the number, scope, and severity of deficiencies, with more recent findings weighted more heavily.
▲ 4.2% Above HI avg. ▲ 4.2% Above HI avg.HI average: 2.9Click the badge to see the full State ranking.Click here to see the full State ranking.
Staffing Info Measures average nursing staff hours per resident per day, including Registered Nurses (RNs) and total nursing staff. Ratings are adjusted based on the level of care residents require and are compared to state and national benchmarks.
At HI avg. At HI avg.HI average: 4.0Click the badge to see the full State ranking.Click here to see the full State ranking.
Quality Measures Info Based on clinical and physical health indicators reported to CMS, such as hospital readmissions, falls, pressure ulcers, and improvements in mobility. These measures reflect how well residents' health needs are being managed.
▲ 18.5% Above HI avg. ▲ 18.5% Above HI avg.HI average: 4.2Click the badge to see the full State ranking.Click here to see the full State ranking.

Staffing hours breakdown

Info Daily nursing hours per resident by staff type, reported to CMS. Higher is generally better — compare this facility to state and national averages to see where staffing stands.

Hours per resident per day — compared to Hawaii state averages

Total nursing care / resident Info This home is ranked 11th out of 33 homes in Hawaii for nurse hours. Total adjusted nursing hours per resident per day, combining RN, LPN, and aide time. CMS adjusts this for case-mix so facilities can be fairly compared.
4h 40m per day
Rank #11 / 33Nurse hours — State benchmarkedThis home is ranked 11th out of 33 homes in Hawaii. Shows adjusted nurse hours per resident per day benchmarked to the Hawaii average, with a ranking across 33 Hawaii facilities. More hours mean more direct care. The national average is about 3.5 hrs; below 3.0 is a red flag.Rankings are based only on facilities in Hawaii that report data for that category. Facilities without available data are excluded from the ranking.Click the rank badge to see the full State ranking.Click here to see the full State ranking.
This facility Hawaii avg (4h 12m per day)
vs Hawaii avg
+11%

3 of 6 metrics below state avg

Standout metric LPN / LVN is +49% above state avg
Staff typeHours / Day / Residentvs state avg
Registered Nurse (RN) Info RNs hold the highest nursing license and can assess residents, interpret test results, and direct care plans. More RN hours per day often signals stronger clinical oversight and faster response to health changes. 1h 12m per day ▼ 27% State avg: 1h 38m per day · National avg: 41m per day
LPN / LVN Info Licensed Practical Nurses (LPNs) or Licensed Vocational Nurses (LVNs) deliver routine hands-on care — medication administration, wound dressing, and monitoring vital signs. They work under RN supervision and make up a large share of daily bedside care. 31m per day ▲ 49% State avg: 21m per day · National avg: 52m per day
Nurse Aide Info Certified Nurse Aides (CNAs) provide the most direct day-to-day assistance: bathing, dressing, feeding, and mobility. Nurse aide hours are typically the largest staffing category and directly affect residents' quality of life. 3h 16m per day ▲ 19% State avg: 2h 44m per day · National avg: 2h 21m per day
Weekend Total Nursing Info Combined nursing hours (RN + LPN + Nurse Aide) per resident per day on weekends. Staffing often drops on weekends — this figure reveals whether the facility maintains adequate coverage outside of weekday hours. 4h 25m per day ▲ 5% State avg: 4h 11m per day · National avg: 3h 26m per day
Physical Therapist Info Hours per resident per day provided by licensed Physical Therapists (PTs) or PT Assistants. PT services help residents recover mobility after injury or illness and are especially important for post-acute (short-stay) rehabilitation. 3m per day ▼ 32% State avg: 5m per day · National avg: 4m per day
Weekend RN Info Registered nurse hours specifically on weekends. Facilities sometimes reduce RN presence on Saturdays and Sundays — a low weekend RN figure compared to weekday hours can indicate reduced clinical oversight when most administrative staff are absent. 1h 2m per day ▼ 16% State avg: 1h 14m per day · National avg: 29m per day

Capacity and availability

This home usually has availability

Lower occupancy than the Hawaii average: 74.2%
Occupancy rate
62.4% Rank #23 / 28Occupancy rate — State benchmarkedThis home is ranked 23rd out of 28 homes in Hawaii. Shows this facility's occupancy rate versus the Hawaii average, with its Statewide rank out of 28. Higher occupancy signals strong local demand and financial stability.Rankings are based only on facilities in Hawaii that report data for that category. Facilities without available data are excluded from the ranking.Click the rank badge to see the full State ranking.Click here to see the full State ranking.
Avg. Length of Stay
228 days
Bed community size
95-bed community Rank #16 / 87Bed count — State benchmarkedThis home is ranked 16th out of 87 homes in Hawaii. Shows this facility's certified or reported bed count compared to other Hawaii facilities. Larger communities may offer more amenities, programs, and on-site services for residents and families.Rankings are based only on facilities in Hawaii that report data for that category. Facilities without available data are excluded from the ranking.Click the rank badge to see the full State ranking.Click here to see the full State ranking.
A larger shared setting that may offer more common spaces and organized community services.
Years in operation
21 years in operation Rank #17 / 44Years in operation — State benchmarkedThis home is ranked 17th out of 44 homes in Hawaii. Shows how long this facility has been in operation compared to other Hawaii facilities. Longer operating histories may benefit residents, families, and staff.Rankings are based only on facilities in Hawaii that report data for that category. Facilities without available data are excluded from the ranking.Click the rank badge to see the full State ranking.Click here to see the full State ranking.
A longer operating history, which may indicate experience navigating regulations and delivering ongoing care.
Walk Score
Walk Score: 9 / 100 Rank #158 / 178Walk Score — State benchmarkedThis home is ranked 158th out of 178 homes in Hawaii. Shows how walkable this facility's neighborhood is compared to the average Walk Score across Hawaii facilities. Higher scores benefit residents, families, and staff.Rankings are based only on facilities in Hawaii that report data for that category. Facilities without available data are excluded from the ranking.Click the rank badge to see the full State ranking.Click here to see the full State ranking.
Car-dependent. Most errands require a car, with limited nearby walkable options.

About this community

License Details

CMS Certification Number125058
AccreditationsVA and Medicare/Medicaid certified

Staffing

Key information about the people who lead and staff this community.

Leadership

ContactMr. Wesley Rogers, Regional Vice President

Payment & Insurance

2 services
Accept Medicaid
Accept Medicare

Therapy & Rehabilitation

2 services
Rehabilitation Services
Respite Care

Staffing & Medical

1 service
24-Hour Staffing

Amenities & Lifestyle

Activitiessocial visits, reminiscence visits, games, special themed holiday activities
Specific ProgramsPost-Acute Rehabilitation, 24-Hour Skilled Nursing, Hospice/End of Life Care, Assistance to Medical Appointments, Community Outings, Personalized Activities, Dining Services, Veteran Camaraderie
Touring HoursMonday-Friday: 8:00 AM - 5:00 PM, except Federal and Hawai’i state holidays

Contact Yukio Okutsu State Veterans Home

Inspection History

In Hawaii, the Department of Health, Office of Health Care Assurance performs regular inspections and unannounced surveys to verify that healthcare facilities maintain high standards of resident care.

Since 2022 · 4 years of data 37 deficiencies

Inspection Scorecard Info This scorecard compares key inspection, deficiency, and complaint metrics at this facility against the Hawaii state average. Metrics rated ≥15% worse than average are highlighted in red; those ≥15% better are highlighted in green.

Since 2022 vs. Hawaii state average
Overall vs. HI average 2 Worse Metrics worse than Hawaii average:
• Total deficiencies (48% above)
• Deficiencies per year (48% above)
0 Better No metrics in this bucket.
Latest Inspection November 15, 2024 Complaint Investigation

Deficiencies Info Deficiencies are formal regulatory issues recorded during state inspections.

This FacilityHI Averagevs. HI Avg
Total deficiencies Info Formal regulatory issues recorded by inspectors across all inspection types. 3725 This facility has 48% more total deficiencies than a typical Hawaii nursing home (37 vs. HI avg 25).↑ 48% worse
Deficiencies per year Info Average deficiencies per year since 2022. 9.36.3 This facility has 48% more deficiencies per year than a typical Hawaii nursing home (9.3 vs. HI avg 6.3).↑ 48% worse

Inspection Reports Summary Info An editor-reviewed summary of the themes and findings across this facility's recent inspection reports.

  • November 15, 2024 complaint investigation found delayed nursing response to respiratory distress, risking more than minimal harm to Resident R166.
  • November 15, 2024 annual inspection cited 10 deficiencies including resident dignity violations, medication errors, bowel and dialysis care failures, and food service sanitation issues.
  • October 30, 2023 complaint investigation substantiated a mechanical lift malfunction causing multiple fractures, with subsequent mandatory staff retraining implemented.

Health Inspection History

Inspections since 2022
Total health inspections 3

Hawaii average 4.4


Last Health inspection on Nov 2024

Total health citations
39 Rank #21 / 34Health citations — State benchmarkedThis home is ranked 21st out of 34 homes in Hawaii. Shows this facility's total health deficiency citations benchmarked to the Hawaii State average, with a ranking across all 34 HI facilities. Lower citation counts earn a better rank.Rankings are based only on facilities in Hawaii that report data for that category. Facilities without available data are excluded from the ranking.Click the rank badge to see the full State ranking.Click here to see the full State ranking.

Hawaii average 35.5

Citations per inspection
13 Rank #33 / 34Citations per inspection — State benchmarkedThis home is ranked 33rd out of 34 homes in Hawaii. Shows average deficiency citations per CMS inspection for this facility versus the Hawaii mean across 34 facilities with citation data. Lower is better.Rankings are based only on facilities in Hawaii that report data for that category. Facilities without available data are excluded from the ranking.Click the rank badge to see the full State ranking.Click here to see the full State ranking.

Hawaii average 8.23


Health citations are formal notices following inspections when they fail to comply with safety and care standards.

38 of 39 citations resulted from standard inspections; and 1 of 39 resulted from complaint investigations.

Breakdown of citation severity (last 4 years)
Critical health citations
0
100% better than Hawaii average

Hawaii average: 0.1


Serious health citations
3
200% worse than Hawaii average

Hawaii average: 1

0 critical citations Hawaii average: 0.1

3 serious citations Hawaii average: 1

36 moderate citations Hawaii average: 34.2

0 minor citations Hawaii average: 0.1
Citations history (last 4 years)
Administration moderate citation Nov 15, 2024
Corrected

Infection Control moderate citation Nov 15, 2024
Corrected

Nursing Services moderate citation Nov 15, 2024
Corrected

Nutrition moderate citation Nov 15, 2024
Corrected

Staffing Data

Reporting period: October 1 – December 31, 2025 (Q4 2025). Source: CMS Payroll-Based Journal report.

Total staff 90
Employees 70
Contractors 20
Staff to resident ratio 5.63 : 1
240% more staff per resident than Hawaii average
Hawaii average ratio: 1.65 : 1 Hawaii average ratio: 1.65 : 1See full Hawaii ranking
Avg staff/day 43
Average shift 7.9 hours
0% compared with Hawaii average
Hawaii average: 7.8 hours Hawaii average shift: 7.8 hoursSee full Hawaii ranking
Total staff hours (quarter) 31,129

Nursing staff breakdown

Q4 2025 · Oct 1 – Dec 31 More info This data comes from the CMS Payroll-Based Journal report covering October 1 – December 31, 2025.
Registered Nurse

Manages medical care and health needs.

RN Staff Info All 14 RN Staff are full-time employees. No contractors work on this role. 14
Average shift length Info Average shift length. Calculated as total hours divided by days worked and average staff per day. 8 hours
Licensed Practical Nurse

Assists with medical care and medications.

LPN Staff Info 4 total: 1 full-time employee and 3 contractors. 4
Average shift length Info Average shift length. Calculated as total hours divided by days worked and average staff per day. 8.6 hours
Certified Nursing Assistant

Helps with daily care and mobility.

CNA Staff Info All 49 CNA Staff are full-time employees. No contractors work on this role. 49
Average shift length Info Average shift length. Calculated as total hours divided by days worked and average staff per day. 7.9 hours

Contractor staffing

Q4 2025 · Oct 1 – Dec 31 More info This data comes from the CMS Payroll-Based Journal report covering October 1 – December 31, 2025.

Total hours from contractors

8.9%

2,767 contractor hours this quarter

Respiratory Therapy Technician: 5 Physical Therapy Assistant: 5 Speech Language Pathologist: 3 Licensed Practical Nurse: 3 Physical Therapy Aide: 2 Qualified Social Worker: 2

Staff by category

Q4 2025 · Oct 1 – Dec 31 More info This data comes from the CMS Payroll-Based Journal report covering October 1 – December 31, 2025.
Certified Nursing Assistant4904919,40692100%7.9
Registered Nurse140145,76192100%8
Licensed Practical Nurse1341,7398896%8.6
RN Director of Nursing3031,3686672%8
Clinical Nurse Specialist2029046166%8
Speech Language Pathologist0335267683%5.4
Nurse Practitioner1014645863%8
Respiratory Therapy Technician0553395459%5.9
Physical Therapy Aide0222944852%6.1
Physical Therapy Assistant0551954043%3.9
Qualified Social Worker0221362729%4.4
49 Certified Nursing Assistant
% of Days 100%
14 Registered Nurse
% of Days 100%
4 Licensed Practical Nurse
% of Days 96%
3 RN Director of Nursing
% of Days 72%
2 Clinical Nurse Specialist
% of Days 66%
3 Speech Language Pathologist
% of Days 83%
1 Nurse Practitioner
% of Days 63%
5 Respiratory Therapy Technician
% of Days 59%
2 Physical Therapy Aide
% of Days 52%
5 Physical Therapy Assistant
% of Days 43%
2 Qualified Social Worker
% of Days 29%

Penalties and fines

Includes penalties issued in 2023

Federal penalties imposed by CMS for regulatory violations, including civil money penalties (fines) and denials of payment for new Medicare/Medicaid admissions.

Source: CMS Penalties Database (Data as of Jan 2026)

Total fines amount $13K Rank #24 / 34Federal fines — State benchmarkedThis home is ranked 24th out of 34 homes in Hawaii. Shows this facility's cumulative CMS federal fine dollars versus the Hawaii average among facilities with fines, and where it ranks among 34 facilities in the pool. Lower total dollars mean a better rank.Rankings are based only on facilities in Hawaii that report data for that category. Facilities without available data are excluded from the ranking.Click the rank badge to see the full State ranking.Click here to see the full State ranking.
65% lower than Hawaii average

Hawaii average: $38K

Number of fines 1
34% fewer fines than Hawaii average

Hawaii average: 1.5

Payment Denials Info Serious action where Medicare and/or Medicaid temporarily stops payments for new residents until issues are fixed. 0
100% fewer payment denials than Hawaii average

Hawaii average: 0.1

Fines amount comparison
This facility $13K
Hawaii average $38K
Penalty History

Penalties are imposed by CMS for violations of federal nursing home regulations.

1 penalty in the past 3 years

Oct 30, 2023 · $13K

Civil Money Penalty Info Fines imposed for noncompliance, which can be assessed per day or per instance of violation. Oct 30, 2023
$13K

Last updated: Jan 2026

Quality of care over time

These measures show how residents usually do over time at this home, based on health outcomes and preventive care.

High-risk clinical events score Info A composite score based on pressure ulcers, falls with injury, weight loss, walking ability decline, and activities of daily living decline. 9.0
12% better than Hawaii average

Hawaii average: 10.2

Functional decline score Info A composite score based on activities of daily living decline, walking ability decline, and incontinence. 15.4
23% better than Hawaii average

Hawaii average: 20.0

Long-stay resident measures
Significantly above average Hawaii avg: 4.4 Info CMS star rating based on long-stay quality measure performance. 5 stars = significantly above average, 1 star = significantly below average.
Need for Help with Daily Activities Increased Info Percent of long-stay residents whose need for help with daily activities has increased 11.7%
33% better than Hawaii average

Hawaii average: 17.6%

Walking Ability Worsened Info Percent of long-stay residents whose ability to move independently worsened 20.1%
22% better than Hawaii average

Hawaii average: 25.8%

Low Risk Residents with Bowel/Bladder Incontinence Info Percent of low risk long-stay residents who lose control of their bowels or bladder 14.3%
22% better than Hawaii average

Hawaii average: 18.3%

Falls with Major Injury Info Percent of long-stay residents experiencing one or more falls with major injury 3.9%
82% worse than Hawaii average

Hawaii average: 2.1%

High Risk Residents with Pressure Ulcers Info Percent of long-stay high risk residents with pressure ulcers 3.5%
In line with Hawaii average

Hawaii average: 3.6%

Urinary Tract Infection Info Percent of long-stay residents with a urinary tract infection 1.7%
28% better than Hawaii average

Hawaii average: 2.4%

Lost Too Much Weight Info Percent of long-stay residents who lose too much weight 5.8%
23% worse than Hawaii average

Hawaii average: 4.7%

Depressive Symptoms Info Percent of long-stay residents who have depressive symptoms 11.0%
650% worse than Hawaii average

Hawaii average: 1.5%

Antipsychotic Use Info Percent of long-stay residents who received an antipsychotic medication 10.1%
In line with Hawaii average

Hawaii average: 10.1%

Pneumococcal Vaccine Info Percent of long-stay residents assessed and appropriately given the pneumococcal vaccine 94.0%
In line with Hawaii average

Hawaii average: 96.3%

Influenza Vaccine Info Percent of long-stay residents assessed and appropriately given the seasonal influenza vaccine 91.8%
In line with Hawaii average

Hawaii average: 95.4%

Hospitalizations per 1,000 days Info Number of hospitalizations per 1,000 long-stay resident days. 0.37
72% better than Hawaii average

Hawaii average: 1.34

ED visits per 1,000 days Info Number of outpatient emergency department visits per 1,000 long-stay resident days. 0.00
100% better than Hawaii average

Hawaii average: 0.89

Short-stay resident measures
Below average Hawaii avg: 3.0 Info CMS star rating based on short-stay quality measure performance. 5 stars = much above average, 1 star = much below average.
Pneumococcal Vaccine Info Percent of short-stay residents assessed and appropriately given the pneumococcal vaccine 79.6%
5% worse than Hawaii average

Hawaii average: 83.4%

Antipsychotic medication increase Info Percent of short-stay residents who newly received an antipsychotic medication 6.6%
469% worse than Hawaii average

Hawaii average: 1.2%

Influenza Vaccine Info Percent of short-stay residents assessed and appropriately given the seasonal influenza vaccine 84.4%
In line with Hawaii average

Hawaii average: 84.7%

Re-hospitalized after SNF stay Info Percentage of short-stay residents who were re-hospitalized after their nursing home admission. 25.6%
31% worse than Hawaii average

Hawaii average: 19.6%

Emergency department visits Info Percentage of short-stay residents who had an outpatient emergency department visit. 16.5%
51% worse than Hawaii average

Hawaii average: 10.9%

Falls with major injury Info Percentage of SNF residents who experience falls with major injury during their stay. 4.6%
491% worse than Hawaii average

Hawaii average: 0.8%

Successful return to home or community Info Rate of successful return to home or community from a skilled nursing facility. 58.8%
16% better than Hawaii average

Hawaii average: 50.6%

Breakdown by payment type

Medicare

27% of new residents, usually for short-term rehab.

Typical stay 28 days

Private pay

69% of new residents, often for short stays.

Typical stay 7 - 8 months

Medicaid

4% of new residents, often for long-term daily care.

Typical stay 5 years

Facility Characteristics

Source: CMS Long-Term Care Facility Characteristics (Data as of Jan 2026)

Total residents 16
Medicaid
16
100% of residents
Programs & Services
Residents Group

Residents meet regularly to discuss policies, care quality, and activities

Active Resident Council

Organized group of residents that meets regularly to discuss facility policies, quality of life, and activities.

Finances and operations

Based on CMS SNF Cost Report for fiscal year ending in 06/2024.

Government
Operated by city authorities.
Net patient revenue Info Net patient revenue — what the home actually collects for resident care, after contractual allowances, bad debt and discounts are subtracted from its gross charges (CMS cost report, Worksheet G-3). It covers resident care only; money the home earns from other sources is shown separately as "Other income."
$12.5M
Net patient income Info Net patient income: net patient revenue minus the home's total operating expenses. A positive figure means it earns more from resident care than it spends to deliver it; a negative figure means the opposite. It excludes non-operating "other income."
-$1.8M
Government Operated by city authorities.
Net patient revenue Info Net patient revenue — what the home actually collects for resident care, after contractual allowances, bad debt and discounts are subtracted from its gross charges (CMS cost report, Worksheet G-3). It covers resident care only; money the home earns from other sources is shown separately as "Other income."
$12.5M Rank #20 / 29Revenue — State benchmarkedThis home is ranked 20th out of 29 homes in Hawaii. Shows this facility's annual revenue compared to the Hawaii average. Higher revenue generally means more resources for staffing and capital — read alongside Payroll %.Rankings are based only on facilities in Hawaii that report data for that category. Facilities without available data are excluded from the ranking.Click the rank badge to see the full State ranking.Click here to see the full State ranking.
Net patient income Info Net patient income: net patient revenue minus the home's total operating expenses. A positive figure means it earns more from resident care than it spends to deliver it; a negative figure means the opposite. It excludes non-operating "other income."
-$1.8M
Other income Info Money the home earns outside of resident care — such as investments, grants, rentals and other non-operating sources (CMS cost report, Worksheet G-3). It is tracked separately from net patient revenue: it is not part of that figure, and it is not included in net patient income.
$1.4M
Payroll costs Info Staff salaries plus wage-related costs — benefits such as payroll taxes, health insurance and retirement — from the home's own accounting records (CMS cost report, Worksheet A). Contract or agency labor is counted separately, under other operating costs. Rank #17 / 29Payroll — State benchmarkedThis home is ranked 17th out of 29 homes in Hawaii. Shows total annual staff payroll benchmarked to the Hawaii average. Higher payroll investment relative to peers often signals better staffing and less reliance on cheaper contract labor.Rankings are based only on facilities in Hawaii that report data for that category. Facilities without available data are excluded from the ranking.Click the rank badge to see the full State ranking.Click here to see the full State ranking.
$7.7M 61.4% of net patient revenue Info Payroll as a share of revenue: staff salaries and wage-related benefits divided by net patient revenue. A higher figure means more of each revenue dollar goes to staff pay. Rank #8 / 29Payroll % — State benchmarkedThis home is ranked 8th out of 29 homes in Hawaii. Shows payroll as a percentage of revenue versus the Hawaii average. Well-run Hawaii facilities typically land around 52–61% — the top third Statewide. Below 25% may signal understaffing or heavy agency use — read with Staffing ratings.Rankings are based only on facilities in Hawaii that report data for that category. Facilities without available data are excluded from the ranking.Click the rank badge to see the full State ranking.Click here to see the full State ranking.
Other operating costs Info Everything it costs to run the home apart from payroll — food, utilities, supplies, maintenance, contract labor and administration. Calculated as total operating expense minus payroll (staff salaries and wage-related benefits).
$6.6M
Total costs Info The home's total operating expense for the year — all the costs of running it, salaries included (CMS cost report, Worksheet G-3).
$14.3M

What does this home offer?

Housing options icon

Housing Options: Private / Semi-Private Rooms

Building type icon
Building type icon

Building Type: 2-story

Transportation services icon

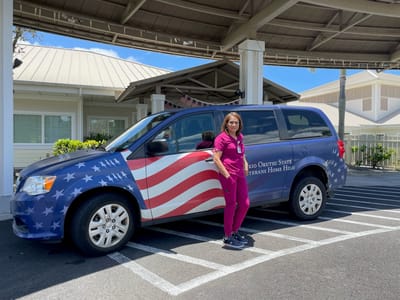
Transportation Services

Social and recreational activities icon

Social and Recreational Activities

Who this home usually serves

TYPE OF STAY

Primarily short stays

Residents typically stay for brief periods, with frequent admissions and discharges throughout the year.

Most new residents arrive under private pay (69% of admissions), and a typical private pay stay runs around 7 - 8 months.

Admissions
90 total

Coverage residents most often arrive under.

Medicare 27%
Private pay 69%
Medicaid 4%
Discharges
95 total

Coverage residents most often leave under.

Medicare 21%
Private pay 72%
Medicaid 7%

Places of interest near Yukio Okutsu State Veterans Home

Address 1.8 miles from city center Info Estimated distance in miles from Hilo's city center to Yukio Okutsu State Veterans Home's address, calculated via Google Maps.

Calculate Travel Distance to Yukio Okutsu State Veterans Home

Add your location

Address

Compare Nursing Homes around Hilo

The information below is reported by the Hawaii Department of Health, Office of Health Care Assurance.

4 facilities compared · CMS & HI Dept. of Health data

Yukio Okutsu State Veterans Home
NH
HC
RC
Hilo (Piʻihonua)
95
Facility 95
HI AVG 43
Rank #16 / 87
62.4%
Facility 62.4%
HI AVG 74.2%
Rank #23 / 28
-16%
4.67
Facility 4.67
HI AVG 4.20
Rank #11 / 33
-24%+11%
$13.0k
Facility $13.0k
HI AVG $43.4k
Rank #24 / 34
39
Facility 39
HI AVG 35.5
Rank #21 / 34
13.0
Facility 13.0
HI AVG 8.2
Rank #33 / 34
365-
9
Facility 9
HI AVG 49
Rank #158 / 178
East Hawaii State Veterans Home
$12.5M
Facility $12.5M
HI AVG $20.8M
Rank #20 / 29
$7.7M
Facility $7.7M
HI AVG $7.1M
Rank #17 / 29
61.4%
Facility 61.4%
HI AVG 38.9%
Rank #8 / 29
125058
Legacy Hilo Rehabilitation & Nursing Center
NH
ADC
MC
NC
Hilo (Kaumana)
100
Facility 100
HI AVG 43
Rank #13 / 87
77.8%
Facility 77.8%
HI AVG 74.2%
Rank #16 / 28
+5%
3.29
Facility 3.29
HI AVG 4.20
Rank #30 / 33
-24%-22%
$0
Facility $0
HI AVG $43.4k
Rank #1 / 34
27
Facility 27
HI AVG 35.5
Rank #15 / 34
6.8
Facility 6.8
HI AVG 8.2
Rank #13 / 34
-80A+
7
Facility 7
HI AVG 49
Rank #166 / 178
Jennifer Pearce
$13.3M
Facility $13.3M
HI AVG $20.8M
Rank #15 / 29
$6.1M
Facility $6.1M
HI AVG $7.1M
Rank #23 / 29
46.1%
Facility 46.1%
HI AVG 38.9%
Rank #25 / 29
125065
Hale Anuenue Restorative Care
NH
Hilo
120
Facility 120
HI AVG 43
Rank #9 / 87
68.7%
Facility 68.7%
HI AVG 74.2%
Rank #21 / 28
-7%
3.78
Facility 3.78
HI AVG 4.20
Rank #22 / 33
-27%-10%
$0
Facility $0
HI AVG $43.4k
Rank #1 / 34
31
Facility 31
HI AVG 35.5
Rank #16 / 34
6.2
Facility 6.2
HI AVG 8.2
Rank #11 / 34
295-
7
Facility 7
HI AVG 49
Rank #166 / 178
Gail Kahookele
$13.7M
Facility $13.7M
HI AVG $20.8M
Rank #16 / 29
$7.3M
Facility $7.3M
HI AVG $7.1M
Rank #15 / 29
53.6%
Facility 53.6%
HI AVG 38.9%
Rank #14 / 29
125045
Life Care Center of Hilo
NH
NC
Hilo
252
Facility 252
HI AVG 43
Rank #1 / 87
81.7%
Facility 81.7%
HI AVG 74.2%
Rank #13 / 28
+10%
3.38
Facility 3.38
HI AVG 4.20
Rank #29 / 33
-16%-20%
$0
Facility $0
HI AVG $43.4k
Rank #1 / 34
40
Facility 40
HI AVG 35.5
Rank #23 / 34
8.0
Facility 8.0
HI AVG 8.2
Rank #23 / 34
-224-
11
Facility 11
HI AVG 49
Rank #153 / 178
Lemapu Lemanua
$29.4M
Facility $29.4M
HI AVG $20.8M
Rank #4 / 29
$15.7M
Facility $15.7M
HI AVG $7.1M
Rank #3 / 29
53.5%
Facility 53.5%
HI AVG 38.9%
Rank #22 / 29
125040

Financial Assistance for
Nursing Home in Hawaii

Yukio Okutsu State Veterans Home is located in Hilo, Hawaii.
Here are the financial assistance programs available to residents in Hawaii.

Get Financial aid guidance

QUEST Integration

Hawaii Medicaid QUEST Integration

Age 65+ or disabled
General Hawaii resident, Medicaid-eligible, long-term care need.
Income Limits (2025) ~$2,829/month 300% FBR, individual
Asset Limits $2,000 (individual), $3,000 (couple).
HI

High cost of living adjustments.

Benefits
In-home care (6-8 hours/day) Nursing home Respite (240 hours/year) Medical services

Kupuna Care

Hawaii Kupuna Care

Age 60+
General Hawaii resident, unable to perform 2+ ADLs.
Income Limits No strict limit; prioritizes low-income.
Asset Limits Not applicable.
HI

Limited funding; island-specific delivery.

Benefits
In-home care (3-5 hours/week) Adult day care (~$70/day) Transportation (~5 trips/month)

Program of All-Inclusive Care for the Elderly (PACE)

Hawaii Medicaid PACE

Age 55+
General Hawaii resident, nursing home-level care need, safe with PACE support.
Income Limits (2025) ~$2,829/month 300% FBR
Asset Limits $2,000 (individual), $3,000 (couple).
HI

Limited to Oahu (e.g., Maluhia in Honolulu); few providers.

Benefits
Personal care (5-7 hours/day) Medical care Meals Transportation Therapy Respite

Medicare Savings Program (MSP)

Hawaii Medicare Savings Program

Age 65+ or disabled
General Hawaii resident, Medicare Part A/B.
Income Limits (2025) ~$2,510/month (QMB), ~$3,380/month (SLMB), ~$3,598/month (QI)—individual, adjusted annually.
Asset Limits $9,430 (individual), $14,130 (couple).
HI

Three tiers; no waitlist.

Benefits
Covers Part B premiums ($174.70/month) Deductibles ($240/year) Copays (~20%)

National Family Caregiver Support Program (NFCSP) Respite

Hawaii NFCSP Respite Care

Age
General Caregivers of 60+ needing care or 55+ caregivers of others; Hawaii resident; functional needs (2+ ADLs).
Income Limits (2025) Prioritizes ~$24,980/year (individual); no strict cap.
Asset Limits Not assessed; need-based.
HI

Four county AAAs; prioritizes low-income.

Benefits
Respite (4-6 hours/week or 5 days/year) Adult day care ($80/day) Counseling

VA Aid and Attendance (A&A) and Housebound Benefits

Hawaii VA Aid and Attendance/Housebound

Age 65+ or disabled veteran/surviving spouse
General Hawaii resident, wartime service, need for aid with ADLs (A&A) or homebound status.
Income Limits (2025) Net income < ~$1,984/month (veteran with dependent, A&A); pension offsets income.
Asset Limits ~$155,356 2025 net worth limit
HI

Applies statewide; high demand due to veteran population.

Benefits
Cash (~$1,433-$2,642/month veteran, ~$951-$1,318 spouse) for care costs (e.g., in-home, assisted living)

Senior Companion Program (SCP)

Hawaii Senior Companion Program

Age
General Volunteers: 55+, low-income, Hawaii resident, able to work 20 hours/week. Recipients: Frail elders needing companionship.
Income Limits (2025) Volunteers: ~$24,980/year (200% FPL); recipients: no limit.
Asset Limits Not specified for volunteers; need-based for recipients.
HI

Statewide; managed by DHS Social Services.

Benefits
Volunteers paid ~$4/hour for companionship (~20 hours/week); recipients get free support (~4-6 hours/week)

Frequently Asked Questions about Yukio Okutsu State Veterans Home

What neighborhood is Yukio Okutsu State Veterans Home in?

Yukio Okutsu State Veterans Home is in the Piʻihonua neighborhood of Hilo.

Is Yukio Okutsu State Veterans Home in a walkable area?

Yukio Okutsu State Veterans Home has a walk score of 9. Car-dependent. Most errands require a car, with limited nearby walkable options.

What is the occupancy rate at Yukio Okutsu State Veterans Home?

Yukio Okutsu State Veterans Home's occupancy is 62.4%.

Is Yukio Okutsu State Veterans Home a government-operated facility?

Yukio Okutsu State Veterans Home is a government-operated nursing facility in HI.

Are there photos of Yukio Okutsu State Veterans Home?

Yes — there are 10 photos of Yukio Okutsu State Veterans Home in the photo gallery on this page.

What is the address of Yukio Okutsu State Veterans Home?

Yukio Okutsu State Veterans Home is located at 1180 Waianuenue Ave, Hilo, HI 96720.

What is the phone number of Yukio Okutsu State Veterans Home?

(808) 961-1500 will put you in contact with the team at Yukio Okutsu State Veterans Home.

Guides for Better Senior Living

Care Cost Calculator: See Prices in Your Area

Nursing Home Data Explorer

Don’t Wait Too Long: 7 Red Flag Signs Your Parent Needs Assisted Living Now

The True Cost of Assisted Living in 2025 – And How Families Are Paying For It

Understanding Senior Living Costs: Pricing Models, Discounts & Financial Assistance