LifePath Hospice Sun City Center Hospice House
Nursing Home & Hospice Care · Ruskin, FL
CMS overall rating Info CMS (the Centers for Medicare & Medicaid Services) is the federal agency that rates nursing home quality. Its Overall Rating runs from 1 to 5 stars, combining health inspections, staffing, and quality measures, with inspections weighted most heavily.

LifePath Hospice Sun City Center Hospice House

Nursing Home & Hospice Care · Ruskin, FL
CMS overall rating Info CMS (the Centers for Medicare & Medicaid Services) is the federal agency that rates nursing home quality. Its Overall Rating runs from 1 to 5 stars, combining health inspections, staffing, and quality measures, with inspections weighted most heavily.
Calculator: See prices in your area
LifePath Hospice Sun City Center Hospice House accepts Medicaid, Medicare, and private pay.

Overview of Lifepath Hospice Sun City Center Hospice House

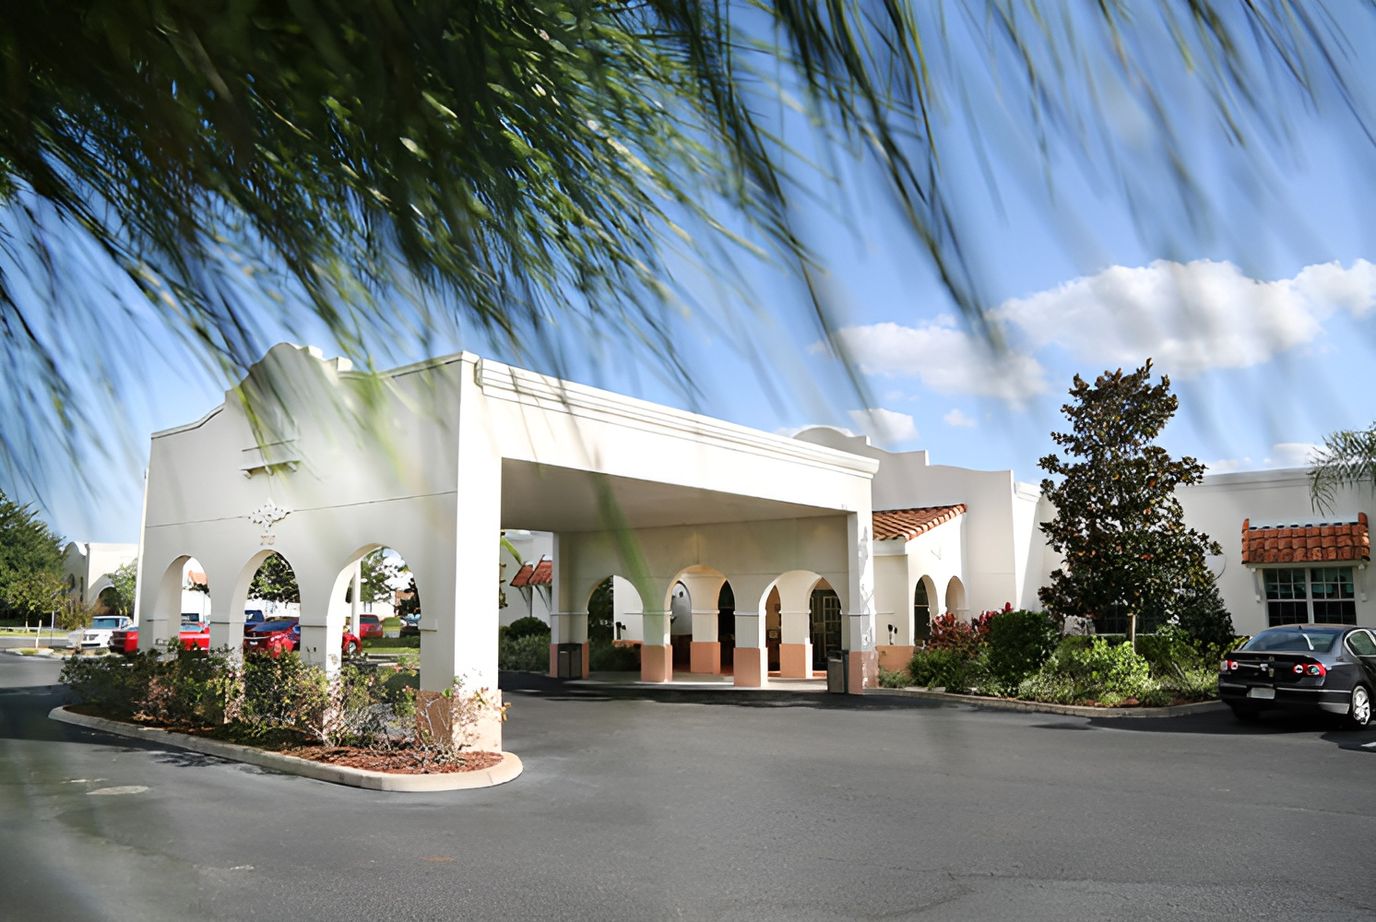
Tucked away in a serene area in Ruskin, FL, Lifepath Hospice Sun City Center Hospice House provides a healing and relaxing environment for residents needing hospice care. Residents and their families can rest assured knowing that a professional care team is always available to help their loved ones manage their pain and symptoms in a cozy, home-like environment. Their team also collaborates closely with residents’ families, supporters, and healthcare providers to ensure a seamless delivery of care and complete transparency.

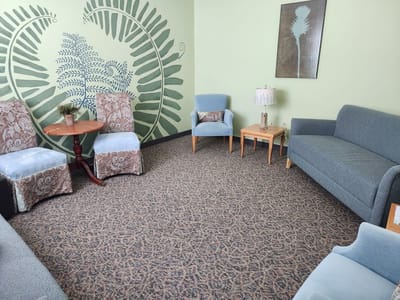
As end-of-life can be challenging for residents’ emotional well-being, the community also provides an array of services dedicated to supporting their residents’ holistic well-being, including emotional and spiritual care. They also feature a team of compassionate volunteers who can help residents with an array of things, such as recording life stories or providing relief to stressed caregivers for further comfort. Here at Lifepath Hospice Sun City Center Hospice House, they make end-of-life a comfortable journey for both residents and their loved ones.

Quality ratings

Measured by Centers for Medicare & Medicaid Services (CMS)

Overall rating Info The Overall CMS Rating combines results from health inspections, staffing levels and quality measures. Health inspections carry the most weight. Staffing and quality scores can increase or decrease the final rating based on performance compared to state and national standards.
▼ 68.5% Below FL avg. ▼ 68.5% Below FL avg.FL average: 3.2Click the badge to see the full State ranking.Click here to see the full State ranking.
Health Inspection Info Based on the results of the facility's three most recent standard inspections and any complaint investigations. CMS reviews the number, scope, and severity of deficiencies, with more recent findings weighted more heavily.
▼ 64.4% Below FL avg. ▼ 64.4% Below FL avg.FL average: 2.8Click the badge to see the full State ranking.Click here to see the full State ranking.
Staffing Info Measures average nursing staff hours per resident per day, including Registered Nurses (RNs) and total nursing staff. Ratings are adjusted based on the level of care residents require and are compared to state and national benchmarks.
▼ 11.3% Below FL avg. ▼ 11.3% Below FL avg.FL average: 3.4Click the badge to see the full State ranking.Click here to see the full State ranking.
Quality Measures Info Based on clinical and physical health indicators reported to CMS, such as hospital readmissions, falls, pressure ulcers, and improvements in mobility. These measures reflect how well residents' health needs are being managed.
▼ 1.4% Below FL avg. ▼ 1.4% Below FL avg.FL average: 4.1Click the badge to see the full State ranking.Click here to see the full State ranking.

Staffing hours breakdown

Info Daily nursing hours per resident by staff type, reported to CMS. Higher is generally better — compare this facility to state and national averages to see where staffing stands.

Hours per resident per day — compared to Florida state averages

Total nursing care / resident Info This home is ranked 91st out of 253 homes in Florida for nurse hours. Total adjusted nursing hours per resident per day, combining RN, LPN, and aide time. CMS adjusts this for case-mix so facilities can be fairly compared.
4h 8m per day
Rank #91 / 253Nurse hours — State benchmarkedThis home is ranked 91st out of 253 homes in Florida. Shows adjusted nurse hours per resident per day benchmarked to the Florida average, with a ranking across 253 Florida facilities. More hours mean more direct care. The national average is about 3.5 hrs; below 3.0 is a red flag.Rankings are based only on facilities in Florida that report data for that category. Facilities without available data are excluded from the ranking.Click the rank badge to see the full State ranking.Click here to see the full State ranking.
This facility Florida avg (4h 2m per day)
vs Florida avg
+2%

4 of 6 metrics below state avg

Standout metric LPN / LVN is +26% above state avg
Staff typeHours / Day / Residentvs state avg
Registered Nurse (RN) Info RNs hold the highest nursing license and can assess residents, interpret test results, and direct care plans. More RN hours per day often signals stronger clinical oversight and faster response to health changes. 33m per day ▼ 24% State avg: 44m per day · National avg: 41m per day
LPN / LVN Info Licensed Practical Nurses (LPNs) or Licensed Vocational Nurses (LVNs) deliver routine hands-on care — medication administration, wound dressing, and monitoring vital signs. They work under RN supervision and make up a large share of daily bedside care. 1h 0m per day ▲ 26% State avg: 47m per day · National avg: 52m per day
Nurse Aide Info Certified Nurse Aides (CNAs) provide the most direct day-to-day assistance: bathing, dressing, feeding, and mobility. Nurse aide hours are typically the largest staffing category and directly affect residents' quality of life. 2h 18m per day ■ Avg State avg: 2h 20m per day · National avg: 2h 20m per day
Weekend Total Nursing Info Combined nursing hours (RN + LPN + Nurse Aide) per resident per day on weekends. Staffing often drops on weekends — this figure reveals whether the facility maintains adequate coverage outside of weekday hours. 3h 24m per day ▼ 4% State avg: 3h 32m per day · National avg: 3h 27m per day
Physical Therapist Info Hours per resident per day provided by licensed Physical Therapists (PTs) or PT Assistants. PT services help residents recover mobility after injury or illness and are especially important for post-acute (short-stay) rehabilitation. 5m per day ▼ 19% State avg: 6m per day · National avg: 4m per day
Weekend RN Info Registered nurse hours specifically on weekends. Facilities sometimes reduce RN presence on Saturdays and Sundays — a low weekend RN figure compared to weekday hours can indicate reduced clinical oversight when most administrative staff are absent. 16m per day ▼ 51% State avg: 32m per day · National avg: 29m per day

Capacity and availability

This home usually has limited availability

Higher occupancy than the Florida average: 84.3%
Occupancy rate
93.1% Rank #63 / 258Occupancy rate — State benchmarkedThis home is ranked 63rd out of 258 homes in Florida. Shows this facility's occupancy rate versus the Florida average, with its Statewide rank out of 258. Higher occupancy signals strong local demand and financial stability.Rankings are based only on facilities in Florida that report data for that category. Facilities without available data are excluded from the ranking.Click the rank badge to see the full State ranking.Click here to see the full State ranking.
Avg. Length of Stay
86 days
Bed community size
132-bed community Rank #206 / 1074Bed count — State benchmarkedThis home is ranked 206th out of 1074 homes in Florida. Shows this facility's certified or reported bed count compared to other Florida facilities. Larger communities may offer more amenities, programs, and on-site services for residents and families.Rankings are based only on facilities in Florida that report data for that category. Facilities without available data are excluded from the ranking.Click the rank badge to see the full State ranking.Click here to see the full State ranking.
A larger shared setting that may offer more common spaces and organized community services.
Years in operation
43 years in operation
A longer operating history, which may indicate experience navigating regulations and delivering ongoing care.
Walk Score
Walk Score: 39 / 100 Rank #743 / 1486Walk Score — State benchmarkedThis home is ranked 743rd out of 1486 homes in Florida. Shows how walkable this facility's neighborhood is compared to the average Walk Score across Florida facilities. Higher scores benefit residents, families, and staff.Rankings are based only on facilities in Florida that report data for that category. Facilities without available data are excluded from the ranking.Click the rank badge to see the full State ranking.Click here to see the full State ranking.
Somewhat walkable. A few nearby services may be reachable on foot, but most trips require transportation.

Staffing

Key information about the people who lead and staff this community.

Leadership

ContactMs. Roxanne Riley, Executive Director

Payment & Insurance

2 services
Accept Medicaid
Accept Medicare

Therapy & Rehabilitation

2 services
Rehabilitation Services
Respite Care

Staffing & Medical

2 services
Doctor on Staff
24-Hour Staffing

Additional Services

3 services
Routine Hospice Care
Continuous Care
Inpatient Care

Amenities & Lifestyle

24 Patient Suites
Kitchenette
Quality Clinical Care
Specific ProgramsEmotional and Spiritual Care, Grief Services, Pediatric Programs, Veterans Support Services, Pet Peace of Mind
Operating HoursCare is provided 24 hours. Administrative office: Monday-Friday 8:00 a.m. – 5:00 p.m.; Saturday-Sunday Closed.

Contact LifePath Hospice Sun City Center Hospice House

Health Inspection History

Inspections since 2021
Total health inspections 4

Florida average 4.3


Last Health inspection on May 2025

Total health citations
18 Rank #129 / 252Health citations — State benchmarkedThis home is ranked 129th out of 252 homes in Florida. Shows this facility's total health deficiency citations benchmarked to the Florida State average, with a ranking across all 252 FL facilities. Lower citation counts earn a better rank.Rankings are based only on facilities in Florida that report data for that category. Facilities without available data are excluded from the ranking.Click the rank badge to see the full State ranking.Click here to see the full State ranking.

Florida average 19.7

Citations per inspection
4.5 Rank #141 / 252Citations per inspection — State benchmarkedThis home is ranked 141st out of 252 homes in Florida. Shows average deficiency citations per CMS inspection for this facility versus the Florida mean across 252 facilities with citation data. Lower is better.Rankings are based only on facilities in Florida that report data for that category. Facilities without available data are excluded from the ranking.Click the rank badge to see the full State ranking.Click here to see the full State ranking.

Florida average 4.48


Health citations are formal notices following inspections when they fail to comply with safety and care standards.

17 of 18 citations resulted from standard inspections; and 1 of 18 resulted from complaint investigations.

Breakdown of citation severity (last 5 years)
Critical health citations
0
100% better than Florida average

Florida average: 0.8


Serious health citations
3
650% worse than Florida average

Florida average: 0.4

0 critical citations Florida average: 0.8

3 serious citations Florida average: 0.4

15 moderate citations Florida average: 18.4

0 minor citations Florida average: 0.2
Citations history (last 5 years)
Abuse/Neglect serious citation May 06, 2025
Corrected

Abuse/Neglect serious citation Sep 10, 2024
Corrected

Administration moderate citation Sep 10, 2024
Corrected

Infection Control moderate citation Sep 10, 2024
Corrected

Staffing Data

Reporting period: October 1 – December 31, 2025 (Q4 2025). Source: CMS Payroll-Based Journal report.

Total staff 198
Employees 161
Contractors 37
Staff to resident ratio 1.57 : 1
7% more staff per resident than Florida average
Florida average ratio: 1.47 : 1 Florida average ratio: 1.47 : 1See full Florida ranking
Avg staff/day 75
Average shift 7.3 hours
8% worse than Florida average
Florida average: 7.9 hours Florida average shift: 7.9 hoursSee full Florida ranking
Total staff hours (quarter) 50,321

Nursing staff breakdown

Q4 2025 · Oct 1 – Dec 31 More info This data comes from the CMS Payroll-Based Journal report covering October 1 – December 31, 2025.
Registered Nurse

Manages medical care and health needs.

RN Staff Info All 15 RN Staff are full-time employees. No contractors work on this role. 15
Average shift length Info Average shift length. Calculated as total hours divided by days worked and average staff per day. 7.2 hours
Licensed Practical Nurse

Assists with medical care and medications.

LPN Staff Info All 30 LPN Staff are full-time employees. No contractors work on this role. 30
Average shift length Info Average shift length. Calculated as total hours divided by days worked and average staff per day. 7.8 hours
Certified Nursing Assistant

Helps with daily care and mobility.

CNA Staff Info All 76 CNA Staff are full-time employees. No contractors work on this role. 76
Average shift length Info Average shift length. Calculated as total hours divided by days worked and average staff per day. 7.5 hours

Contractor staffing

Q4 2025 · Oct 1 – Dec 31 More info This data comes from the CMS Payroll-Based Journal report covering October 1 – December 31, 2025.

Total hours from contractors

5.2%

2,634 contractor hours this quarter

Speech Language Pathologist: 8 Occupational Therapy Assistant: 6 Physical Therapy Assistant: 6 Physical Therapy Aide: 6 Qualified Social Worker: 4 Respiratory Therapy Technician: 4 Occupational Therapy Aide: 1 Medical Director: 1 Dietitian: 1

Staff by category

Q4 2025 · Oct 1 – Dec 31 More info This data comes from the CMS Payroll-Based Journal report covering October 1 – December 31, 2025.
Certified Nursing Assistant7607625,18792100%7.5
Licensed Practical Nurse300309,99192100%7.8
Registered Nurse150154,09692100%7.2
Speech Language Pathologist68141,7656975%6.8
Dietitian4151,71892100%7.3
Clinical Nurse Specialist4041,5107379%7.9
Physical Therapy Aide2681,0897177%6.8
RN Director of Nursing2029207076%8
Respiratory Therapy Technician5498518087%5.3
Physical Therapy Assistant2686595661%6.7
Qualified Social Worker4486036773%6.6
Mental Health Service Worker8085855762%7.2
Administrator1014725964%8
Nurse Practitioner1014565762%8
Occupational Therapy Aide1123093942%7.7
Occupational Therapy Assistant066645155%1.1
Medical Director011482426%2
76 Certified Nursing Assistant
% of Days 100%
30 Licensed Practical Nurse
% of Days 100%
15 Registered Nurse
% of Days 100%
14 Speech Language Pathologist
% of Days 75%
5 Dietitian
% of Days 100%
4 Clinical Nurse Specialist
% of Days 79%
8 Physical Therapy Aide
% of Days 77%
2 RN Director of Nursing
% of Days 76%
9 Respiratory Therapy Technician
% of Days 87%
8 Physical Therapy Assistant
% of Days 61%
8 Qualified Social Worker
% of Days 73%
8 Mental Health Service Worker
% of Days 62%
1 Administrator
% of Days 64%
1 Nurse Practitioner
% of Days 62%
2 Occupational Therapy Aide
% of Days 42%
6 Occupational Therapy Assistant
% of Days 55%
1 Medical Director
% of Days 26%

Penalties and fines

Includes penalties issued in 2024-2025

Federal penalties imposed by CMS for regulatory violations, including civil money penalties (fines) and denials of payment for new Medicare/Medicaid admissions.

Source: CMS Penalties Database (Data as of Jan 2026)

Total fines amount $86K Rank #232 / 258Federal fines — State benchmarkedThis home is ranked 232nd out of 258 homes in Florida. Shows this facility's cumulative CMS federal fine dollars versus the Florida average among facilities with fines, and where it ranks among 258 facilities in the pool. Lower total dollars mean a better rank.Rankings are based only on facilities in Florida that report data for that category. Facilities without available data are excluded from the ranking.Click the rank badge to see the full State ranking.Click here to see the full State ranking.
19% higher than Florida average

Florida average: $72K

Number of fines 4
52% more fines than Florida average

Florida average: 2.6

Payment Denials Info Serious action where Medicare and/or Medicaid temporarily stops payments for new residents until issues are fixed. 0
100% fewer payment denials than Florida average

Florida average: 0.1

Fines amount comparison
This facility $86K
Florida average $72K
Penalty History

Penalties are imposed by CMS for violations of federal nursing home regulations.

4 penalties in the past 3 years

Multiple penalties were reported in the last 3 years.

Civil Money Penalty Info Fines imposed for noncompliance, which can be assessed per day or per instance of violation. May 6, 2025
$69K
Civil Money Penalty Info Fines imposed for noncompliance, which can be assessed per day or per instance of violation. Sep 10, 2024
$4K
Civil Money Penalty Info Fines imposed for noncompliance, which can be assessed per day or per instance of violation. Sep 10, 2024
$5K
Civil Money Penalty Info Fines imposed for noncompliance, which can be assessed per day or per instance of violation. Sep 10, 2024
$8K

Last updated: Jan 2026

Quality of care over time

These measures show how residents usually do over time at this home, based on health outcomes and preventive care.

High-risk clinical events score Info A composite score based on pressure ulcers, falls with injury, weight loss, walking ability decline, and activities of daily living decline. 15.1
104% worse than Florida average

Florida average: 7.4

Functional decline score Info A composite score based on activities of daily living decline, walking ability decline, and incontinence. 31.0
150% worse than Florida average

Florida average: 12.4

Long-stay resident measures
Need for Help with Daily Activities Increased Info Percent of long-stay residents whose need for help with daily activities has increased 20.2%
93% worse than Florida average

Florida average: 10.5%

Walking Ability Worsened Info Percent of long-stay residents whose ability to move independently worsened 46.7%
260% worse than Florida average

Florida average: 12.9%

Low Risk Residents with Bowel/Bladder Incontinence Info Percent of low risk long-stay residents who lose control of their bowels or bladder 26.2%
94% worse than Florida average

Florida average: 13.5%

Falls with Major Injury Info Percent of long-stay residents experiencing one or more falls with major injury 2.5%
In line with Florida average

Florida average: 2.6%

High Risk Residents with Pressure Ulcers Info Percent of long-stay high risk residents with pressure ulcers 4.8%
10% better than Florida average

Florida average: 5.4%

Urinary Tract Infection Info Percent of long-stay residents with a urinary tract infection 1.0%
9% worse than Florida average

Florida average: 0.9%

Lost Too Much Weight Info Percent of long-stay residents who lose too much weight 1.4%
77% better than Florida average

Florida average: 6.0%

Depressive Symptoms Info Percent of long-stay residents who have depressive symptoms 0.0%
100% better than Florida average

Florida average: 3.3%

Antipsychotic Use Info Percent of long-stay residents who received an antipsychotic medication 8.7%
9% worse than Florida average

Florida average: 8.0%

Pneumococcal Vaccine Info Percent of long-stay residents assessed and appropriately given the pneumococcal vaccine 100.0%
In line with Florida average

Florida average: 97.7%

Influenza Vaccine Info Percent of long-stay residents assessed and appropriately given the seasonal influenza vaccine 98.8%
In line with Florida average

Florida average: 99.2%

Short-stay resident measures
Pneumococcal Vaccine Info Percent of short-stay residents assessed and appropriately given the pneumococcal vaccine 99.9%
6% better than Florida average

Florida average: 94.0%

Antipsychotic medication increase Info Percent of short-stay residents who newly received an antipsychotic medication 0.3%
78% better than Florida average

Florida average: 1.5%

Influenza Vaccine Info Percent of short-stay residents assessed and appropriately given the seasonal influenza vaccine 94.8%
In line with Florida average

Florida average: 94.7%

Breakdown by payment type

Medicare

45% of new residents, usually for short-term rehab.

Typical stay 1 - 2 months

Private pay

49% of new residents, often for short stays.

Typical stay 2 - 3 months

Medicaid

6% of new residents, often for long-term daily care.

Typical stay 3 years

Facility Characteristics

Source: CMS Long-Term Care Facility Characteristics (Data as of Jan 2026)

Total residents 126
Medicare
29
23% of residents
Medicaid
59
46.8% of residents
Private pay or other
38
30.2% of residents
Programs & Services
Residents Group

Residents meet regularly to discuss policies, care quality, and activities

Active Resident Council

Organized group of residents that meets regularly to discuss facility policies, quality of life, and activities.

Finances and operations

Based on CMS SNF Cost Report for fiscal year ending in 10/2023.

For-profit
Operated by a single business entity.
Net patient revenue Info Net patient revenue — what the home actually collects for resident care, after contractual allowances, bad debt and discounts are subtracted from its gross charges (CMS cost report, Worksheet G-3). It covers resident care only; money the home earns from other sources is shown separately as "Other income."
$16.4M
Net patient income Info Net patient income: net patient revenue minus the home's total operating expenses. A positive figure means it earns more from resident care than it spends to deliver it; a negative figure means the opposite. It excludes non-operating "other income."
$653.3K
For-profit Operated by a single business entity.
Net patient revenue Info Net patient revenue — what the home actually collects for resident care, after contractual allowances, bad debt and discounts are subtracted from its gross charges (CMS cost report, Worksheet G-3). It covers resident care only; money the home earns from other sources is shown separately as "Other income."
$16.4M Rank #81 / 257Revenue — State benchmarkedThis home is ranked 81st out of 257 homes in Florida. Shows this facility's annual revenue compared to the Florida average. Higher revenue generally means more resources for staffing and capital — read alongside Payroll %.Rankings are based only on facilities in Florida that report data for that category. Facilities without available data are excluded from the ranking.Click the rank badge to see the full State ranking.Click here to see the full State ranking.
Net patient income Info Net patient income: net patient revenue minus the home's total operating expenses. A positive figure means it earns more from resident care than it spends to deliver it; a negative figure means the opposite. It excludes non-operating "other income."
$653.3K
Other income Info Money the home earns outside of resident care — such as investments, grants, rentals and other non-operating sources (CMS cost report, Worksheet G-3). It is tracked separately from net patient revenue: it is not part of that figure, and it is not included in net patient income.
$231.8K
Payroll costs Info Staff salaries plus wage-related costs — benefits such as payroll taxes, health insurance and retirement — from the home's own accounting records (CMS cost report, Worksheet A). Contract or agency labor is counted separately, under other operating costs. Rank #142 / 257Payroll — State benchmarkedThis home is ranked 142nd out of 257 homes in Florida. Shows total annual staff payroll benchmarked to the Florida average. Higher payroll investment relative to peers often signals better staffing and less reliance on cheaper contract labor.Rankings are based only on facilities in Florida that report data for that category. Facilities without available data are excluded from the ranking.Click the rank badge to see the full State ranking.Click here to see the full State ranking.
$7.2M 43.6% of net patient revenue Info Payroll as a share of revenue: staff salaries and wage-related benefits divided by net patient revenue. A higher figure means more of each revenue dollar goes to staff pay. Rank #228 / 257Payroll % — State benchmarkedThis home is ranked 228th out of 257 homes in Florida. Shows payroll as a percentage of revenue versus the Florida average. Well-run Florida facilities typically land around 49–56% — the top third Statewide. Below 25% may signal understaffing or heavy agency use — read with Staffing ratings.Rankings are based only on facilities in Florida that report data for that category. Facilities without available data are excluded from the ranking.Click the rank badge to see the full State ranking.Click here to see the full State ranking.
Other operating costs Info Everything it costs to run the home apart from payroll — food, utilities, supplies, maintenance, contract labor and administration. Calculated as total operating expense minus payroll (staff salaries and wage-related benefits).
$8.6M
Total costs Info The home's total operating expense for the year — all the costs of running it, salaries included (CMS cost report, Worksheet G-3).
$15.8M

What does this home offer?

Housing options icon

Housing Options: Private Rooms

Building type icon
Building type icon

Building Type: Single-story

Housekeeping icon
Housekeeping icon

Housekeeping Services

Health Programs icon

Health Programs

Who this home usually serves

TYPE OF STAY

Mix of rehab and long-term care

This home supports both short-term rehab and long-term care, with residents staying for a wide range of durations.

New residents most often arrive under private pay (49% of admissions), and a typical private pay stay runs around 2 - 3 months.

Admissions
378 total

Coverage residents most often arrive under.

Medicare 45%
Private pay 49%
Medicaid 6%
Discharges
519 total

Coverage residents most often leave under.

Medicare 50%
Private pay 37%
Medicaid 13%

Managed by Franklin Guerrero

Executive Director & Chief Development Officer

Places of interest near LifePath Hospice Sun City Center Hospice House

Address 3.6 miles from city center Info Estimated distance in miles from Ruskin's city center to LifePath Hospice Sun City Center Hospice House's address, calculated via Google Maps.

Calculate Travel Distance to LifePath Hospice Sun City Center Hospice House

Add your location

Address

Compare Nursing Homes around Hillsborough County

The information below is reported by the Florida Agency for Health Care Administration (AHCA).

2 facilities compared · CMS & FL Dept. of Health data

Tampa Lakes Health And Rehabilitation Center
NH
HC
MC
PC
RC
Lutz (North Tampa)
179
Facility 179
FL AVG 89
Rank #78 / 1074
37.4%
Facility 37.4%
FL AVG 84.3%
Rank #252 / 258
-56%
3.50
Facility 3.50
FL AVG 4.04
Rank #216 / 253
-19%-13%
$0
Facility $0
FL AVG $78.9k
Rank #1 / 258
-
16
Facility 16
FL AVG 19.7
Rank #107 / 252
2.7
Facility 2.7
FL AVG 4.5
Rank #39 / 252
-67A+
19
Facility 19
FL AVG 40
Rank #1109 / 1486
-
$22.0M
Facility $22.0M
FL AVG $15.7M
Rank #47 / 257
$10.9M
Facility $10.9M
FL AVG $6.1M
Rank #51 / 257
49.8%
Facility 49.8%
FL AVG 39.8%
Rank #167 / 257
106112
LifePath Hospice Sun City Center Hospice House
NH
HC
Ruskin (Greater Sun Center)
132
Facility 132
FL AVG 89
Rank #206 / 1074
93.1%
Facility 93.1%
FL AVG 84.3%
Rank #63 / 258
+10%
4.13
Facility 4.13
FL AVG 4.04
Rank #91 / 253
-37%+2%
$86.0k
Facility $86.0k
FL AVG $78.9k
Rank #232 / 258
-
18
Facility 18
FL AVG 19.7
Rank #129 / 252
4.5
Facility 4.5
FL AVG 4.5
Rank #141 / 252
3119-
39
Facility 39
FL AVG 40
Rank #743 / 1486
-
$16.4M
Facility $16.4M
FL AVG $15.7M
Rank #81 / 257
$7.2M
Facility $7.2M
FL AVG $6.1M
Rank #142 / 257
43.6%
Facility 43.6%
FL AVG 39.8%
Rank #228 / 257
105736

Financial Assistance for
Nursing Home in Florida

LifePath Hospice Sun City Center Hospice House is located in Ruskin, Florida.
Here are the financial assistance programs available to residents in Florida.

Get Financial aid guidance

Long-Term Care Waiver

Florida Medicaid LTC Waiver

Age 65+ or 21+ disabled
General Florida resident, Medicaid- eligible, nursing home-level care need.
Income Limits (2025) ~$2,829/month 300% FBR, individual
Asset Limits $2,000 (individual), $3,000 (couple).
FL

High demand; waitlists common.

Benefits
In-home care (6-8 hours/day) Assisted living Respite (240 hours/year) Case management

Community Care for the Elderly (CCE)

Florida CCE

Age 60+
General Florida resident, at risk of nursing home.
Income Limits ~$2,000/month varies
Asset Limits $5,000 individual
FL

Limited funding; regional variation.

Benefits
Homemaker services (3-5 hours/week) Adult day care (~$60/day) Respite (up to 10 days/year)

Home Care for the Elderly (HCE)

Florida Home Care for the Elderly

Age 60+
General Florida resident, at risk of nursing home placement; caregiver must be approved.
Income Limits (2025) ~$2,829/month individual, aligned with Medicaid thresholds
Asset Limits ~$2,000 (individual); varies by case manager discretion.
FL

Limited funding (~3,500 served annually); prioritizes low-income frail seniors.

Benefits
Basic subsidy (~$160/month) for housing/medical costs; special subsidies for supplies/services (e.g., incontinence supplies, ~$50-$200/month)

Program of All-Inclusive Care for the Elderly (PACE)

Florida Medicaid PACE

Age 55+
General Florida resident, nursing home-level care need, safe with PACE support.
Income Limits (2025) ~$2,829/month 300% FBR
Asset Limits $2,000 (individual), $3,000 (couple).
FL

Limited to specific counties (e.g., Hillsborough, Miami-Dade); ~10 sites statewide.

Benefits
Personal care (5-7 hours/day) Medical care Meals Transportation Therapy

Optional State Supplementation (OSS)

Florida Optional State Supplementation

Age 65+ or disabled
General Florida resident, living in approved facility, receiving SSI or low-income.
Income Limits (2025) ~$1,004/month individual, including SSI
Asset Limits $2,000 (individual), $3,000 (couple).
FL

Limited to specific facility types; ~$78.40/month max supplement.

Benefits
Cash payment (~$78.40/month) for room/board or personal needs in facilities

Frequently Asked Questions about LifePath Hospice Sun City Center Hospice House

What neighborhood is LifePath Hospice Sun City Center Hospice House in?

LifePath Hospice Sun City Center Hospice House is in the Greater Sun Center neighborhood of Ruskin.

Is LifePath Hospice Sun City Center Hospice House in a walkable area?

LifePath Hospice Sun City Center Hospice House has a walk score of 39. Somewhat walkable. A few nearby services may be reachable on foot, but most trips require transportation.

What is the occupancy rate at LifePath Hospice Sun City Center Hospice House?

LifePath Hospice Sun City Center Hospice House's occupancy is 93.1%.

Does LifePath Hospice Sun City Center Hospice House operate as a for-profit or non-profit?

LifePath Hospice Sun City Center Hospice House is registered as a for-profit in FL.

Are there photos of LifePath Hospice Sun City Center Hospice House?

Yes — there are 4 photos of LifePath Hospice Sun City Center Hospice House in the photo gallery on this page.

What is the address of LifePath Hospice Sun City Center Hospice House?

LifePath Hospice Sun City Center Hospice House is located at 3723 Upper Creek Dr, Ruskin, FL 33573.

What is the phone number of LifePath Hospice Sun City Center Hospice House?

(813) 877-2200 will put you in contact with the team at LifePath Hospice Sun City Center Hospice House.

Guides for Better Senior Living

Care Cost Calculator: See Prices in Your Area

Nursing Home Data Explorer

Don’t Wait Too Long: 7 Red Flag Signs Your Parent Needs Assisted Living Now

The True Cost of Assisted Living in 2025 – And How Families Are Paying For It

Understanding Senior Living Costs: Pricing Models, Discounts & Financial Assistance