


Total staff
79
Employees
79
Contractors
0
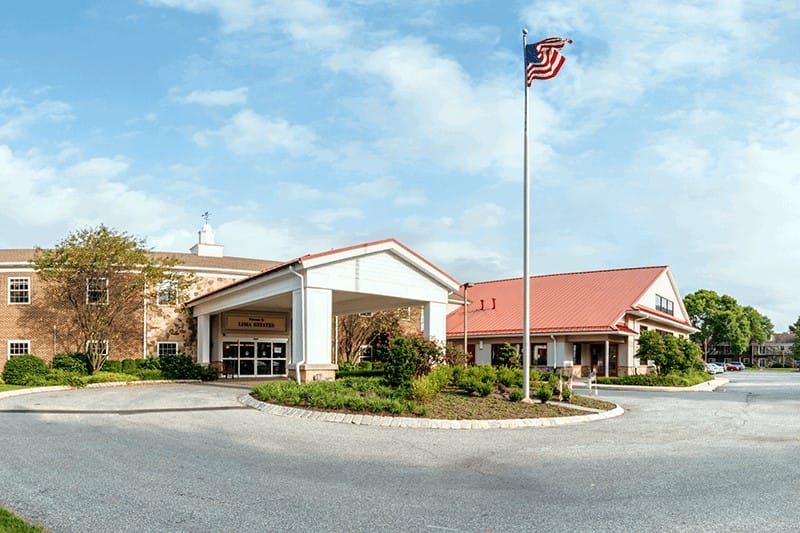


Tucked away in the serene area of Montgomery County, Media, PA, Lima Estates is an astonishing senior living community that offers independent living and assisted living services. The community offers an array of beautiful senior living apartments set in 54-acres of beautifully maintained ground. As a non-profit community, Lima Estates does not have an investor to satisfy, allowing them to fully commit instead on providing amazing care to the residents.
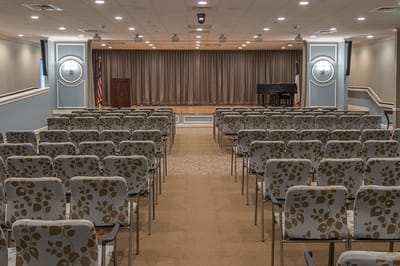
The community conducts a wide array of stimulating activities and programs to keep residents active, healthy, and entertained. Residents also relish a dining experience, featuring carefully prepared meals catered to their dietary needs and tastes. Here, residents are given access to the necessities of a fulfilling retirement life, including compassionate care services, a friendly management team, vibrant activities, and excellent dining experiences.
| Staff type | Hours / Day / Resident | vs state avg |
|---|---|---|
|
Registered Nurse (RN)
| 1h 30m per day | ▲ 93% State avg: 47m per day · National avg: 41m per day |
|
LPN / LVN
| 47m per day | ▼ 14% State avg: 54m per day · National avg: 52m per day |
|
Nurse Aide
| 2h 26m per day | ▲ 11% State avg: 2h 12m per day · National avg: 2h 20m per day |
|
Weekend Total Nursing
| 4h 14m per day | ▲ 20% State avg: 3h 32m per day · National avg: 3h 27m per day |
|
Physical Therapist
| 0m per day | ▼ 100% State avg: 6m per day · National avg: 4m per day |
|
Weekend RN
| 1h 18m per day | ▲ 137% State avg: 33m per day · National avg: 29m per day |
Key information about the people who lead and staff this community.
Reporting period: October 1 – December 31, 2025 (Q4 2025). Source: CMS Payroll-Based Journal report.
Manages medical care and health needs.
Assists with medical care and medications.
Helps with daily care and mobility.
| Certified Nursing Assistant | 36 | 0 | 36 | 1,093 | 92 | 100% | 1.1 |
| Registered Nurse | 21 | 0 | 21 | 476 | 92 | 100% | 1.1 |
| Licensed Practical Nurse | 9 | 0 | 9 | 350 | 92 | 100% | 1 |
| Other Dietary Services Staff | 3 | 0 | 3 | 142 | 84 | 91% | 1.2 |
| Clinical Nurse Specialist | 3 | 0 | 3 | 134 | 75 | 82% | 1.1 |
| Mental Health Service Worker | 1 | 0 | 1 | 72 | 62 | 67% | 1.2 |
| Administrator | 1 | 0 | 1 | 65 | 59 | 64% | 1.1 |
| Dietitian | 1 | 0 | 1 | 63 | 58 | 63% | 1.1 |
| Nurse Practitioner | 1 | 0 | 1 | 63 | 57 | 62% | 1.1 |
| Occupational Therapy Aide | 1 | 0 | 1 | 29 | 22 | 24% | 1.3 |
| Medical Director | 1 | 0 | 1 | 6 | 14 | 15% | 0.4 |
| Occupational Therapy Assistant | 1 | 0 | 1 | 3 | 7 | 8% | 0.5 |
Federal penalties imposed by CMS for regulatory violations, including civil money penalties (fines) and denials of payment for new Medicare/Medicaid admissions.
Source: CMS Penalties Database
No penalties in the past 3 years
No civil money penalties or payment denials were reported in the last 3 years.
These measures show how residents usually do over time at this home, based on health outcomes and preventive care.
Pennsylvania average: 68.8%
Pennsylvania average: 1.5%
Pennsylvania average: 68.7%
Quality measures are calculated from Minimum Data Set (MDS) assessments. For most measures, lower percentages indicate better care quality.
25% of new residents, usually for short-term rehab.
75% of new residents, often for short stays.
Source: CMS Long-Term Care Facility Characteristics (Data as of Jan 2026)
Residents meet regularly to discuss policies, care quality, and activities
Part of a Continuing Care Retirement Community offering multiple care levels
Organized group of residents that meets regularly to discuss facility policies, quality of life, and activities.
Data sourced from CMS Long-Term Care Facility Characteristics quarterly report. Payer mix reflects the current resident census by primary payment source.
Historical financial and operational data for Lima Estates from 2011–2023, based on CMS SNF Cost Reports.
Key figures below are for fiscal year ending in 12/2023.
Based on CMS SNF Cost Report for fiscal year ending in 12/2023.
Room Sizes: 529 / 770 / 806 sq. ft
Housing Options: 1 Bed / 2 Bed / 3 Bed
Building Type: Two-story
Residents typically stay for brief periods, with frequent admissions and discharges throughout the year.
Most new residents arrive under private pay (75% of admissions), and a typical private pay stay runs around 10 - 11 months.
Coverage residents most often arrive under.
Coverage residents most often leave under.
![]() 2.9 miles from city center
2.9 miles from city center
![]() Estimated distance in miles from Media's city center to Lima Estates's address, calculated via Google Maps.
Estimated distance in miles from Media's city center to Lima Estates's address, calculated via Google Maps.
Add your location
Info below is compiled from CMS reports & the PA Depts. of Human Services & Health, senior community websites & trusted data sources such as Walk Score & BBB.
Communities are listed from highest to lowest based on our ranking methodology.
| Lima Estates | AL NH HC HOS IL MC PC SNF | Media | 60
Facility
60
PA AVG
94
Rank
#398 / 553 | - | - | 4.54
Facility
4.54
PA AVG
4.15
Rank
#72 / 181 | +122% | +10% | $0
Facility
$0
PA AVG
$61.2k
Rank
#1 / 184 | - | - | - | - | 5 | A+ |
24
Facility
24
PA AVG
46
Rank
#510 / 667 | - | $16.5MFiscal year ending 12/2023
Facility
$16.5MFiscal year ending 12/2023
PA AVG
$32.8M
Rank
#103 / 183 | $8.3MFiscal year ending 12/2023
Facility
$8.3MFiscal year ending 12/2023
PA AVG
$6.7M
Rank
#123 / 183 | 50.7%Fiscal year ending 12/2023
Facility
50.7%Fiscal year ending 12/2023
PA AVG
40%
Rank
#143 / 183 | 395492 | ||||
| Garden Spring Nursing and Rehabilitation Center | AL NH RC SNF | Willow Grove | 173
Facility
173
PA AVG
94
Rank
#34 / 553 |
76.6%
Facility
76.6%
PA AVG
68.1
Rank
#193 / 507 | +12% | 3.59
Facility
3.59
PA AVG
4.15
Rank
#150 / 181 | -92% | -13% | $0
Facility
$0
PA AVG
$61.2k
Rank
#1 / 184 | - | 45
Facility
45
PA AVG
31.3
Rank
#149 / 179 | 4.1
Facility
4.1
PA AVG
4.4
Rank
#107 / 179 | 1 | 133 | - |
54
Facility
54
PA AVG
46
Rank
#248 / 667 | Bh Opco Holdco LLC | $13.9MFiscal year ending 06/2024
Facility
$13.9MFiscal year ending 06/2024
PA AVG
$32.8M
Rank
#143 / 183 | $6.8MFiscal year ending 06/2024
Facility
$6.8MFiscal year ending 06/2024
PA AVG
$6.7M
Rank
#117 / 183 | 49.2%Fiscal year ending 06/2024
Facility
49.2%Fiscal year ending 06/2024
PA AVG
40%
Rank
#24 / 183 | 395077 |
Lima Estates is located in Media, Pennsylvania.
Here are the financial assistance programs available to residents in Pennsylvania.
Lima Estates has a walk score of 24. Car-dependent. Most errands require a car, with limited nearby walkable options.
Lima Estates's occupancy is 62.3%.
Lima Estates has been operating for approximately 55 years, based on available licensing and registration records.
No, Lima Estates has a no-pet policy.
Lima Estates is registered as a non-profit in PA.
Yes — there are 4 photos of Lima Estates in the photo gallery on this page.
Lima Estates is located at 411 N Middletown Rd, Media, PA 19063.
Care Cost Calculator: See Prices in Your Area
Nursing Home Data Explorer
Don’t Wait Too Long: 7 Red Flag Signs Your Parent Needs Assisted Living Now
The True Cost of Assisted Living in 2025 – And How Families Are Paying For It
Understanding Senior Living Costs: Pricing Models, Discounts & Financial Assistance


