Lincoln Care and Rehabilitation Center
Nursing Home, Palliative Care & Respite Care · Wichita, KS
CMS overall rating Info CMS (the Centers for Medicare & Medicaid Services) is the federal agency that rates nursing home quality. Its Overall Rating runs from 1 to 5 stars, combining health inspections, staffing, and quality measures, with inspections weighted most heavily.

Lincoln Care and Rehabilitation Center

Nursing Home, Palliative Care & Respite Care · Wichita, KS
CMS overall rating Info CMS (the Centers for Medicare & Medicaid Services) is the federal agency that rates nursing home quality. Its Overall Rating runs from 1 to 5 stars, combining health inspections, staffing, and quality measures, with inspections weighted most heavily.
Calculator: See prices in your area
Lincoln Care and Rehabilitation Center accepts Medicare, Medicaid, and private pay.

Overview of Lincoln Care and Rehabilitation Center

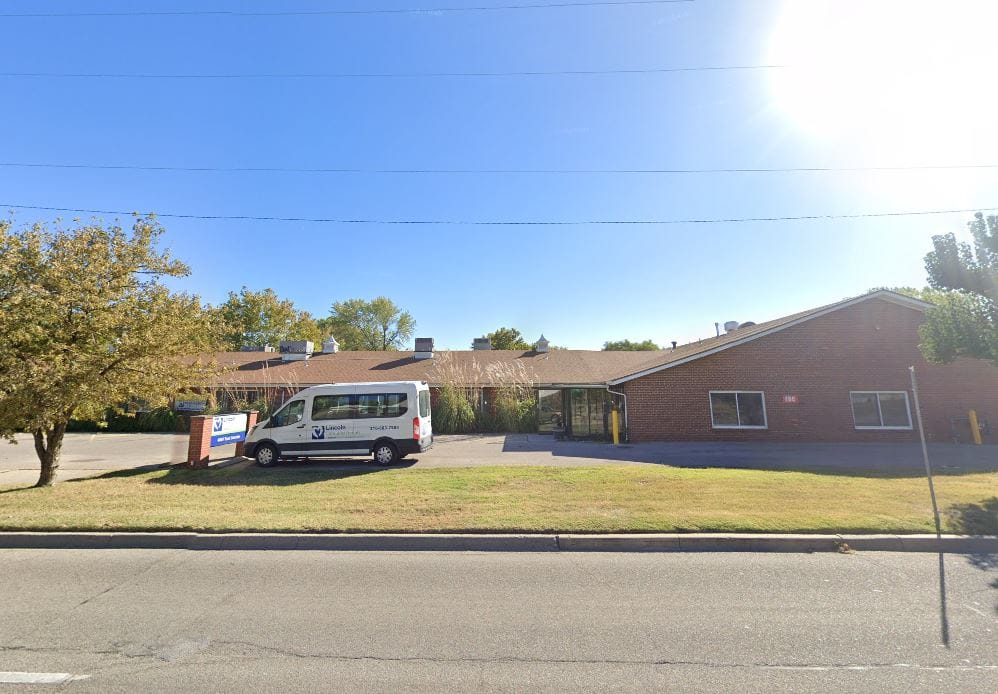
Lincoln Care and Rehabilitation Center is a tightly-knit skilled nursing and rehabilitation center. The modest and quality nursing home provides graceful living for short-term or long-term stays in a cozy nurturing environment. Lincoln Care provides services for inpatient and outpatient care; assisting everyday living with enriching activities that contribute to a high success rate for recovery.  
Lincoln offers comprehensive and result-driven services that focus on wound care, IV therapy cardiac management, and pulmonary management. The residents are surely enthralled because of the professional and compassionate delivery and attention given by the well-trained staff. 

(316) 683-7588

Quality ratings

Measured by Centers for Medicare & Medicaid Services (CMS)

Overall rating Info The Overall CMS Rating combines results from health inspections, staffing levels and quality measures. Health inspections carry the most weight. Staffing and quality scores can increase or decrease the final rating based on performance compared to state and national standards.
▼ 65.4% Below KS avg. ▼ 65.4% Below KS avg.KS average: 2.9Click the badge to see the full State ranking.Click here to see the full State ranking.
Health Inspection Info Based on the results of the facility's three most recent standard inspections and any complaint investigations. CMS reviews the number, scope, and severity of deficiencies, with more recent findings weighted more heavily.
▼ 63.8% Below KS avg. ▼ 63.8% Below KS avg.KS average: 2.8Click the badge to see the full State ranking.Click here to see the full State ranking.
Staffing Info Measures average nursing staff hours per resident per day, including Registered Nurses (RNs) and total nursing staff. Ratings are adjusted based on the level of care residents require and are compared to state and national benchmarks.
▲ 15.7% Above KS avg. ▲ 15.7% Above KS avg.KS average: 3.5Click the badge to see the full State ranking.Click here to see the full State ranking.
Quality Measures Info Based on clinical and physical health indicators reported to CMS, such as hospital readmissions, falls, pressure ulcers, and improvements in mobility. These measures reflect how well residents' health needs are being managed.
▼ 3.0% Below KS avg. ▼ 3.0% Below KS avg.KS average: 3.1Click the badge to see the full State ranking.Click here to see the full State ranking.

Staffing hours breakdown

Info Daily nursing hours per resident by staff type, reported to CMS. Higher is generally better — compare this facility to state and national averages to see where staffing stands.

Hours per resident per day — compared to Kansas state averages

Staff typeHours / Day / Residentvs state avg
Registered Nurse (RN) Info RNs hold the highest nursing license and can assess residents, interpret test results, and direct care plans. More RN hours per day often signals stronger clinical oversight and faster response to health changes. 49m per day ▲ 13% State avg: 43m per day · National avg: 41m per day
LPN / LVN Info Licensed Practical Nurses (LPNs) or Licensed Vocational Nurses (LVNs) deliver routine hands-on care — medication administration, wound dressing, and monitoring vital signs. They work under RN supervision and make up a large share of daily bedside care. 18m per day ▼ 56% State avg: 40m per day · National avg: 52m per day
Nurse Aide Info Certified Nurse Aides (CNAs) provide the most direct day-to-day assistance: bathing, dressing, feeding, and mobility. Nurse aide hours are typically the largest staffing category and directly affect residents' quality of life. 3h 4m per day ▲ 14% State avg: 2h 42m per day · National avg: 2h 21m per day
Weekend Total Nursing Info Combined nursing hours (RN + LPN + Nurse Aide) per resident per day on weekends. Staffing often drops on weekends — this figure reveals whether the facility maintains adequate coverage outside of weekday hours. 3h 41m per day ▲ 3% State avg: 3h 35m per day · National avg: 3h 26m per day
Physical Therapist Info Hours per resident per day provided by licensed Physical Therapists (PTs) or PT Assistants. PT services help residents recover mobility after injury or illness and are especially important for post-acute (short-stay) rehabilitation. 0m per day ▼ 75% State avg: 2m per day · National avg: 4m per day
Weekend RN Info Registered nurse hours specifically on weekends. Facilities sometimes reduce RN presence on Saturdays and Sundays — a low weekend RN figure compared to weekday hours can indicate reduced clinical oversight when most administrative staff are absent. 36m per day ▲ 23% State avg: 29m per day · National avg: 29m per day

Capacity and availability

This home usually has limited availability

Higher occupancy than the Kansas average: 79.5%
Occupancy rate
91.3% Rank #34 / 218Occupancy rate — State benchmarkedThis home is ranked 34th out of 218 homes in Kansas. Shows this facility's occupancy rate versus the Kansas average, with its Statewide rank out of 218. Higher occupancy signals strong local demand and financial stability.Ranking totals vary by category as each rank only includes facilities that report data for that metric. Homes missing that data point aren't included in the ranking.Click the rank badge to see the full State ranking.Click here to see the full State ranking.
Avg. Length of Stay
288 days
Bed community size
45-bed community Rank #152 / 224Bed count — State benchmarkedThis home is ranked 152nd out of 224 homes in Kansas. Shows this facility's certified or reported bed count compared to other Kansas facilities. Larger communities may offer more amenities, programs, and on-site services for residents and families.Ranking totals vary by category as each rank only includes facilities that report data for that metric. Homes missing that data point aren't included in the ranking.Click the rank badge to see the full State ranking.Click here to see the full State ranking.
A moderately sized community that may balance personal attention with shared amenities and social activities.
Walk Score
Walk Score: 44 / 100 Rank #207 / 363Walk Score — State benchmarkedThis home is ranked 207th out of 363 homes in Kansas. Shows how walkable this facility's neighborhood is compared to the average Walk Score across Kansas facilities. Higher scores benefit residents, families, and staff.Ranking totals vary by category as each rank only includes facilities that report data for that metric. Homes missing that data point aren't included in the ranking.Click the rank badge to see the full State ranking.Click here to see the full State ranking.
Somewhat walkable. A few nearby services may be reachable on foot, but most trips require transportation.

About this community

Therapy & Rehabilitation

2 services
Rehabilitation Services
Respite Care

Amenities & Lifestyle

Salon
Barber
Dining Room
Wifi
Specific ProgramsFirst Steps, How to begin, Senior living & care options, Financial considerations, Short-stay, Transitional, Comfort Care, Specialized Services, About MH, Our CARES values, Awards & recognitions, Mission Giving, Benefits, MH Education

Contact Lincoln Care and Rehabilitation Center

Staffing Data

Reporting period: October 1 – December 31, 2025 (Q4 2025). Source: CMS Payroll-Based Journal report.

Total staff 72
Employees 49
Contractors 23
Staff to resident ratio 1.95 : 1
13% fewer staff per resident than Kansas average
Kansas average ratio: 2.24 : 1 Kansas average ratio: 2.24 : 1See full Kansas ranking
Avg staff/day 20
Average shift 8 hours
0% compared with Kansas average
Kansas average: 7.7 hours Kansas average shift: 7.7 hoursSee full Kansas ranking
Total staff hours (quarter) 14,636

Nursing staff breakdown

Q4 2025 · Oct 1 – Dec 31 More info This data comes from the CMS Payroll-Based Journal report covering October 1 – December 31, 2025.
Registered Nurse

Manages medical care and health needs.

RN Staff Info 6 total: 5 full-time employees and 1 contractor. 6
Average shift length Info Average shift length. Calculated as total hours divided by days worked and average staff per day. 8.7 hours
Licensed Practical Nurse

Assists with medical care and medications.

LPN Staff Info 10 total: 5 full-time employees and 5 contractors. 10
Average shift length Info Average shift length. Calculated as total hours divided by days worked and average staff per day. 9.2 hours
Certified Nursing Assistant

Helps with daily care and mobility.

CNA Staff Info All 20 CNA Staff are full-time employees. No contractors work on this role. 20
Average shift length Info Average shift length. Calculated as total hours divided by days worked and average staff per day. 8.7 hours

Contractor staffing

Q4 2025 · Oct 1 – Dec 31 More info This data comes from the CMS Payroll-Based Journal report covering October 1 – December 31, 2025.

Total hours from contractors

6.1%

899 contractor hours this quarter

Licensed Practical Nurse: 5 Physical Therapy Assistant: 4 Occupational Therapy Assistant: 3 Physical Therapy Aide: 3 Nurse Practitioner: 2 Registered Nurse: 1 Speech Language Pathologist: 1 Respiratory Therapy Technician: 1 Medical Director: 1 Occupational Therapy Aide: 1 Qualified Social Worker: 1

Staff by category

Q4 2025 · Oct 1 – Dec 31 More info This data comes from the CMS Payroll-Based Journal report covering October 1 – December 31, 2025.
Certified Nursing Assistant200205,31992100%8.7
Medication Aide/Technician120124,26492100%8.9
Registered Nurse5161,4408997%8.7
Licensed Practical Nurse55109126874%9.2
Clinical Nurse Specialist3035666166%7.7
Nurse Practitioner1235246065%8.6
Administrator1014806065%8
Mental Health Service Worker1014646267%7.5
Speech Language Pathologist0113376773%5
Other Dietary Services Staff1011532426%6.4
Physical Therapy Aide033633639%1.8
Respiratory Therapy Technician011262426%1.1
Occupational Therapy Aide0112433%8
Medical Director011211011%2.1
Occupational Therapy Assistant033191921%1
Physical Therapy Assistant044151112%1.3
Qualified Social Worker011111516%0.8
20 Certified Nursing Assistant
% of Days 100%
12 Medication Aide/Technician
% of Days 100%
6 Registered Nurse
% of Days 97%
10 Licensed Practical Nurse
% of Days 74%
3 Clinical Nurse Specialist
% of Days 66%
3 Nurse Practitioner
% of Days 65%
1 Administrator
% of Days 65%
1 Mental Health Service Worker
% of Days 67%
1 Speech Language Pathologist
% of Days 73%
1 Other Dietary Services Staff
% of Days 26%
3 Physical Therapy Aide
% of Days 39%
1 Respiratory Therapy Technician
% of Days 26%
1 Occupational Therapy Aide
% of Days 3%
1 Medical Director
% of Days 11%
3 Occupational Therapy Assistant
% of Days 21%
4 Physical Therapy Assistant
% of Days 12%
1 Qualified Social Worker
% of Days 16%

Penalties and fines

Includes penalties issued in 2024-2025

Federal penalties imposed by CMS for regulatory violations, including civil money penalties (fines) and denials of payment for new Medicare/Medicaid admissions.

Source: CMS Penalties Database (Data as of Jan 2026)

Total fines amount $47K Rank #119 / 144Federal fines — State benchmarkedThis home is ranked 119th out of 144 homes in Kansas. Shows this facility's cumulative CMS federal fine dollars versus the Kansas average among facilities with fines, and where it ranks among 144 facilities in the pool. Lower total dollars mean a better rank.Ranking totals vary by category as each rank only includes facilities that report data for that metric. Homes missing that data point aren't included in the ranking.Click the rank badge to see the full State ranking.Click here to see the full State ranking.
8% higher than Kansas average

Kansas average: $44K

Number of fines 3
24% more fines than Kansas average

Kansas average: 2.4

Payment Denials Info Serious action where Medicare and/or Medicaid temporarily stops payments for new residents until issues are fixed. 0
100% fewer payment denials than Kansas average

Kansas average: 0.3

Fines amount comparison
This facility $47K
Kansas average $44K
Penalty History

Penalties are imposed by CMS for violations of federal nursing home regulations.

3 penalties in the past 3 years

Multiple penalties were reported in the last 3 years.

Civil Money Penalty Info Fines imposed for noncompliance, which can be assessed per day or per instance of violation. Mar 11, 2025
$22K
Civil Money Penalty Info Fines imposed for noncompliance, which can be assessed per day or per instance of violation. Feb 21, 2025
$13K
Civil Money Penalty Info Fines imposed for noncompliance, which can be assessed per day or per instance of violation. Dec 30, 2024
$13K

Last updated: Jan 2026

Quality of care over time

These measures show how residents usually do over time at this home, based on health outcomes and preventive care.

High-risk clinical events score Info A composite score based on pressure ulcers, falls with injury, weight loss, walking ability decline, and activities of daily living decline. 6.4
39% better than Kansas average

Kansas average: 10.5

Functional decline score Info A composite score based on activities of daily living decline, walking ability decline, and incontinence. 11.3
45% better than Kansas average

Kansas average: 20.7

Long-stay resident measures
Above average Kansas avg: 3.0 Info CMS star rating based on long-stay quality measure performance. 5 stars = significantly above average, 1 star = significantly below average.
Need for Help with Daily Activities Increased Info Percent of long-stay residents whose need for help with daily activities has increased 8.8%
54% better than Kansas average

Kansas average: 19.0%

Walking Ability Worsened Info Percent of long-stay residents whose ability to move independently worsened 13.2%
32% better than Kansas average

Kansas average: 19.4%

Low Risk Residents with Bowel/Bladder Incontinence Info Percent of low risk long-stay residents who lose control of their bowels or bladder 11.8%
50% better than Kansas average

Kansas average: 23.8%

Falls with Major Injury Info Percent of long-stay residents experiencing one or more falls with major injury 4.4%
In line with Kansas average

Kansas average: 4.4%

High Risk Residents with Pressure Ulcers Info Percent of long-stay high risk residents with pressure ulcers 3.3%
29% better than Kansas average

Kansas average: 4.6%

Urinary Tract Infection Info Percent of long-stay residents with a urinary tract infection 1.3%
59% better than Kansas average

Kansas average: 3.1%

Lost Too Much Weight Info Percent of long-stay residents who lose too much weight 2.0%
60% better than Kansas average

Kansas average: 5.1%

Depressive Symptoms Info Percent of long-stay residents who have depressive symptoms 0.0%
100% better than Kansas average

Kansas average: 5.2%

Antipsychotic Use Info Percent of long-stay residents who received an antipsychotic medication 10.1%
40% better than Kansas average

Kansas average: 16.9%

Pneumococcal Vaccine Info Percent of long-stay residents assessed and appropriately given the pneumococcal vaccine 95.6%
In line with Kansas average

Kansas average: 91.9%

Influenza Vaccine Info Percent of long-stay residents assessed and appropriately given the seasonal influenza vaccine 95.2%
In line with Kansas average

Kansas average: 95.5%

Short-stay resident measures
Pneumococcal Vaccine Info Percent of short-stay residents assessed and appropriately given the pneumococcal vaccine 45.2%
40% worse than Kansas average

Kansas average: 75.6%

Breakdown by payment type

Medicare

20% of new residents, usually for short-term rehab.

Typical stay 1 - 2 months

Private pay

22% of new residents, often for short stays.

Typical stay 30 days

Medicaid

58% of new residents, often for long-term daily care.

Typical stay 1 years

Facility Characteristics

Source: CMS Long-Term Care Facility Characteristics (Data as of Jan 2026)

Total residents 37
Medicare
3
8.1% of residents
Medicaid
32
86.5% of residents
Private pay or other
2
5.4% of residents
Programs & Services
Residents Group

Residents meet regularly to discuss policies, care quality, and activities

Nurse Aide Training

State-approved Nurse Aide Training and Competency Evaluation Program on-site

Active Resident Council

Organized group of residents that meets regularly to discuss facility policies, quality of life, and activities.

Finances and operations

Based on CMS SNF Cost Report for fiscal year ending in 12/2023.

Voluntary non-profit community
Operated by a church.
Net patient revenue Info Net patient revenue — what the home actually collects for resident care, after contractual allowances, bad debt and discounts are subtracted from its gross charges (CMS cost report, Worksheet G-3). It covers resident care only; money the home earns from other sources is shown separately as "Other income."
$4.5M
Net patient income Info Net patient income: net patient revenue minus the home's total operating expenses. A positive figure means it earns more from resident care than it spends to deliver it; a negative figure means the opposite. It excludes non-operating "other income."
$394.6K
Voluntary non-profit community Operated by a church.
Net patient revenue Info Net patient revenue — what the home actually collects for resident care, after contractual allowances, bad debt and discounts are subtracted from its gross charges (CMS cost report, Worksheet G-3). It covers resident care only; money the home earns from other sources is shown separately as "Other income."
$4.5M Rank #116 / 144Revenue — State benchmarkedThis home is ranked 116th out of 144 homes in Kansas. Shows this facility's annual revenue compared to the Kansas average. Higher revenue generally means more resources for staffing and capital — read alongside Payroll %.Ranking totals vary by category as each rank only includes facilities that report data for that metric. Homes missing that data point aren't included in the ranking.Click the rank badge to see the full State ranking.Click here to see the full State ranking.
Net patient income Info Net patient income: net patient revenue minus the home's total operating expenses. A positive figure means it earns more from resident care than it spends to deliver it; a negative figure means the opposite. It excludes non-operating "other income."
$394.6K
Other income Info Money the home earns outside of resident care — such as investments, grants, rentals and other non-operating sources (CMS cost report, Worksheet G-3). It is tracked separately from net patient revenue: it is not part of that figure, and it is not included in net patient income.
-$31.0K
Payroll costs Info Staff salaries plus wage-related costs — benefits such as payroll taxes, health insurance and retirement — from the home's own accounting records (CMS cost report, Worksheet A). Contract or agency labor is counted separately, under other operating costs. Rank #93 / 144Payroll — State benchmarkedThis home is ranked 93rd out of 144 homes in Kansas. Shows total annual staff payroll benchmarked to the Kansas average. Higher payroll investment relative to peers often signals better staffing and less reliance on cheaper contract labor.Ranking totals vary by category as each rank only includes facilities that report data for that metric. Homes missing that data point aren't included in the ranking.Click the rank badge to see the full State ranking.Click here to see the full State ranking.
$2.3M 52.8% of net patient revenue Info Payroll as a share of revenue: staff salaries and wage-related benefits divided by net patient revenue. A higher figure means more of each revenue dollar goes to staff pay. Rank #12 / 144Payroll % — State benchmarkedThis home is ranked 12th out of 144 homes in Kansas. Shows payroll as a percentage of revenue versus the Kansas average. Well-run Kansas facilities typically land around 57–67% — the top third Statewide. Below 25% may signal understaffing or heavy agency use — read with Staffing ratings.Ranking totals vary by category as each rank only includes facilities that report data for that metric. Homes missing that data point aren't included in the ranking.Click the rank badge to see the full State ranking.Click here to see the full State ranking.
Other operating costs Info Everything it costs to run the home apart from payroll — food, utilities, supplies, maintenance, contract labor and administration. Calculated as total operating expense minus payroll (staff salaries and wage-related benefits).
$1.7M
Total costs Info The home's total operating expense for the year — all the costs of running it, salaries included (CMS cost report, Worksheet G-3).
$4.1M

Who this home usually serves

TYPE OF STAY

Mostly long-term care residents

Most residents stay for extended periods and receive ongoing daily care.

Most new residents arrive under Medicaid (58% of admissions), and a typical Medicaid stay runs around 1 years.

Admissions
59 total

Coverage residents most often arrive under.

Medicare 20%
Private pay 22%
Medicaid 58%
Discharges
52 total

Coverage residents most often leave under.

Medicare 12%
Private pay 19%
Medicaid 69%

Places of interest near Lincoln Care and Rehabilitation Center

Address 3.1 miles from city center Info Estimated distance in miles from Wichita's city center to Lincoln Care and Rehabilitation Center's address, calculated via Google Maps. — 1.03 miles to nearest hospital (Robert J. Dole VA Medical Center)

Calculate Travel Distance to Lincoln Care and Rehabilitation Center

Add your location

Address

Compare Nursing Home around Wichita

The information below is reported by the Kansas Department for Aging and Disability Services.

5 facilities compared · CMS & KS Dept. of Health data

Regent Park Rehabilitation and Healthcare
NH
AL
HC
IL
MC
NC
RC
Wichita (Bradford Place)
84
Facility 84
KS AVG 69
Rank #54 / 224
83.1%
Facility 83.1%
KS AVG 79.5%
Rank #100 / 218
+5%
5.17
Facility 5.17
KS AVG 4.63
Rank #40 / 141
+6%+12%
$0
Facility $0
KS AVG $49.2k
Rank #1 / 144
14
Facility 14
KS AVG 26.9
Rank #18 / 143
4.7
Facility 4.7
KS AVG 6.1
Rank #42 / 143
-71-
28
Facility 28
KS AVG 46
Rank #269 / 363
Legend Senior Properties
$10.9M
Facility $10.9M
KS AVG $7.3M
Rank #19 / 144
$6.7M
Facility $6.7M
KS AVG $3.3M
Rank #32 / 144
61.5%
Facility 61.5%
KS AVG 47.9%
Rank #123 / 144
175527
Larksfield Place Independent Living
NH
AL
IL
MC
RC
Wichita
80
Facility 80
KS AVG 69
Rank #59 / 224
92.7%
Facility 92.7%
KS AVG 79.5%
Rank #28 / 218
+17%
5.57
Facility 5.57
KS AVG 4.63
Rank #23 / 141
-8%+20%
$0
Facility $0
KS AVG $49.2k
Rank #1 / 144
13
Facility 13
KS AVG 26.9
Rank #15 / 143
4.3
Facility 4.3
KS AVG 6.1
Rank #29 / 143
-80A+
32
Facility 32
KS AVG 46
Rank #252 / 363
Larksfield Place Retirement Communities, Inc.
$24.9M
Facility $24.9M
KS AVG $7.3M
Rank #6 / 144
$11.8M
Facility $11.8M
KS AVG $3.3M
Rank #6 / 144
47.4%
Facility 47.4%
KS AVG 47.9%
Rank #119 / 144
175181
Hilltop Manor
NH
HC
Cunningham
45
Facility 45
KS AVG 69
Rank #152 / 224
58.8%
Facility 58.8%
KS AVG 79.5%
Rank #189 / 218
-26%
4.19
Facility 4.19
KS AVG 4.63
Rank #97 / 141
-33%-10%
$0
Facility $0
KS AVG $49.2k
Rank #1 / 144
10
Facility 10
KS AVG 26.9
Rank #10 / 143
3.3
Facility 3.3
KS AVG 6.1
Rank #12 / 143
138-
20
Facility 20
KS AVG 46
Rank #311 / 363
Darcy Kemmis
$4.0M
Facility $4.0M
KS AVG $7.3M
Rank #115 / 144
$2.4M
Facility $2.4M
KS AVG $3.3M
Rank #101 / 144
60.8%
Facility 60.8%
KS AVG 47.9%
Rank #35 / 144
175545
Ascension Living Via Christi Village Ridge
NH
ADC
AL
IL
MC
Wichita
80
Facility 80
KS AVG 69
Rank #59 / 224
88.7%
Facility 88.7%
KS AVG 79.5%
Rank #57 / 218
+12%
4.47
Facility 4.47
KS AVG 4.63
Rank #74 / 141
-6%-4%
$0
Facility $0
KS AVG $49.2k
Rank #115 / 144
16
Facility 16
KS AVG 26.9
Rank #28 / 143
2.7
Facility 2.7
KS AVG 6.1
Rank #3 / 143
271-
25
Facility 25
KS AVG 46
Rank #282 / 363
Trisha Chege
$13.8M
Facility $13.8M
KS AVG $7.3M
Rank #18 / 144
$6.5M
Facility $6.5M
KS AVG $3.3M
Rank #26 / 144
46.8%
Facility 46.8%
KS AVG 47.9%
Rank #101 / 144
175539
Lincoln Care and Rehabilitation Center
NH
PC
RC
Wichita (Hilltop)
45
Facility 45
KS AVG 69
Rank #152 / 224
91.3%
Facility 91.3%
KS AVG 79.5%
Rank #34 / 218
+15%- -18%-
$40.1k
Facility $40.1k
KS AVG $49.2k
Rank #119 / 144
43
Facility 43
KS AVG 26.9
Rank #118 / 143
8.6
Facility 8.6
KS AVG 6.1
Rank #120 / 143
234-
44
Facility 44
KS AVG 46
Rank #207 / 363
Wichita Operator LLC
$4.5M
Facility $4.5M
KS AVG $7.3M
Rank #116 / 144
$2.3M
Facility $2.3M
KS AVG $3.3M
Rank #93 / 144
52.8%
Facility 52.8%
KS AVG 47.9%
Rank #12 / 144
175273

Financial Assistance for
Nursing Home in Kansas

Lincoln Care and Rehabilitation Center is located in Wichita, Kansas.
Here are the financial assistance programs available to residents in Kansas.

Get Financial aid guidance

Frail Elderly Waiver

Kansas Medicaid FE Waiver

Age 65+
General Kansas resident, Medicaid-eligible, nursing home- level care need.
Income Limits (2025) ~$2,829/month 300% FBR, individual
Asset Limits $2,000 (individual), $3,000 (couple).
KS

Requires care level assessment.

Benefits
Personal care (5-7 hours/day) Respite (240 hours/year) Adult day care (~$60/day) Home aides

Senior Care Act

Kansas SCA

Age 60+
General Kansas resident, at risk of nursing home.
Income Limits ~$1,800/month individual, varies
Asset Limits $2,000 individual
KS

Limited funding; waitlists common.

Benefits
In-home care (3-5 hours/week) Respite (up to 10 days/year) Homemaker services

Medicare Savings Program (MSP)

Kansas Medicare Savings Program

Age 65+ or disabled
General Kansas resident, Medicare Part A/B.
Income Limits (2025) ~$2,510/month (QMB), ~$3,380/month (SLMB), ~$3,598/month (QI)—individual.
Asset Limits $9,430 (individual), $14,130 (couple).
KS

Three tiers; no waitlist.

Benefits
Covers Part B premiums ($174.70/month) Deductibles ($240/year) Copays (~20%)

National Family Caregiver Support Program (NFCSP) Respite

Kansas NFCSP Respite Care

Age
General Caregivers of 60+ needing care or 55+ caregivers of others; Kansas resident; functional needs (2+ ADLs).
Income Limits (2025) Prioritizes ~$24,980/year (individual); no strict cap.
Asset Limits Not assessed; need-based.
KS

11 AAAs; prioritizes low-income, rural caregivers.

Benefits
Respite (4-6 hours/week or 5 days/year) Adult day care ($60/day) Caregiver training

VA Aid and Attendance (A&A) and Housebound Benefits

Kansas VA Aid and Attendance/Housebound

Age 65+ or disabled veteran/spouse
General Kansas resident, wartime service, need for ADL help (A&A) or homebound.
Income Limits (2025) Net income < ~$1,984/month (veteran with dependent, A&A); pension offsets income.
Asset Limits ~$155,356 net worth limit
KS

High veteran demand in rural/urban areas.

Benefits
Cash (~$1,433-$2,642/month veteran, ~$951-$1,318 spouse) for care costs (e.g., in-home, assisted living)

Frequently Asked Questions about Lincoln Care and Rehabilitation Center

What neighborhood is Lincoln Care and Rehabilitation Center in?

Lincoln Care and Rehabilitation Center is in the Hilltop neighborhood.

Is Lincoln Care and Rehabilitation Center in a walkable area?

Lincoln Care and Rehabilitation Center has a walk score of 44. Somewhat walkable. A few nearby services may be reachable on foot, but most trips require transportation.

What is the occupancy rate at Lincoln Care and Rehabilitation Center?

Lincoln Care and Rehabilitation Center's occupancy is 91.3%.

Are there photos of Lincoln Care and Rehabilitation Center?

Yes — there are 3 photos of Lincoln Care and Rehabilitation Center in the photo gallery on this page.

What is the phone number of Lincoln Care and Rehabilitation Center?

(316) 683-7588 will put you in contact with the team at Lincoln Care and Rehabilitation Center.

Is Lincoln Care and Rehabilitation Center Medicare or Medicaid certified?

Yes — Lincoln Care and Rehabilitation Center is a CMS-certified provider of Medicare and Medicaid.

Guides for Better Senior Living

Care Cost Calculator: See Prices in Your Area

Nursing Home Data Explorer

Don’t Wait Too Long: 7 Red Flag Signs Your Parent Needs Assisted Living Now

The True Cost of Assisted Living in 2025 – And How Families Are Paying For It

Understanding Senior Living Costs: Pricing Models, Discounts & Financial Assistance