Occupancy rate
62%

We arrange tours, appointments, and even moving support so you don’t have to
Thank you for your interest!
Our team will be in touch shortly to help with next steps.

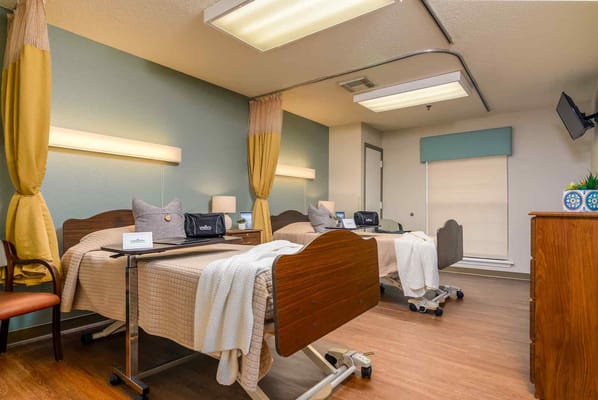
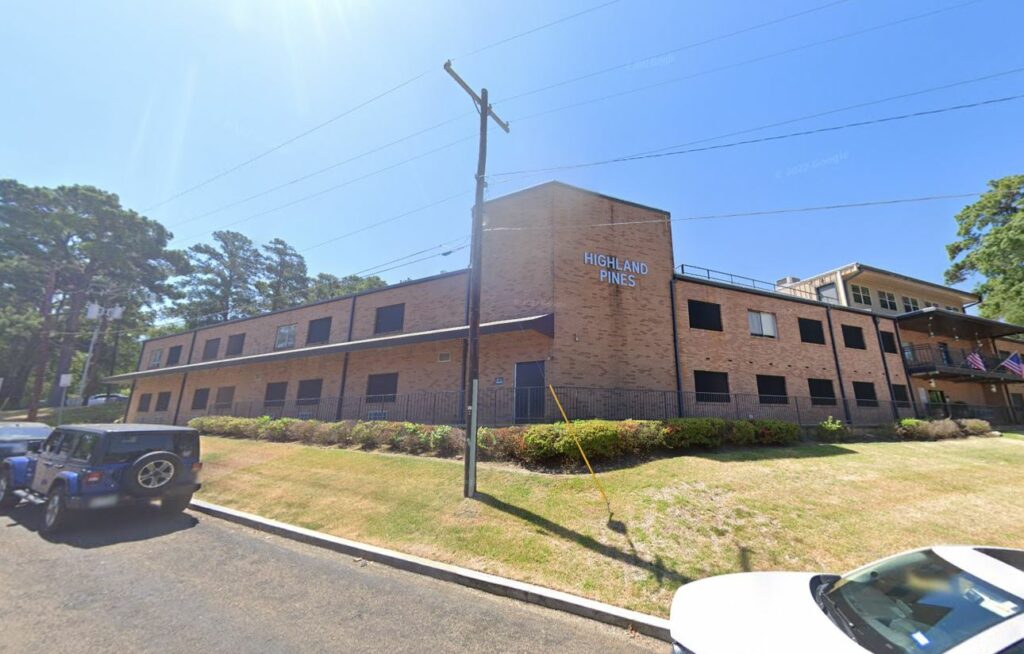
Longview Hill Nursing and Rehabilitation Center is a distinguished provider of compassionate nursing home services recognized by the Centers for Medicare & Medicaid Services for its commitment to high-quality care. This contemporary facility, situated in Longview, Texas, prioritizes health promotion and aims to enhance the quality of life for its residents. The dedicated staff in this center has demonstrated their commitment to safety among staff and residents. This unwavering focus on well-being reflects the center’s dedication to maintaining a secure environment for its community.
For those seeking a nurturing environment that intersects dignity, comfort, and health, Longview Hill Nursing and Rehabilitation Center stands as a beacon of care and compassion in the heart of Texas. With a warm and inviting atmosphere, Longview Hill Nursing and Rehabilitation Center offers personalized attention and support to seniors needing short-term rehabilitation or long-term care. Boasting 198 beds, the center serves a diverse community, ensuring each individual receives tailored care. Beyond physical health, the center fosters a sense of community engagement through its Resident Council, valuing residents’ voices and perspectives. While specialized Alzheimer’s care is not provided, participation in Medicare and Medicaid programs widens accessibility to quality care for a broad spectrum of individuals.
Offers a balance of services and community atmosphere.
Lower occupancy suggests more openings may be available.
Most residents stay for extended periods and receive ongoing daily care.
15% of new residents, usually for short-term rehab.
49% of new residents, often for short stays.
35% of new residents, often for long-term daily care.
Longview Hill Nursing Center and Rehabilitation is administrated by Leo Sanders.
Key information about the people who lead and staff this community.
In Texas, the Health and Human Services Commission (HHSC) is the primary regulatory body that conducts unannounced inspections and publishes quality reports for all long-term care homes.
7 visits/inspections triggered by complaints
3 routine inspections
10 with issues
1 without issues
Deficiencies indicate regulatory issues. A higher number implies the facility had several areas requiring improvement.
Texas average: 32 deficiencies
Texas average 7.4
Last Health inspection on Sep 2025
Texas average 25.9
Texas average 3.67
Health citations are formal notices following inspections when they fail to comply with safety and care standards.
33 of 69 citations resulted from standard inspections; 16 of 69 resulted from complaint investigations; and 20 of 69 came from combined inspections (standard and complaint).
Texas average: 2
Texas average: 0.4
Data sourced from CMS Health Deficiencies reports. Citation severity codes range from A (least serious) to L (most serious). Immediate Jeopardy (J-L) citations indicate situations where the facility's noncompliance has placed residents at risk of death or serious harm.
Assisted Living A licensed, long-term care setting for seniors or individuals with disabilities who need help with daily activities — like bathing, dressing, and medication management — but not 24-hour skilled nursing. Offers housing, meals, and around-the-clock support while aiming to maximize resident independence.
Independent Living Lifestyle-focused communities for older adults offering dining, activities, and transportation with minimal personal care. Best for active, independent seniors who want community without medical support.
Memory Care Secured, specialized care for people living with Alzheimer's or dementia. Staff trained in cognitive impairment, with higher staff-to-resident ratios and an environment designed to reduce confusion and wandering risk.
Nursing Home Licensed facility providing 24/7 skilled nursing care for residents with complex, ongoing medical needs. Staffed by RNs, LPNs, and CNAs. Inspected and star-rated annually by CMS. Accepts Medicare (short-term rehab) and Medicaid (long-term care).
Nursing Home Licensed facility providing 24/7 skilled nursing care for residents with complex, ongoing medical needs. Staffed by RNs, LPNs, and CNAs. Inspected and star-rated annually by CMS. Accepts Medicare (short-term rehab) and Medicaid (long-term care).
Respite Care Short-term temporary care — days to weeks — to give family caregivers a break. Full care provided during the stay. Often used after hospitalization or to trial a facility before a permanent placement decision.
Home Care Professional care delivered in the person's own home — from companionship and errands to skilled nursing and therapy. Allows seniors to age in place. Medicare covers skilled home health when medically necessary.
Home Care Professional care delivered in the person's own home — from companionship and errands to skilled nursing and therapy. Allows seniors to age in place. Medicare covers skilled home health when medically necessary.
Nursing Home Licensed facility providing 24/7 skilled nursing care for residents with complex, ongoing medical needs. Staffed by RNs, LPNs, and CNAs. Inspected and star-rated annually by CMS. Accepts Medicare (short-term rehab) and Medicaid (long-term care).
Respite Care Short-term temporary care — days to weeks — to give family caregivers a break. Full care provided during the stay. Often used after hospitalization or to trial a facility before a permanent placement decision.
Home Care Professional care delivered in the person's own home — from companionship and errands to skilled nursing and therapy. Allows seniors to age in place. Medicare covers skilled home health when medically necessary.
Memory Care Secured, specialized care for people living with Alzheimer's or dementia. Staff trained in cognitive impairment, with higher staff-to-resident ratios and an environment designed to reduce confusion and wandering risk.
Nursing Home Licensed facility providing 24/7 skilled nursing care for residents with complex, ongoing medical needs. Staffed by RNs, LPNs, and CNAs. Inspected and star-rated annually by CMS. Accepts Medicare (short-term rehab) and Medicaid (long-term care).
Respite Care Short-term temporary care — days to weeks — to give family caregivers a break. Full care provided during the stay. Often used after hospitalization or to trial a facility before a permanent placement decision.
Assisted Living A licensed, long-term care setting for seniors or individuals with disabilities who need help with daily activities — like bathing, dressing, and medication management — but not 24-hour skilled nursing. Offers housing, meals, and around-the-clock support while aiming to maximize resident independence.
Nursing Home Licensed facility providing 24/7 skilled nursing care for residents with complex, ongoing medical needs. Staffed by RNs, LPNs, and CNAs. Inspected and star-rated annually by CMS. Accepts Medicare (short-term rehab) and Medicaid (long-term care).
![]() 2.6 miles from city center — 0.1 miles to nearest hospital (Longview Occupational Medicine Clinic)
2.6 miles from city center — 0.1 miles to nearest hospital (Longview Occupational Medicine Clinic)
Add your location
This data corresponds to Q2 2025 and is based on CMS Payroll-Based Journal.
Texas average ratio: 1.51:1
Texas average: 8.1 hours
Manages medical care and health needs.
No contractors work on this role.
Assists with medical care and medications.
No contractors work on this role.
Helps with daily care and mobility.
No contractors work on this role.
Total hours from contractors
853 contractor hours this quarter
| Certified Nursing Assistant | 58 | 0 | 58 | 19,754 | 91 | 100% | 9 |
| Licensed Practical Nurse | 32 | 0 | 32 | 8,932 | 91 | 100% | 9 |
| Medication Aide/Technician | 12 | 0 | 12 | 2,918 | 90 | 99% | 10.6 |
| Registered Nurse | 15 | 0 | 15 | 2,644 | 85 | 93% | 9.3 |
| Clinical Nurse Specialist | 4 | 0 | 4 | 1,489 | 82 | 90% | 8.3 |
| Dietitian | 2 | 0 | 2 | 930 | 73 | 80% | 7.6 |
| RN Director of Nursing | 2 | 1 | 3 | 744 | 65 | 71% | 8.7 |
| Nurse Practitioner | 4 | 1 | 5 | 671 | 57 | 63% | 9.9 |
| Administrator | 3 | 0 | 3 | 552 | 65 | 71% | 8.5 |
| Other Dietary Services Staff | 1 | 0 | 1 | 483 | 61 | 67% | 7.9 |
| Mental Health Service Worker | 1 | 0 | 1 | 453 | 64 | 70% | 7.1 |
| Physical Therapy Aide | 0 | 2 | 2 | 439 | 61 | 67% | 7 |
| Occupational Therapy Aide | 0 | 1 | 1 | 103 | 20 | 22% | 5.1 |
| Occupational Therapy Assistant | 0 | 1 | 1 | 36 | 6 | 7% | 6 |
| Medical Director | 0 | 1 | 1 | 30 | 12 | 13% | 2.5 |
| Respiratory Therapy Technician | 0 | 1 | 1 | 17 | 3 | 3% | 5.5 |
Source: CMS Long-Term Care Facility Characteristics (Data as of Jan 2026)
Residents meet regularly to discuss policies, care quality, and activities
Family members meet regularly to discuss policies, care quality, and activities
Organized group of family members that meets regularly to discuss facility policies, resident care, and activities.
Organized group of residents that meets regularly to discuss facility policies, quality of life, and activities.
Data sourced from CMS Long-Term Care Facility Characteristics quarterly report. Payer mix reflects the current resident census by primary payment source.
These measures show how residents usually do over time at this home, based on health outcomes and preventive care.
Texas average: 8.6
Texas average: 16.0
Texas average: 16.2%
Texas average: 16.2%
Texas average: 15.7%
Texas average: 3.2%
Texas average: 4.4%
Texas average: 0.8%
Texas average: 3.5%
Texas average: 2.9%
Texas average: 7.9%
Texas average: 97.3%
Texas average: 97.9%
Texas average: 2.13
Texas average: 2.07
Texas average: 90.4%
Texas average: 1.4%
Texas average: 88.0%
Texas average: 25.9%
Texas average: 12.0%
Texas average: 0.8%
Texas average: 53.7%
Texas average: 50.6%
Quality measures are calculated from Minimum Data Set (MDS) assessments. For most measures, lower percentages indicate better care quality.
Federal penalties imposed by CMS for regulatory violations, including civil money penalties (fines) and denials of payment for new Medicare/Medicaid admissions.
Source: CMS Penalties Database (Data as of Jan 2026)
Texas average: $80K
Texas average: 2.5
Texas average: 0.2
Penalties are imposed by CMS for violations of federal nursing home regulations.
Last updated: Jan 2026
Historical financial and operational data for Longview Hill Nursing Center and Rehabilitation based on CMS SNF Cost Reports.
Loading trend charts...
Care Cost Calculator: See Prices in Your Area
Nursing Home Data Explorer
Don’t Wait Too Long: 7 Red Flag Signs Your Parent Needs Assisted Living Now
The True Cost of Assisted Living in 2025 – And How Families Are Paying For It
Understanding Senior Living Costs: Pricing Models, Discounts & Financial Assistance

Touring a community? Use this expert-backed checklist to stay organized, ask the right questions, and find the perfect fit.
We'll send you a PDF version of the touring checklist.