Lorien Bulle Rock
Nursing Home, Assisted Living, Memory Care & Respite Care · Aberdeen, MD
CMS overall rating Info CMS (the Centers for Medicare & Medicaid Services) is the federal agency that rates nursing home quality. Its Overall Rating runs from 1 to 5 stars, combining health inspections, staffing, and quality measures, with inspections weighted most heavily.

Lorien Bulle Rock

Nursing Home, Assisted Living, Memory Care & Respite Care · Aberdeen, MD
CMS overall rating Info CMS (the Centers for Medicare & Medicaid Services) is the federal agency that rates nursing home quality. Its Overall Rating runs from 1 to 5 stars, combining health inspections, staffing, and quality measures, with inspections weighted most heavily.
Calculator: See prices in your area
Lorien Bulle Rock accepts Medicare, Medicaid, and private pay.

Overview of Lorien Bulle Rock

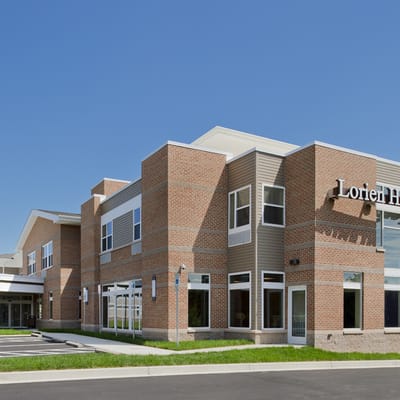
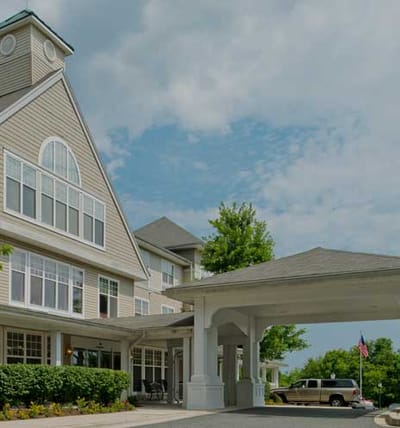
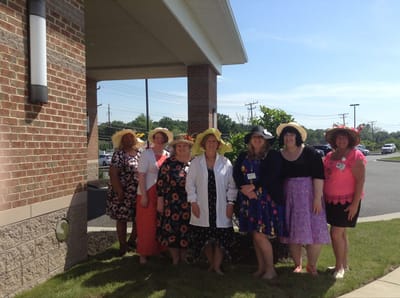
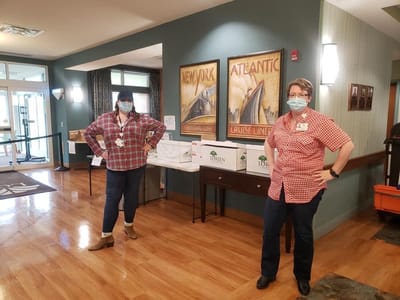
Lorien Bulle Rock is a highly regarded nursing home in Havre de Grace, MD, offering long-term care and rehabilitation. Promoting a nurturing and welcoming environment, the community ensures older adults are treated well throughout their stay. Residents also experience maintenance-free living with 24-hour care, well-balanced meals, and recreational activities. Through personalized care plans, residents receive the utmost attention and care for their unique needs and habits.

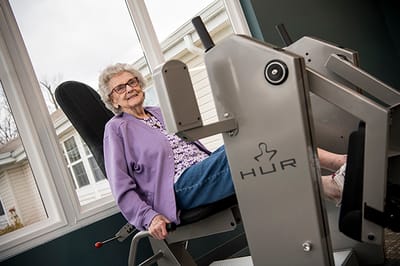
Light exercises, fun gatherings, and games provide residents with more opportunities to interact with friends and explore interests. Spacious common areas and thoughtfully furnished rooms also ensure residents’ relaxation and wellness. Set along Pulaski Highway, near bus stops and restaurants, the community guarantees accessibility and convenience. This nursing home is a good option for senior living in Maryland, especially with high standards of care and well-maintained amenities.

Quality ratings

Measured by Centers for Medicare & Medicaid Services (CMS)

Overall rating Info The Overall CMS Rating combines results from health inspections, staffing levels and quality measures. Health inspections carry the most weight. Staffing and quality scores can increase or decrease the final rating based on performance compared to state and national standards.
▲ 64.4% Above MD avg. ▲ 64.4% Above MD avg.MD average: 3.0Click the badge to see the full State ranking.Click here to see the full State ranking.
Health Inspection Info Based on the results of the facility's three most recent standard inspections and any complaint investigations. CMS reviews the number, scope, and severity of deficiencies, with more recent findings weighted more heavily.
▲ 77.5% Above MD avg. ▲ 77.5% Above MD avg.MD average: 2.8Click the badge to see the full State ranking.Click here to see the full State ranking.
Staffing Info Measures average nursing staff hours per resident per day, including Registered Nurses (RNs) and total nursing staff. Ratings are adjusted based on the level of care residents require and are compared to state and national benchmarks.
▲ 31.3% Above MD avg. ▲ 31.3% Above MD avg.MD average: 3.0Click the badge to see the full State ranking.Click here to see the full State ranking.
Quality Measures Info Based on clinical and physical health indicators reported to CMS, such as hospital readmissions, falls, pressure ulcers, and improvements in mobility. These measures reflect how well residents' health needs are being managed.
▲ 8.2% Above MD avg. ▲ 8.2% Above MD avg.MD average: 3.7Click the badge to see the full State ranking.Click here to see the full State ranking.

Staffing hours breakdown

Info Daily nursing hours per resident by staff type, reported to CMS. Higher is generally better — compare this facility to state and national averages to see where staffing stands.

Hours per resident per day — compared to Maryland state averages

Total nursing care / resident Info Total adjusted nursing hours per resident per day, combining RN, LPN, and aide time. CMS adjusts this for case-mix so facilities can be fairly compared.
4h 30m per day
This facility Maryland avg (3h 46m per day)
vs Maryland avg
+19%

1 of 6 metrics below state avg

Standout metric Weekend RN is +23% above state avg
Staff typeHours / Day / Residentvs state avg
Registered Nurse (RN) Info RNs hold the highest nursing license and can assess residents, interpret test results, and direct care plans. More RN hours per day often signals stronger clinical oversight and faster response to health changes. 49m per day ■ Avg State avg: 49m per day · National avg: 41m per day
LPN / LVN Info Licensed Practical Nurses (LPNs) or Licensed Vocational Nurses (LVNs) deliver routine hands-on care — medication administration, wound dressing, and monitoring vital signs. They work under RN supervision and make up a large share of daily bedside care. 1h 4m per day ▲ 17% State avg: 55m per day · National avg: 52m per day
Nurse Aide Info Certified Nurse Aides (CNAs) provide the most direct day-to-day assistance: bathing, dressing, feeding, and mobility. Nurse aide hours are typically the largest staffing category and directly affect residents' quality of life. 2h 10m per day ■ Avg State avg: 2h 8m per day · National avg: 2h 20m per day
Weekend Total Nursing Info Combined nursing hours (RN + LPN + Nurse Aide) per resident per day on weekends. Staffing often drops on weekends — this figure reveals whether the facility maintains adequate coverage outside of weekday hours. 3h 42m per day ▲ 5% State avg: 3h 31m per day · National avg: 3h 27m per day
Physical Therapist Info Hours per resident per day provided by licensed Physical Therapists (PTs) or PT Assistants. PT services help residents recover mobility after injury or illness and are especially important for post-acute (short-stay) rehabilitation. 5m per day ▼ 19% State avg: 6m per day · National avg: 4m per day
Weekend RN Info Registered nurse hours specifically on weekends. Facilities sometimes reduce RN presence on Saturdays and Sundays — a low weekend RN figure compared to weekday hours can indicate reduced clinical oversight when most administrative staff are absent. 45m per day ▲ 23% State avg: 37m per day · National avg: 29m per day

Capacity and availability

This home usually has limited availability

Higher occupancy than the Maryland average: 82.4%
Occupancy rate
91.6%
Avg. Length of Stay
79 days
Bed community size
78-bed community Rank #181 / 697Bed count — State benchmarkedThis home is ranked 181st out of 697 homes in Maryland. Shows this facility's certified or reported bed count compared to other Maryland facilities. Larger communities may offer more amenities, programs, and on-site services for residents and families.Rankings are based only on facilities in Maryland that report data for that category. Facilities without available data are excluded from the ranking.Click the rank badge to see the full State ranking.Click here to see the full State ranking.
A larger shared setting that may offer more common spaces and organized community services.
Walk Score
Walk Score: 36 / 100 Rank #563 / 985Walk Score — State benchmarkedThis home is ranked 563rd out of 985 homes in Maryland. Shows how walkable this facility's neighborhood is compared to the average Walk Score across Maryland facilities. Higher scores benefit residents, families, and staff.Rankings are based only on facilities in Maryland that report data for that category. Facilities without available data are excluded from the ranking.Click the rank badge to see the full State ranking.Click here to see the full State ranking.
Somewhat walkable. A few nearby services may be reachable on foot, but most trips require transportation.

About this community

Awards

High Performing Nursing Homes

License Details

License NumberR3351

Safety & Compliance

Safety FeaturesSmoke Free Community

Therapy & Rehabilitation

2 services
Rehabilitation Services
Respite Care

Staffing & Medical

1 service
24-Hour Staffing

Additional Services

1 service
Home Care

Amenities & Lifestyle

Gym
ActivitiesDaily activities are offered, including off-site trips.
Specific ProgramsServices Offered, Sub-Acute Rehab / Skilled Nursing, Rehabilitation / Therapy, Assisted Living Short Stay, TeleMedicine, Hospice Services, Ventilator Care
Religious ServicesYes

Contact Lorien Bulle Rock

Staffing Data

Reporting period: October 1 – December 31, 2025 (Q4 2025). Source: CMS Payroll-Based Journal report.

Total staff 177
Employees 89
Contractors 88
Staff to resident ratio 2.68 : 1
48% more staff per resident than Maryland average
Maryland average ratio: 1.81 : 1 Maryland average ratio: 1.81 : 1See full Maryland ranking
Avg staff/day 46
Average shift 7.5 hours
6% worse than Maryland average
Maryland average: 8 hours Maryland average shift: 8 hoursSee full Maryland ranking
Total staff hours (quarter) 31,945

Nursing staff breakdown

Q4 2025 · Oct 1 – Dec 31 More info This data comes from the CMS Payroll-Based Journal report covering October 1 – December 31, 2025.
Registered Nurse

Manages medical care and health needs.

RN Staff Info 19 total: 15 full-time employees and 4 contractors. 19
Average shift length Info Average shift length. Calculated as total hours divided by days worked and average staff per day. 7.6 hours
Licensed Practical Nurse

Assists with medical care and medications.

LPN Staff Info 40 total: 13 full-time employees and 27 contractors. 40
Average shift length Info Average shift length. Calculated as total hours divided by days worked and average staff per day. 8.4 hours
Certified Nursing Assistant

Helps with daily care and mobility.

CNA Staff Info 68 total: 38 full-time employees and 30 contractors. 68
Average shift length Info Average shift length. Calculated as total hours divided by days worked and average staff per day. 7.3 hours

Contractor staffing

Q4 2025 · Oct 1 – Dec 31 More info This data comes from the CMS Payroll-Based Journal report covering October 1 – December 31, 2025.

Total hours from contractors

20.6%

6,592 contractor hours this quarter

Certified Nursing Assistant: 30 Licensed Practical Nurse: 27 Speech Language Pathologist: 5 Physical Therapy Assistant: 5 Registered Nurse: 4 Respiratory Therapy Technician: 4 Physical Therapy Aide: 4 Qualified Social Worker: 3 Dental Services Staff: 1 Clinical Nurse Specialist: 1 RN Director of Nursing: 1 Occupational Therapy Aide: 1 Medical Director: 1 Occupational Therapy Assistant: 1

Staff by category

Q4 2025 · Oct 1 – Dec 31 More info This data comes from the CMS Payroll-Based Journal report covering October 1 – December 31, 2025.
Certified Nursing Assistant38306812,22592100%7.3
Licensed Practical Nurse1327405,52192100%8.4
Registered Nurse154193,34292100%7.6
Clinical Nurse Specialist3141,3737480%7.6
Medication Aide/Technician7071,2948997%9.4
RN Director of Nursing2131,2248997%9.5
Other Dietary Services Staff2021,0759098%8.1
Speech Language Pathologist0551,0037885%7.2
Dental Services Staff2138946571%7.8
Physical Therapy Aide0446416975%5.8
Physical Therapy Assistant0555597582%6.6
Respiratory Therapy Technician0444986773%7.1
Administrator1014886166%8
Dietitian1014445762%7.8
Nurse Practitioner2024245358%8
Qualified Social Worker0333796773%5.5
Nurse Aide in Training2022663437%5.5
Occupational Therapy Aide1122523841%6.6
Medical Director011251011%2.5
Occupational Therapy Assistant0112133%7
68 Certified Nursing Assistant
% of Days 100%
40 Licensed Practical Nurse
% of Days 100%
19 Registered Nurse
% of Days 100%
4 Clinical Nurse Specialist
% of Days 80%
7 Medication Aide/Technician
% of Days 97%
3 RN Director of Nursing
% of Days 97%
2 Other Dietary Services Staff
% of Days 98%
5 Speech Language Pathologist
% of Days 85%
3 Dental Services Staff
% of Days 71%
4 Physical Therapy Aide
% of Days 75%
5 Physical Therapy Assistant
% of Days 82%
4 Respiratory Therapy Technician
% of Days 73%
1 Administrator
% of Days 66%
1 Dietitian
% of Days 62%
2 Nurse Practitioner
% of Days 58%
3 Qualified Social Worker
% of Days 73%
2 Nurse Aide in Training
% of Days 37%
2 Occupational Therapy Aide
% of Days 41%
1 Medical Director
% of Days 11%
1 Occupational Therapy Assistant
% of Days 3%

Penalties and fines

Federal penalties imposed by CMS for regulatory violations, including civil money penalties (fines) and denials of payment for new Medicare/Medicaid admissions.

Source: CMS Penalties Database

No penalties in the past 3 years

No civil money penalties or payment denials were reported in the last 3 years.

Quality of care over time

These measures show how residents usually do over time at this home, based on health outcomes and preventive care.

High-risk clinical events score Info A composite score based on pressure ulcers, falls with injury, weight loss, walking ability decline, and activities of daily living decline. 12.7
In line with Maryland average

Maryland average: 12.9

Functional decline score Info A composite score based on activities of daily living decline, walking ability decline, and incontinence. 25.0
In line with Maryland average

Maryland average: 25.7

Long-stay resident measures
Need for Help with Daily Activities Increased Info Percent of long-stay residents whose need for help with daily activities has increased 21.9%
8% better than Maryland average

Maryland average: 23.7%

Walking Ability Worsened Info Percent of long-stay residents whose ability to move independently worsened 27.6%
In line with Maryland average

Maryland average: 27.7%

Low Risk Residents with Bowel/Bladder Incontinence Info Percent of low risk long-stay residents who lose control of their bowels or bladder 25.6%
In line with Maryland average

Maryland average: 25.9%

Falls with Major Injury Info Percent of long-stay residents experiencing one or more falls with major injury 1.8%
21% better than Maryland average

Maryland average: 2.3%

High Risk Residents with Pressure Ulcers Info Percent of long-stay high risk residents with pressure ulcers 7.8%
20% worse than Maryland average

Maryland average: 6.5%

Urinary Tract Infection Info Percent of long-stay residents with a urinary tract infection 3.2%
99% worse than Maryland average

Maryland average: 1.6%

Lost Too Much Weight Info Percent of long-stay residents who lose too much weight 4.4%
24% better than Maryland average

Maryland average: 5.8%

Depressive Symptoms Info Percent of long-stay residents who have depressive symptoms 0.5%
97% better than Maryland average

Maryland average: 20.2%

Antipsychotic Use Info Percent of long-stay residents who received an antipsychotic medication 7.2%
44% better than Maryland average

Maryland average: 12.9%

Pneumococcal Vaccine Info Percent of long-stay residents assessed and appropriately given the pneumococcal vaccine 98.7%
7% better than Maryland average

Maryland average: 92.0%

Influenza Vaccine Info Percent of long-stay residents assessed and appropriately given the seasonal influenza vaccine 100.0%
In line with Maryland average

Maryland average: 96.6%

Short-stay resident measures
Pneumococcal Vaccine Info Percent of short-stay residents assessed and appropriately given the pneumococcal vaccine 95.8%
22% better than Maryland average

Maryland average: 78.4%

Antipsychotic medication increase Info Percent of short-stay residents who newly received an antipsychotic medication 0.5%
68% better than Maryland average

Maryland average: 1.4%

Influenza Vaccine Info Percent of short-stay residents assessed and appropriately given the seasonal influenza vaccine 98.0%
21% better than Maryland average

Maryland average: 80.6%

Breakdown by payment type

Medicare

66% of new residents, usually for short-term rehab.

Typical stay 25 days

Private pay

31% of new residents, often for short stays.

Typical stay 1 - 2 months

Medicaid

3% of new residents, often for long-term daily care.

Typical stay 4 years

Facility Characteristics

Source: CMS Long-Term Care Facility Characteristics (Data as of Jan 2026)

Total residents 66
Medicare
18
27.3% of residents
Medicaid
41
62.1% of residents
Private pay or other
7
10.6% of residents
Programs & Services
Residents Group

Residents meet regularly to discuss policies, care quality, and activities

Nurse Aide Training

State-approved Nurse Aide Training and Competency Evaluation Program on-site

Active Resident Council

Organized group of residents that meets regularly to discuss facility policies, quality of life, and activities.

Finances and operations

Based on CMS SNF Cost Report for fiscal year ending in 12/2023.

Voluntary non-profit community
Operated by a church.
Net patient revenue Info Net patient revenue — what the home actually collects for resident care, after contractual allowances, bad debt and discounts are subtracted from its gross charges (CMS cost report, Worksheet G-3). It covers resident care only; money the home earns from other sources is shown separately as "Other income."
$11.5M
Net patient income Info Net patient income: net patient revenue minus the home's total operating expenses. A positive figure means it earns more from resident care than it spends to deliver it; a negative figure means the opposite. It excludes non-operating "other income."
-$2.0M
Voluntary non-profit community Operated by a church.
Net patient revenue Info Net patient revenue — what the home actually collects for resident care, after contractual allowances, bad debt and discounts are subtracted from its gross charges (CMS cost report, Worksheet G-3). It covers resident care only; money the home earns from other sources is shown separately as "Other income."
$11.5M
Net patient income Info Net patient income: net patient revenue minus the home's total operating expenses. A positive figure means it earns more from resident care than it spends to deliver it; a negative figure means the opposite. It excludes non-operating "other income."
-$2.0M
Other income Info Money the home earns outside of resident care — such as investments, grants, rentals and other non-operating sources (CMS cost report, Worksheet G-3). It is tracked separately from net patient revenue: it is not part of that figure, and it is not included in net patient income.
$109.3K
Payroll costs Info Staff salaries plus wage-related costs — benefits such as payroll taxes, health insurance and retirement — from the home's own accounting records (CMS cost report, Worksheet A). Contract or agency labor is counted separately, under other operating costs.
$6.1M 53% of net patient revenue Info Payroll as a share of revenue: staff salaries and wage-related benefits divided by net patient revenue. A higher figure means more of each revenue dollar goes to staff pay. Rank #33 / 148Payroll % — State benchmarkedThis home is ranked 33rd out of 148 homes in Maryland. Shows payroll as a percentage of revenue versus the Maryland average. Well-run Maryland facilities typically land around 49–57% — the top third Statewide. Below 25% may signal understaffing or heavy agency use — read with Staffing ratings.Rankings are based only on facilities in Maryland that report data for that category. Facilities without available data are excluded from the ranking.Click the rank badge to see the full State ranking.Click here to see the full State ranking.
Other operating costs Info Everything it costs to run the home apart from payroll — food, utilities, supplies, maintenance, contract labor and administration. Calculated as total operating expense minus payroll (staff salaries and wage-related benefits).
$7.3M
Total costs Info The home's total operating expense for the year — all the costs of running it, salaries included (CMS cost report, Worksheet G-3).
$13.4M

What does this home offer?

Housing options icon

Housing Options: Private/Semi-Private Rooms

Building type icon
Building type icon

Building Type: 2-story

On-site medical care and health services icon

On-site Medical Care and Health Services

Rehabilitative support icon

Rehabilitative Support
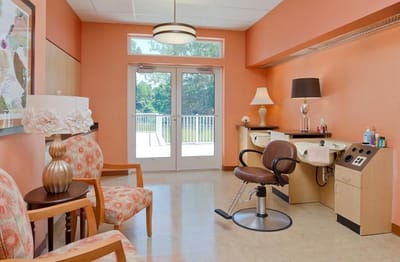
Beauty services icon

Beauty Services

Social and recreational activities icon

Social and Recreational Activities

Transportation services icon

Transportation Services

Who this home usually serves

TYPE OF STAY

Mostly short-term rehab stays

Most residents typically stay for a few weeks or months before returning home or moving on.

Most new residents arrive under Medicare (66% of admissions), and a typical Medicare stay runs around 25 days.

Admissions
348 total

Coverage residents most often arrive under.

Medicare 66%
Private pay 31%
Medicaid 3%
Discharges
329 total

Coverage residents most often leave under.

Medicare 55%
Private pay 34%
Medicaid 11%

Living Spaces & Floor Plans for Lorien Bulle Rock

Lorien Columbia, Nursing Home in Columbia, MD — Announcement of upcoming floor plans on green background
Floor Plan
Floor plan
Floor Plan

Places of interest near Lorien Bulle Rock

Address 2.6 miles from city center Info Estimated distance in miles from Havre De Grace's city center to Lorien Bulle Rock's address, calculated via Google Maps.

Calculate Travel Distance to Lorien Bulle Rock

Add your location

Address

Compare Nursing Homes around Aberdeen

The information below is reported by the Maryland Department of Health, Office of Health Care Quality.

3 facilities compared · CMS & MD Dept. of Health data

Lorien Bulle Rock
NH
AL
MC
RC
Havre De Grace
78
Facility 78
MD AVG 43
Rank #181 / 697
91.6% +11%4.50 -22%+19%$0
33
Facility 33
MD AVG 49.9
Rank #47 / 149
11.0-69-
36
Facility 36
MD AVG 43
Rank #563 / 985
-$11.5M$6.1M
53%
Facility 53%
MD AVG 38.5%
Rank #33 / 148
215359
Citizens Care Center
NH
HC
MC
RC
Havre De Grace
184
Facility 184
MD AVG 43
Rank #15 / 697
61.5% -25%4.61 +17%+22%$0
42
Facility 42
MD AVG 49.9
Rank #77 / 149
10.51120-
74
Facility 74
MD AVG 43
Rank #147 / 985
Peter Panos$15.5M$9.0M
58%
Facility 58%
MD AVG 38.5%
Rank #36 / 148
215039
Sterling Care
NH
AL
HC
MC
NC
PC
RC
Bel Air (East Macphail Road)
155
Facility 155
MD AVG 43
Rank #39 / 697
85.2% +3%3.22 -52%-15%$0
48
Facility 48
MD AVG 49.9
Rank #92 / 149
9.64128A+
27
Facility 27
MD AVG 43
Rank #668 / 985
-$18.5M$8.2M
44.6%
Facility 44.6%
MD AVG 38.5%
Rank #136 / 148
215312

Financial Assistance for
Nursing Home in Maryland

Lorien Bulle Rock is located in Havre De Grace, Maryland.
Here are the financial assistance programs available to residents in Maryland.

Get Financial aid guidance

Community Options Waiver

Maryland Medicaid Community Options Waiver

Age 65+ or disabled
General Maryland resident, Medicaid- eligible, nursing home-level care need.
Income Limits (2025) ~$2,829/month 300% FBR, individual
Asset Limits $2,000 (individual), $3,000 (couple) (excludes home, car).
MD

High urban demand; rural outreach efforts.

Benefits
Personal care (5-7 hours/day, e.g., bathing, dressing) Respite care (up to 240 hours/year) Adult day care ($70/day) Home modifications ($1,500 avg.)

Senior Care Program

Maryland Senior Care

Age 65+
General Maryland resident, at risk of nursing home placement.
Income Limits ~$2,000/month individual, varies by county
Asset Limits $11,000 individual
MD

Limited funding; waitlists common in high-demand areas.

Benefits
In-home care (3-5 hours/week) Respite care (up to 10 days/year) Meals (~$6/meal) Transportation (~5 trips/month) Case management

Maryland Nursing Home Medicaid

Maryland Medical Assistance (Medicaid) Nursing Home Program

Age 65+
General Maryland resident, Medicaid-eligible, requires nursing home-level care.
Income Limits (2025) $943/month (individual); most income applied to care costs.
Asset Limits $2,500 (individual), $3,000 (couple); spousal protections up to $155,356.
MD

Home equity limit $636,000; estate recovery applies post-55.

Benefits
24/7 nursing care Meals Therapy Medications (unlimited per medical need)

Senior Assisted Living Subsidy Program

Maryland Senior Assisted Living Group Home Subsidy

Age 62+
General Maryland resident, in or moving to approved assisted living, low/moderate income.
Income Limits (2025) ~$34,000/year individual, varies by county
Asset Limits Not strict; prioritizes low-income.
MD

Not available statewide; facility must be licensed by MDH.

Benefits
Personal care Meals 24-hour supervision (up to $1,500/month subsidy typical)

Veterans Aid and Attendance (A&A) Benefit

Maryland VA Aid and Attendance

Age
General Wartime veteran/spouse, age 65+ or disabled, needs ADL help, Maryland resident.
Income Limits (2025) Net income minus medical expenses < $1,984/month individual with A&A
Asset Limits $155,356 net worth limit
MD

High veteran population in suburban/rural areas.

Benefits
Cash benefit ($1,478-$2,471/month, varies by status) for care costs

Senior Prescription Drug Assistance Program (SPDAP)

Maryland Senior Prescription Drug Assistance Program

Age 65+
General Maryland resident (6+ months), Medicare Part D enrolled.
Income Limits (2025) $48,560/year individual, 300% FPL
Asset Limits None specified.
MD

Supplements Medicare Part D; annual enrollment required.

Benefits
Up to $40/month premium subsidy Reducing drug costs

Medicare Savings Programs (MSP)

Maryland Medicare Savings Programs

Age 65+
General Maryland resident, Medicare Part A/B enrollee.
Income Limits (2025) $2,014/month (QMB), $2,706/month (SLMB/QI, individual).
Asset Limits $9,090 (individual), $13,630 (couple).
MD

Includes QMB, SLMB, QI categories.

Benefits
Covers premiums (up to $174.70/month Part B) Co-pays Deductibles

Community Personal Assistance Services (CPAS)

Maryland Medicaid Community Personal Assistance Services

Age 65+
General Maryland resident, Medicaid-eligible, needs ADL assistance.
Income Limits (2025) $943/month (individual); spend-down available.
Asset Limits $2,500 (individual), $3,000 (couple).
MD

Consumer-directed option allows hiring family caregivers.

Benefits
Personal care (hours vary, typically 20-30/week) Chores Nurse supervision

Frequently Asked Questions about Lorien Bulle Rock

Is Lorien Bulle Rock in a walkable area?

Lorien Bulle Rock has a walk score of 36. Somewhat walkable. A few nearby services may be reachable on foot, but most trips require transportation.

What is the occupancy rate at Lorien Bulle Rock?

Lorien Bulle Rock's occupancy is 91.6%.

Does Lorien Bulle Rock have different floorplan options?

Yes — see the floorplan options available at Lorien Bulle Rock on this page.

Are there photos of Lorien Bulle Rock?

Yes — there are 32 photos of Lorien Bulle Rock in the photo gallery on this page.

What is the address of Lorien Bulle Rock?

Lorien Bulle Rock is located at 1501 Blenheim Farm Lane, Havre De Grace, MD 21078.

What is the phone number of Lorien Bulle Rock?

(410) 939-9300 will put you in contact with the team at Lorien Bulle Rock.

Is Lorien Bulle Rock Medicare or Medicaid certified?

Yes — Lorien Bulle Rock is a CMS-certified provider of Medicare and Medicaid.

Guides for Better Senior Living

Care Cost Calculator: See Prices in Your Area

Nursing Home Data Explorer

Don’t Wait Too Long: 7 Red Flag Signs Your Parent Needs Assisted Living Now

The True Cost of Assisted Living in 2025 – And How Families Are Paying For It

Understanding Senior Living Costs: Pricing Models, Discounts & Financial Assistance