Magnolia Place Assisted Living & Memory Care
Nursing Home, Assisted Living & Memory Care · Holiday Island, AR
CMS overall rating Info CMS (the Centers for Medicare & Medicaid Services) is the federal agency that rates nursing home quality. Its Overall Rating runs from 1 to 5 stars, combining health inspections, staffing, and quality measures, with inspections weighted most heavily.

Magnolia Place Assisted Living & Memory Care

Nursing Home, Assisted Living & Memory Care · Holiday Island, AR
CMS overall rating Info CMS (the Centers for Medicare & Medicaid Services) is the federal agency that rates nursing home quality. Its Overall Rating runs from 1 to 5 stars, combining health inspections, staffing, and quality measures, with inspections weighted most heavily.

Overview of Magnolia Place Assisted Living & Memory Care

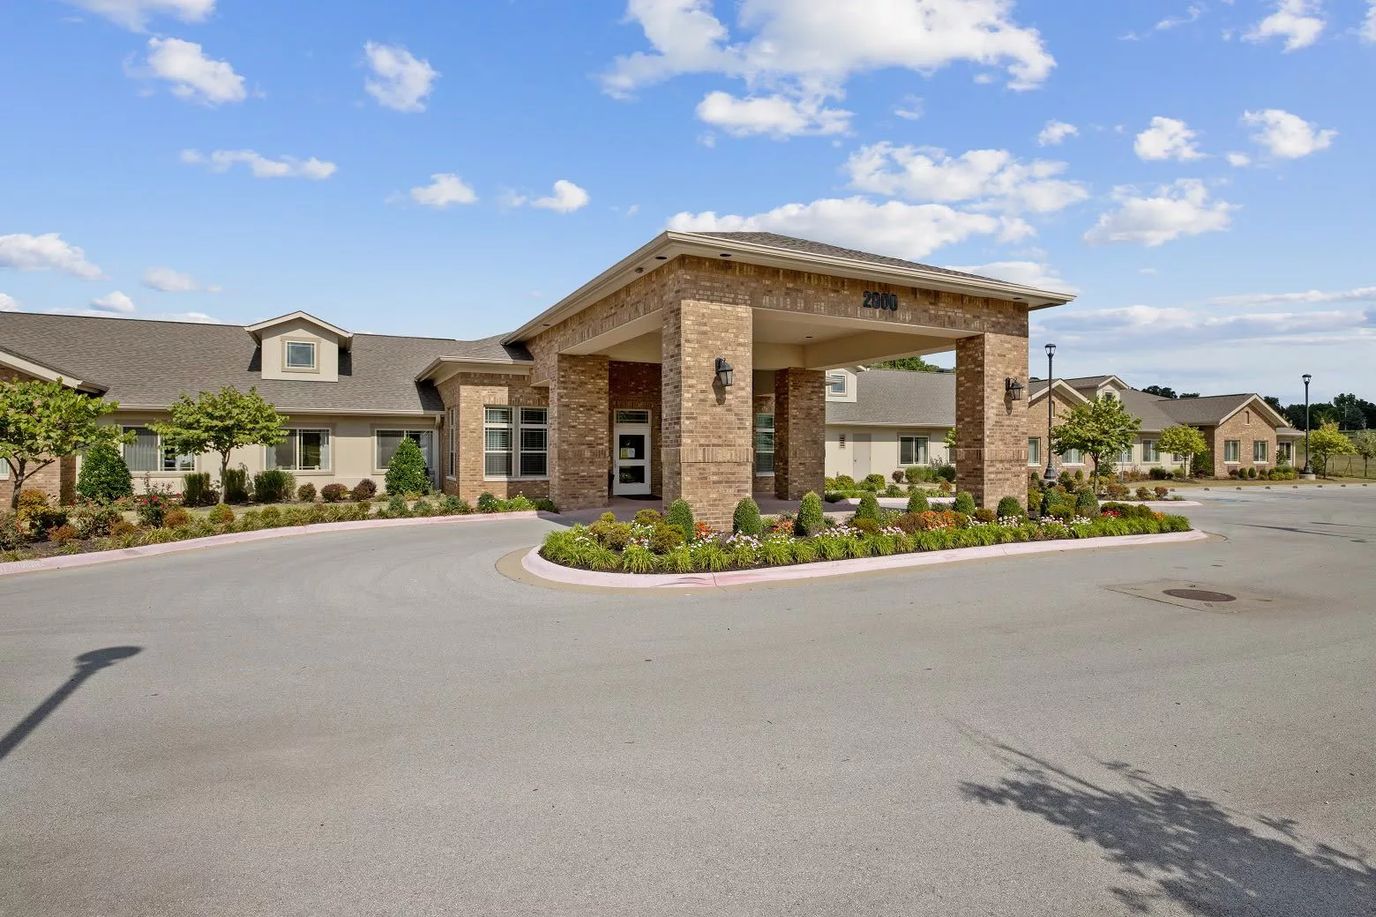
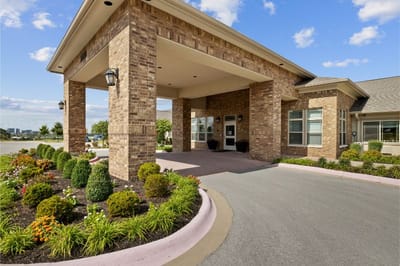
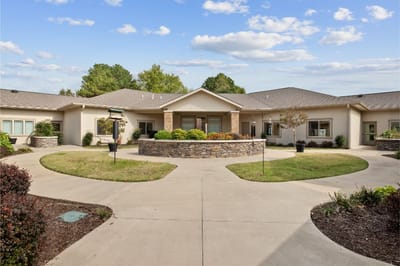
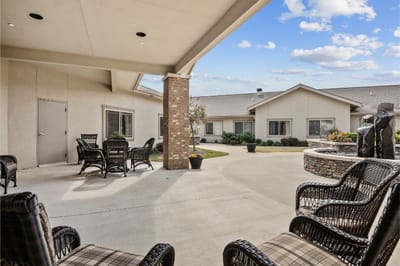
Known as an inviting assisted living and memory care community in Rogers, Arkansas, Magnolia Place offers senior residents a nurturing environment where they can truly flourish. What sets them apart is their unwavering commitment to providing personalized care tailored to each senior resident’s unique needs. With a dedication to improving the well-being of each individual, this community stands as a place where senior residents thrive, thanks to the thoughtful and holistic care provided.

At Magnolia Place, Person-Centered care and Life Enrichment Programs are the cornerstones of their philosophy, all aimed at enhancing the quality of life for senior residents. Their primary goal is to create an empowering environment where senior residents can make healthy choices, honor their dignity, and foster well-being. This commitment is reflected in their all-inclusive assisted living and memory care options. Set in a charming small town, this location captivates with its picturesque 400 acres of forest, 24 parks, and 70 miles of greenways and bike trails.

(479) 326-7255

Quality ratings

Measured by Centers for Medicare & Medicaid Services (CMS)

Overall rating Info The Overall CMS Rating combines results from health inspections, staffing levels and quality measures. Health inspections carry the most weight. Staffing and quality scores can increase or decrease the final rating based on performance compared to state and national standards.
▲ 59.4% Above AR avg. ▲ 59.4% Above AR avg.AR average: 3.1Click the badge to see the full State ranking.Click here to see the full State ranking.
Health Inspection Info Based on the results of the facility's three most recent standard inspections and any complaint investigations. CMS reviews the number, scope, and severity of deficiencies, with more recent findings weighted more heavily.
▲ 73.0% Above AR avg. ▲ 73.0% Above AR avg.AR average: 2.9Click the badge to see the full State ranking.Click here to see the full State ranking.
Staffing Info Measures average nursing staff hours per resident per day, including Registered Nurses (RNs) and total nursing staff. Ratings are adjusted based on the level of care residents require and are compared to state and national benchmarks.
▲ 25.6% Above AR avg. ▲ 25.6% Above AR avg.AR average: 3.2Click the badge to see the full State ranking.Click here to see the full State ranking.
Quality Measures Info Based on clinical and physical health indicators reported to CMS, such as hospital readmissions, falls, pressure ulcers, and improvements in mobility. These measures reflect how well residents' health needs are being managed.
▲ 36.6% Above AR avg. ▲ 36.6% Above AR avg.AR average: 3.7Click the badge to see the full State ranking.Click here to see the full State ranking.

Staffing hours breakdown

Info Daily nursing hours per resident by staff type, reported to CMS. Higher is generally better — compare this facility to state and national averages to see where staffing stands.

Hours per resident per day — compared to Arkansas state averages

Total nursing care / resident Info Total adjusted nursing hours per resident per day, combining RN, LPN, and aide time. CMS adjusts this for case-mix so facilities can be fairly compared.
4h 46m per day
This facility Arkansas avg (4h 40m per day)
vs Arkansas avg
+2%

4 of 6 metrics below state avg

Standout metric Nurse Aide is +10% above state avg
Staff typeHours / Day / Residentvs state avg
Registered Nurse (RN) Info RNs hold the highest nursing license and can assess residents, interpret test results, and direct care plans. More RN hours per day often signals stronger clinical oversight and faster response to health changes. 19m per day ▼ 19% State avg: 24m per day · National avg: 41m per day
LPN / LVN Info Licensed Practical Nurses (LPNs) or Licensed Vocational Nurses (LVNs) deliver routine hands-on care — medication administration, wound dressing, and monitoring vital signs. They work under RN supervision and make up a large share of daily bedside care. 52m per day ▼ 9% State avg: 58m per day · National avg: 52m per day
Nurse Aide Info Certified Nurse Aides (CNAs) provide the most direct day-to-day assistance: bathing, dressing, feeding, and mobility. Nurse aide hours are typically the largest staffing category and directly affect residents' quality of life. 3h 2m per day ▲ 10% State avg: 2h 45m per day · National avg: 2h 20m per day
Weekend Total Nursing Info Combined nursing hours (RN + LPN + Nurse Aide) per resident per day on weekends. Staffing often drops on weekends — this figure reveals whether the facility maintains adequate coverage outside of weekday hours. 3h 44m per day ▲ 6% State avg: 3h 32m per day · National avg: 3h 27m per day
Physical Therapist Info Hours per resident per day provided by licensed Physical Therapists (PTs) or PT Assistants. PT services help residents recover mobility after injury or illness and are especially important for post-acute (short-stay) rehabilitation. 0m per day ▼ 76% State avg: 2m per day · National avg: 4m per day
Weekend RN Info Registered nurse hours specifically on weekends. Facilities sometimes reduce RN presence on Saturdays and Sundays — a low weekend RN figure compared to weekday hours can indicate reduced clinical oversight when most administrative staff are absent. 12m per day ▼ 25% State avg: 16m per day · National avg: 29m per day
Bed community size
140-bed community Rank #17 / 330Bed count — State benchmarkedThis home is ranked 17th out of 330 homes in Arkansas. Shows this facility's certified or reported bed count compared to other Arkansas facilities. Larger communities may offer more amenities, programs, and on-site services for residents and families.Rankings are based only on facilities in Arkansas that report data for that category. Facilities without available data are excluded from the ranking.Click the rank badge to see the full State ranking.Click here to see the full State ranking.
A larger shared setting that may offer more common spaces and organized community services.
Walk Score
Walk Score: 36 / 100 Rank #191 / 419Walk Score — State benchmarkedThis home is ranked 191st out of 419 homes in Arkansas. Shows how walkable this facility's neighborhood is compared to the average Walk Score across Arkansas facilities. Higher scores benefit residents, families, and staff.Rankings are based only on facilities in Arkansas that report data for that category. Facilities without available data are excluded from the ranking.Click the rank badge to see the full State ranking.Click here to see the full State ranking.
Somewhat walkable. A few nearby services may be reachable on foot, but most trips require transportation.
BBB Rating
BBB Rating: A+ (Not Accredited)
An independent rating from the Better Business Bureau based on factors such as complaint history, transparency, and business practices.
How BBB ratings work

Staffing

Key information about the people who lead and staff this community.

Leadership

ContactAdministrator

Contact Magnolia Place Assisted Living & Memory Care

Health Inspection History

Inspections since 2024
Total health inspections 1

Arkansas average 4.2


Last Health inspection on Dec 2024

Total health citations
3

Arkansas average 21.8

Citations per inspection
3

Arkansas average 5.32


Health citations are formal notices following inspections when they fail to comply with safety and care standards.

All 3 citations resulted from standard inspections.

Breakdown of citation severity (last 2 years)
Critical health citations
0
100% better than Arkansas average

Arkansas average: 0.4


Serious health citations
0
100% better than Arkansas average

Arkansas average: 0.2

0 critical citations Arkansas average: 0.4

0 serious citations Arkansas average: 0.2

3 moderate citations Arkansas average: 20.9

0 minor citations Arkansas average: 0.4
Citations history (last 2 years)
Nutrition moderate citation Dec 12, 2024
Corrected

Care Planning moderate citation Dec 12, 2024
Corrected

Care Planning moderate citation Dec 12, 2024
Corrected

Staffing Data

Reporting period: October 1 – December 31, 2025 (Q4 2025). Source: CMS Payroll-Based Journal report.

Total staff 199
Employees 169
Contractors 30
Staff to resident ratio 2.37 : 1
49% more staff per resident than Arkansas average
Arkansas average ratio: 1.59 : 1 Arkansas average ratio: 1.59 : 1See full Arkansas ranking
Avg staff/day 62
Average shift 9.2 hours
15% better than Arkansas average
Arkansas average: 8 hours Arkansas average shift: 8 hoursSee full Arkansas ranking
Total staff hours (quarter) 52,430

Nursing staff breakdown

Q4 2025 · Oct 1 – Dec 31 More info This data comes from the CMS Payroll-Based Journal report covering October 1 – December 31, 2025.
Registered Nurse

Manages medical care and health needs.

RN Staff Info All 5 RN Staff are full-time employees. No contractors work on this role. 5
Average shift length Info Average shift length. Calculated as total hours divided by days worked and average staff per day. 8.3 hours
Licensed Practical Nurse

Assists with medical care and medications.

LPN Staff Info All 24 LPN Staff are full-time employees. No contractors work on this role. 24
Average shift length Info Average shift length. Calculated as total hours divided by days worked and average staff per day. 9.8 hours
Certified Nursing Assistant

Helps with daily care and mobility.

CNA Staff Info All 82 CNA Staff are full-time employees. No contractors work on this role. 82
Average shift length Info Average shift length. Calculated as total hours divided by days worked and average staff per day. 10 hours

Contractor staffing

Q4 2025 · Oct 1 – Dec 31 More info This data comes from the CMS Payroll-Based Journal report covering October 1 – December 31, 2025.

Total hours from contractors

2.2%

1,154 contractor hours this quarter

Physical Therapy Aide: 7 Qualified Social Worker: 6 Respiratory Therapy Technician: 5 Physical Therapy Assistant: 5 Speech Language Pathologist: 3 Occupational Therapy Aide: 1 Clinical Nurse Specialist: 1 Occupational Therapy Assistant: 1 Medical Director: 1

Staff by category

Q4 2025 · Oct 1 – Dec 31 More info This data comes from the CMS Payroll-Based Journal report covering October 1 – December 31, 2025.
Certified Nursing Assistant8208226,24492100%10
Licensed Practical Nurse240247,63392100%9.8
Medication Aide/Technician150156,15092100%9.7
Nurse Aide in Training230232,5738390%8.6
RN Director of Nursing5052,4388491%8.6
Registered Nurse5051,6918896%8.3
Clinical Nurse Specialist6171,56292100%8.5
Occupational Therapy Aide2138277076%7.9
Administrator2026326470%8
Nurse Practitioner2024886166%8
Dental Services Staff1014796470%7.5
Dietitian1014326166%7.1
Other Dietary Services Staff1014165863%7.2
Speech Language Pathologist0333706368%5.9
Physical Therapy Aide0771986773%2.4
Physical Therapy Assistant055994650%1.7
Qualified Social Worker066904852%1.8
Respiratory Therapy Technician055774043%1.9
Occupational Therapy Assistant0112333%7.5
Medical Director0111233%4
82 Certified Nursing Assistant
% of Days 100%
24 Licensed Practical Nurse
% of Days 100%
15 Medication Aide/Technician
% of Days 100%
23 Nurse Aide in Training
% of Days 90%
5 RN Director of Nursing
% of Days 91%
5 Registered Nurse
% of Days 96%
7 Clinical Nurse Specialist
% of Days 100%
3 Occupational Therapy Aide
% of Days 76%
2 Administrator
% of Days 70%
2 Nurse Practitioner
% of Days 66%
1 Dental Services Staff
% of Days 70%
1 Dietitian
% of Days 66%
1 Other Dietary Services Staff
% of Days 63%
3 Speech Language Pathologist
% of Days 68%
7 Physical Therapy Aide
% of Days 73%
5 Physical Therapy Assistant
% of Days 50%
6 Qualified Social Worker
% of Days 52%
5 Respiratory Therapy Technician
% of Days 43%
1 Occupational Therapy Assistant
% of Days 3%
1 Medical Director
% of Days 3%

Penalties and fines

Federal penalties imposed by CMS for regulatory violations, including civil money penalties (fines) and denials of payment for new Medicare/Medicaid admissions.

Source: CMS Penalties Database

No penalties in the past 3 years

No civil money penalties or payment denials were reported in the last 3 years.

Quality of care over time

These measures show how residents usually do over time at this home, based on health outcomes and preventive care.

High-risk clinical events score Info A composite score based on pressure ulcers, falls with injury, weight loss, walking ability decline, and activities of daily living decline. 10.1
32% worse than Arkansas average

Arkansas average: 7.7

Functional decline score Info A composite score based on activities of daily living decline, walking ability decline, and incontinence. 17.6
32% worse than Arkansas average

Arkansas average: 13.3

Long-stay resident measures
Need for Help with Daily Activities Increased Info Percent of long-stay residents whose need for help with daily activities has increased 15.7%
36% worse than Arkansas average

Arkansas average: 11.5%

Walking Ability Worsened Info Percent of long-stay residents whose ability to move independently worsened 22.2%
66% worse than Arkansas average

Arkansas average: 13.4%

Low Risk Residents with Bowel/Bladder Incontinence Info Percent of low risk long-stay residents who lose control of their bowels or bladder 14.9%
In line with Arkansas average

Arkansas average: 15.1%

Falls with Major Injury Info Percent of long-stay residents experiencing one or more falls with major injury 3.9%
In line with Arkansas average

Arkansas average: 3.9%

High Risk Residents with Pressure Ulcers Info Percent of long-stay high risk residents with pressure ulcers 3.3%
30% better than Arkansas average

Arkansas average: 4.7%

Urinary Tract Infection Info Percent of long-stay residents with a urinary tract infection 0.4%
72% better than Arkansas average

Arkansas average: 1.3%

Lost Too Much Weight Info Percent of long-stay residents who lose too much weight 5.6%
11% worse than Arkansas average

Arkansas average: 5.0%

Depressive Symptoms Info Percent of long-stay residents who have depressive symptoms 0.0%
100% better than Arkansas average

Arkansas average: 1.5%

Antipsychotic Use Info Percent of long-stay residents who received an antipsychotic medication 4.7%
55% better than Arkansas average

Arkansas average: 10.5%

Pneumococcal Vaccine Info Percent of long-stay residents assessed and appropriately given the pneumococcal vaccine 99.7%
6% better than Arkansas average

Arkansas average: 94.4%

Influenza Vaccine Info Percent of long-stay residents assessed and appropriately given the seasonal influenza vaccine 100.0%
In line with Arkansas average

Arkansas average: 96.2%

Short-stay resident measures
Pneumococcal Vaccine Info Percent of short-stay residents assessed and appropriately given the pneumococcal vaccine 94.1%
16% better than Arkansas average

Arkansas average: 80.9%

Antipsychotic medication increase Info Percent of short-stay residents who newly received an antipsychotic medication 1.9%
27% worse than Arkansas average

Arkansas average: 1.5%

Influenza Vaccine Info Percent of short-stay residents assessed and appropriately given the seasonal influenza vaccine 82.3%
6% better than Arkansas average

Arkansas average: 77.7%

Facility Characteristics

Source: CMS Long-Term Care Facility Characteristics (Data as of Jan 2026)

Total residents 84
Medicare
4
4.8% of residents
Medicaid
34
40.5% of residents
Private pay or other
46
54.8% of residents
Programs & Services
Residents Group

Residents meet regularly to discuss policies, care quality, and activities

Family Member Group

Family members meet regularly to discuss policies, care quality, and activities

Active Family Council

Organized group of family members that meets regularly to discuss facility policies, resident care, and activities.

Active Resident Council

Organized group of residents that meets regularly to discuss facility policies, quality of life, and activities.

Places of interest near Magnolia Place Assisted Living & Memory Care

Address 38.5 miles from city center Info Estimated distance in miles from Rogers's city center to Magnolia Place Assisted Living & Memory Care's address, calculated via Google Maps.

Calculate Travel Distance to Magnolia Place Assisted Living & Memory Care

Add your location

Address

Compare Nursing Homes around Holiday Island

The information below is reported by the Arkansas Department of Human Services, Office of Long Term Care.

4 facilities compared · CMS & AR Dept. of Health data

Magnolia Place Assisted Living & Memory Care
NH
AL
MC
Rogers
140
Facility 140
AR AVG 84
Rank #17 / 330
--4.77 -54%+2%$033.0-126A+
36
Facility 36
AR AVG 34
Rank #191 / 419
----45476
Promenade Commons
NH
AL
Rogers
114
Facility 114
AR AVG 84
Rank #86 / 330
93.5% +31%5.00 -10%+7%$0103.3-73-
28
Facility 28
AR AVG 34
Rank #248 / 419
Cameron Roach$9.6M$4.1M42.8%45361
The Blossoms at Rogers Rehab & Nursing Center
NH
MC
NC
PC
RC
Rogers
110
Facility 110
AR AVG 84
Rank #91 / 330
74.5% +4%- -+45%-$0256.3-82-
18
Facility 18
AR AVG 34
Rank #302 / 419
Ronald Yarbrough$9.4M$4.1M43.3%45212
St. Elizabeth‘s Place
NH
MC
RC
Jonesboro
110
Facility 110
AR AVG 84
Rank #91 / 330
80.9% +13%4.35 -74%-7%$21.8k255.0189A+
20
Facility 20
AR AVG 34
Rank #295 / 419
Mark Hahn$10.5M$4.2M39.9%45380

Financial Assistance for
Nursing Home in Arkansas

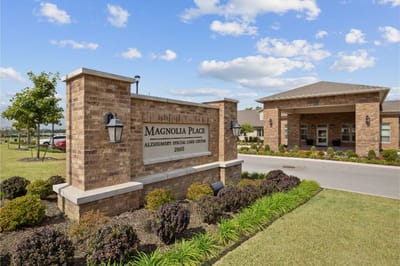
Magnolia Place Assisted Living & Memory Care is located in Rogers, Arkansas.
Here are the financial assistance programs available to residents in Arkansas.

Get Financial aid guidance

ARChoices

Arkansas Medicaid ARChoices

Age 65+ or 21+ with disability
General Arkansas resident, Medicaid- eligible, nursing home-level care need.
Income Limits (2025) ~$2,829/month 300% FBR, individual
Asset Limits $2,000 (individual), $3,000 (couple).
AR

Rural focus; possible waitlists.

Benefits
Personal care (5-7 hours/day) Meals ($7/meal) Respite care (240 hours/year) Adult day services ($60/day)

Choices in Living Resource Center

Arkansas Choices in Living

Age 60+
General Arkansas resident.
Income Limits No strict limit; prioritizes low-income.
Asset Limits Not applicable.
AR

Limited direct funding; mostly referral-based.

Benefits
Care coordination Limited respite (up to 5 days/year) Transportation assistance (~5 trips/month)

Living Choices Assisted Living Waiver

Arkansas Medicaid Living Choices Assisted Living Waiver

Age 65+
General Arkansas resident, requires nursing home-level care, lives in a Level II assisted living facility.
Income Limits (2025) ~$2,829/month 300% FBR, individual
Asset Limits $2,000 (individual), $3,000 (couple); spousal rules apply.
AR

Limited provider network; excludes Level I facilities (no nursing services).

Benefits
Personal care (~5 hours/day) Medication management Nursing Activities Transportation

Program of All-Inclusive Care for the Elderly (PACE)

Arkansas Medicaid PACE

Age 55+
General Arkansas resident, nursing home-level care, safe with PACE support.
Income Limits (2025) ~$2,829/month 300% FBR
Asset Limits $2,000 (individual), $3,000 (couple).
AR

Limited geographic availability.

Benefits
Primary/preventive care Personal care (5-7 hours/day) Meals Transportation Therapy

Arkansas State Plan Personal Care

Arkansas Medicaid Personal Care Program

Age
General Any age, Arkansas resident, needs ADL/IADL help, Medicaid-eligible.
Income Limits (2025) ~$1,004/month individual
Asset Limits $9,660 (individual), $14,470 (couple).
AR

No nursing home-level care requirement.

Benefits
Personal care (~4-6 hours/day) Homemaker services (e.g., meal prep)

Frequently Asked Questions about Magnolia Place Assisted Living & Memory Care

Is Magnolia Place Assisted Living & Memory Care in a walkable area?

Magnolia Place Assisted Living & Memory Care has a walk score of 36. Somewhat walkable. A few nearby services may be reachable on foot, but most trips require transportation.

Are there photos of Magnolia Place Assisted Living & Memory Care?

Yes — there are 5 photos of Magnolia Place Assisted Living & Memory Care in the photo gallery on this page.

What is the address of Magnolia Place Assisted Living & Memory Care?

Magnolia Place Assisted Living & Memory Care is located at 2000 S Hampton Pl, Rogers, AR 72758.

What is the phone number of Magnolia Place Assisted Living & Memory Care?

(479) 326-7255 will put you in contact with the team at Magnolia Place Assisted Living & Memory Care.

Is Magnolia Place Assisted Living & Memory Care Medicare or Medicaid certified?

Yes — Magnolia Place Assisted Living & Memory Care is a CMS-certified provider of Medicare and Medicaid.

Guides for Better Senior Living

Care Cost Calculator: See Prices in Your Area

Nursing Home Data Explorer

Don’t Wait Too Long: 7 Red Flag Signs Your Parent Needs Assisted Living Now

The True Cost of Assisted Living in 2025 – And How Families Are Paying For It

Understanding Senior Living Costs: Pricing Models, Discounts & Financial Assistance