MaineGeneral Rehabilitation & Long Term Care – Gray Birch
Nursing Home & Assisted Living · Augusta, ME
CMS overall rating Info CMS (the Centers for Medicare & Medicaid Services) is the federal agency that rates nursing home quality. Its Overall Rating runs from 1 to 5 stars, combining health inspections, staffing, and quality measures, with inspections weighted most heavily.

MaineGeneral Rehabilitation & Long Term Care – Gray Birch

Nursing Home & Assisted Living · Augusta, ME
CMS overall rating Info CMS (the Centers for Medicare & Medicaid Services) is the federal agency that rates nursing home quality. Its Overall Rating runs from 1 to 5 stars, combining health inspections, staffing, and quality measures, with inspections weighted most heavily.
Calculator: See prices in your area
MaineGeneral Rehabilitation & Long Term Care – Gray Birch accepts Medicare, Medicaid, and private pay.

Overview of Mainegeneral Rehabilitation & Long Term Care – Gray Birch

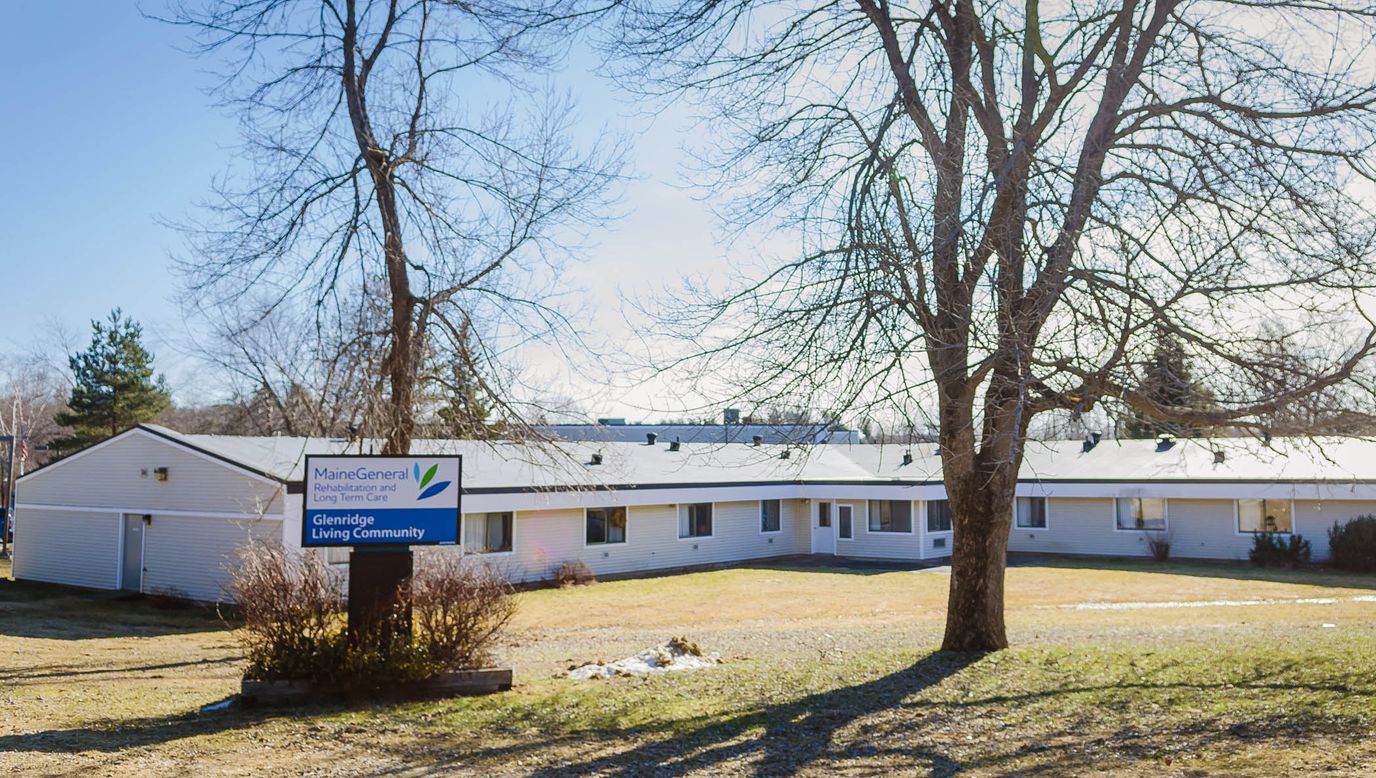
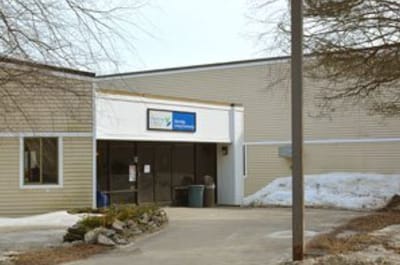
Discover MaineGeneral Rehab & Long Term Care – Gray Birch, situated at the heart of Augusta, Maine, nestled within the embrace of Kennebec County. This assisted living community extends a thoughtful range of therapies and care services, all crafted to empower seniors on their journey towards regaining independence.

With a dedicated team of skilled nurses, licensed care professionals, and committed therapists, MaineGeneral Rehab & Long Term Care is ready to lead residents through personalized therapy designed to cater to their distinct needs. Whether in the midst of recovery after a recent hospital stay or seeking sustained medical support, their compassionate approach is dedicated to aiding senior residents in achieving their personal goals. MaineGeneral Rehab & Long Term Care – Gray Birch is unwavering in its commitment to nurturing a path towards enriched well-being and renewed self-sufficiency.

Quality ratings

Measured by Centers for Medicare & Medicaid Services (CMS)

Overall rating Info The Overall CMS Rating combines results from health inspections, staffing levels and quality measures. Health inspections carry the most weight. Staffing and quality scores can increase or decrease the final rating based on performance compared to state and national standards.
▲ 31.6% Above ME avg. ▲ 31.6% Above ME avg.ME average: 3.0Click the badge to see the full State ranking.Click here to see the full State ranking.
Health Inspection Info Based on the results of the facility's three most recent standard inspections and any complaint investigations. CMS reviews the number, scope, and severity of deficiencies, with more recent findings weighted more heavily.
▲ 40.6% Above ME avg. ▲ 40.6% Above ME avg.ME average: 2.8Click the badge to see the full State ranking.Click here to see the full State ranking.
Staffing Info Measures average nursing staff hours per resident per day, including Registered Nurses (RNs) and total nursing staff. Ratings are adjusted based on the level of care residents require and are compared to state and national benchmarks.
At ME avg. At ME avg.ME average: 4.0Click the badge to see the full State ranking.Click here to see the full State ranking.
Quality Measures Info Based on clinical and physical health indicators reported to CMS, such as hospital readmissions, falls, pressure ulcers, and improvements in mobility. These measures reflect how well residents' health needs are being managed.
▼ 26.7% Below ME avg. ▼ 26.7% Below ME avg.ME average: 2.7Click the badge to see the full State ranking.Click here to see the full State ranking.

Staffing hours breakdown

Info Daily nursing hours per resident by staff type, reported to CMS. Higher is generally better — compare this facility to state and national averages to see where staffing stands.

Hours per resident per day — compared to Maine state averages

Total nursing care / resident Info This home is ranked 3rd out of 34 homes in Maine for nurse hours. Total adjusted nursing hours per resident per day, combining RN, LPN, and aide time. CMS adjusts this for case-mix so facilities can be fairly compared.
5h 34m per day
Rank #3 / 34Nurse hours — State benchmarkedThis home is ranked 3rd out of 34 homes in Maine. Shows adjusted nurse hours per resident per day benchmarked to the Maine average, with a ranking across 34 Maine facilities. More hours mean more direct care. The national average is about 3.5 hrs; below 3.0 is a red flag.Rankings are based only on facilities in Maine that report data for that category. Facilities without available data are excluded from the ranking.Click the rank badge to see the full State ranking.Click here to see the full State ranking.
This facility Maine avg (4h 30m per day)
vs Maine avg
+24%

2 of 6 metrics below state avg

Standout metric Weekend RN is +112% above state avg
Staff type Hours / Day / Resident vs state avg
Registered Nurse (RN) Info RNs hold the highest nursing license and can assess residents, interpret test results, and direct care plans. More RN hours per day often signals stronger clinical oversight and faster response to health changes. 1h 43m per day ▲ 65% State avg: 1h 3m per day · National avg: 41m per day
LPN / LVN Info Licensed Practical Nurses (LPNs) or Licensed Vocational Nurses (LVNs) deliver routine hands-on care — medication administration, wound dressing, and monitoring vital signs. They work under RN supervision and make up a large share of daily bedside care. 26m per day ▼ 8% State avg: 28m per day · National avg: 52m per day
Nurse Aide Info Certified Nurse Aides (CNAs) provide the most direct day-to-day assistance: bathing, dressing, feeding, and mobility. Nurse aide hours are typically the largest staffing category and directly affect residents' quality of life. 2h 48m per day ■ Avg State avg: 2h 49m per day · National avg: 2h 20m per day
Weekend Total Nursing Info Combined nursing hours (RN + LPN + Nurse Aide) per resident per day on weekends. Staffing often drops on weekends — this figure reveals whether the facility maintains adequate coverage outside of weekday hours. 4h 56m per day ▲ 24% State avg: 3h 59m per day · National avg: 3h 27m per day
Physical Therapist Info Hours per resident per day provided by licensed Physical Therapists (PTs) or PT Assistants. PT services help residents recover mobility after injury or illness and are especially important for post-acute (short-stay) rehabilitation. 3m per day ▼ 30% State avg: 4m per day · National avg: 4m per day
Weekend RN Info Registered nurse hours specifically on weekends. Facilities sometimes reduce RN presence on Saturdays and Sundays — a low weekend RN figure compared to weekday hours can indicate reduced clinical oversight when most administrative staff are absent. 1h 35m per day ▲ 112% State avg: 45m per day · National avg: 29m per day

Capacity and availability

This home usually has limited availability

Higher occupancy than the Maine average: 83.1%
Occupancy rate
88.4% Rank #157 / 251Occupancy rate — State benchmarkedThis home is ranked 157th out of 251 homes in Maine. Shows this facility's occupancy rate versus the Maine average, with its Statewide rank out of 251. Higher occupancy signals strong local demand and financial stability.Rankings are based only on facilities in Maine that report data for that category. Facilities without available data are excluded from the ranking.Click the rank badge to see the full State ranking.Click here to see the full State ranking.
Avg. Length of Stay
122 days
Bed community size
77-bed community Rank #27 / 357Bed count — State benchmarkedThis home is ranked 27th out of 357 homes in Maine. Shows this facility's certified or reported bed count compared to other Maine facilities. Larger communities may offer more amenities, programs, and on-site services for residents and families.Rankings are based only on facilities in Maine that report data for that category. Facilities without available data are excluded from the ranking.Click the rank badge to see the full State ranking.Click here to see the full State ranking.
A larger shared setting that may offer more common spaces and organized community services.
Walk Score
Walk Score: 28 / 100 Rank #195 / 422Walk Score — State benchmarkedThis home is ranked 195th out of 422 homes in Maine. Shows how walkable this facility's neighborhood is compared to the average Walk Score across Maine facilities. Higher scores benefit residents, families, and staff.Rankings are based only on facilities in Maine that report data for that category. Facilities without available data are excluded from the ranking.Click the rank badge to see the full State ranking.Click here to see the full State ranking.
Somewhat walkable. A few nearby services may be reachable on foot, but most trips require transportation.

Contact MaineGeneral Rehabilitation & Long Term Care – Gray Birch

Staffing Data

Reporting period: October 1 – December 31, 2025 (Q4 2025). Source: CMS Payroll-Based Journal report.

Total staff 110
Employees 109
Contractors 1
Staff to resident ratio 1.69 : 1
17% fewer staff per resident than Maine average
Maine average ratio: 2.03 : 1 Maine average ratio: 2.03 : 1See full Maine ranking
Avg staff/day 53
Average shift 8.5 hours
5% better than Maine average
Maine average: 8.1 hours Maine average shift: 8.1 hoursSee full Maine ranking
Total staff hours (quarter) 41,538

Nursing staff breakdown

Q4 2025 · Oct 1 – Dec 31 More info This data comes from the CMS Payroll-Based Journal report covering October 1 – December 31, 2025.
Registered Nurse

Manages medical care and health needs.

RN Staff Info All 22 RN Staff are full-time employees. No contractors work on this role. 22
Average shift length Info Average shift length. Calculated as total hours divided by days worked and average staff per day. 9.4 hours
Licensed Practical Nurse

Assists with medical care and medications.

LPN Staff Info All 6 LPN Staff are full-time employees. No contractors work on this role. 6
Average shift length Info Average shift length. Calculated as total hours divided by days worked and average staff per day. 9.3 hours
Certified Nursing Assistant

Helps with daily care and mobility.

CNA Staff Info All 42 CNA Staff are full-time employees. No contractors work on this role. 42
Average shift length Info Average shift length. Calculated as total hours divided by days worked and average staff per day. 9.1 hours

Contractor staffing

Q4 2025 · Oct 1 – Dec 31 More info This data comes from the CMS Payroll-Based Journal report covering October 1 – December 31, 2025.

Total hours from contractors

0.1%

48 contractor hours this quarter

Occupational Therapy Assistant: 1

Staff by category

Q4 2025 · Oct 1 – Dec 31 More info This data comes from the CMS Payroll-Based Journal report covering October 1 – December 31, 2025.
Certified Nursing Assistant 42 0 42 15,192 92 100% 9.1
Registered Nurse 22 0 22 6,291 92 100% 9.4
Clinical Nurse Specialist 6 0 6 3,434 90 98% 7.7
Other Physician 4 0 4 2,832 92 100% 8
Licensed Practical Nurse 6 0 6 2,207 91 99% 9.3
Medication Aide/Technician 5 0 5 1,668 90 98% 8.4
Speech Language Pathologist 5 0 5 1,538 86 93% 7.5
Physical Therapy Assistant 3 0 3 1,462 90 98% 8.5
Physical Therapy Aide 4 0 4 1,162 63 68% 7.7
Medical Director 1 0 1 704 88 96% 8
Physician Assistant 1 0 1 704 88 96% 8
Occupational Therapy Aide 2 0 2 694 74 80% 7.2
Administrator 1 0 1 670 85 92% 7.9
Nurse Practitioner 1 0 1 639 81 88% 7.9
Other Dietary Services Staff 1 0 1 510 65 71% 7.8
Dietitian 1 0 1 498 63 68% 7.9
RN Director of Nursing 1 0 1 435 56 61% 7.8
Mental Health Service Worker 1 0 1 405 53 58% 7.6
Respiratory Therapy Technician 1 0 1 290 45 49% 6.4
Qualified Social Worker 1 0 1 156 48 52% 3.3
Occupational Therapy Assistant 0 1 1 48 6 7% 8
42 Certified Nursing Assistant
% of Days 100%
22 Registered Nurse
% of Days 100%
6 Clinical Nurse Specialist
% of Days 98%
4 Other Physician
% of Days 100%
6 Licensed Practical Nurse
% of Days 99%
5 Medication Aide/Technician
% of Days 98%
5 Speech Language Pathologist
% of Days 93%
3 Physical Therapy Assistant
% of Days 98%
4 Physical Therapy Aide
% of Days 68%
1 Medical Director
% of Days 96%
1 Physician Assistant
% of Days 96%
2 Occupational Therapy Aide
% of Days 80%
1 Administrator
% of Days 92%
1 Nurse Practitioner
% of Days 88%
1 Other Dietary Services Staff
% of Days 71%
1 Dietitian
% of Days 68%
1 RN Director of Nursing
% of Days 61%
1 Mental Health Service Worker
% of Days 58%
1 Respiratory Therapy Technician
% of Days 49%
1 Qualified Social Worker
% of Days 52%
1 Occupational Therapy Assistant
% of Days 7%

Penalties and fines

Federal penalties imposed by CMS for regulatory violations, including civil money penalties (fines) and denials of payment for new Medicare/Medicaid admissions.

Source: CMS Penalties Database (Data as of Jan 2026)

Total fines amount $10K Rank #22 / 34Federal fines — State benchmarkedThis home is ranked 22nd out of 34 homes in Maine. Shows this facility's cumulative CMS federal fine dollars versus the Maine average among facilities with fines, and where it ranks among 34 facilities in the pool. Lower total dollars mean a better rank.Rankings are based only on facilities in Maine that report data for that category. Facilities without available data are excluded from the ranking.Click the rank badge to see the full State ranking.Click here to see the full State ranking.
60% lower than Maine average

Maine average: $24K

Number of fines 1
18% fewer fines than Maine average

Maine average: 1.2

Payment Denials Info Serious action where Medicare and/or Medicaid temporarily stops payments for new residents until issues are fixed. 0
100% fewer payment denials than Maine average

Maine average: 0.2

Fines amount comparison
This facility $10K
Maine average $24K

No penalties in the past 3 years

No civil money penalties or payment denials were reported in the last 3 years.

Quality of care over time

These measures show how residents usually do over time at this home, based on health outcomes and preventive care.

High-risk clinical events score Info A composite score based on pressure ulcers, falls with injury, weight loss, walking ability decline, and activities of daily living decline. 11.4
20% better than Maine average

Maine average: 14.2

Functional decline score Info A composite score based on activities of daily living decline, walking ability decline, and incontinence. 18.7
36% better than Maine average

Maine average: 29.1

Long-stay resident measures
Need for Help with Daily Activities Increased Info Percent of long-stay residents whose need for help with daily activities has increased 23.4%
10% better than Maine average

Maine average: 26.0%

Walking Ability Worsened Info Percent of long-stay residents whose ability to move independently worsened 16.8%
47% better than Maine average

Maine average: 31.4%

Low Risk Residents with Bowel/Bladder Incontinence Info Percent of low risk long-stay residents who lose control of their bowels or bladder 15.8%
47% better than Maine average

Maine average: 29.8%

Falls with Major Injury Info Percent of long-stay residents experiencing one or more falls with major injury 3.1%
29% better than Maine average

Maine average: 4.4%

High Risk Residents with Pressure Ulcers Info Percent of long-stay high risk residents with pressure ulcers 9.3%
107% worse than Maine average

Maine average: 4.5%

Urinary Tract Infection Info Percent of long-stay residents with a urinary tract infection 3.6%
31% worse than Maine average

Maine average: 2.8%

Lost Too Much Weight Info Percent of long-stay residents who lose too much weight 4.5%
19% better than Maine average

Maine average: 5.5%

Depressive Symptoms Info Percent of long-stay residents who have depressive symptoms 8.9%
15% better than Maine average

Maine average: 10.5%

Antipsychotic Use Info Percent of long-stay residents who received an antipsychotic medication 18.1%
9% better than Maine average

Maine average: 19.8%

Pneumococcal Vaccine Info Percent of long-stay residents assessed and appropriately given the pneumococcal vaccine 97.8%
9% better than Maine average

Maine average: 90.1%

Influenza Vaccine Info Percent of long-stay residents assessed and appropriately given the seasonal influenza vaccine 100.0%
5% better than Maine average

Maine average: 95.5%

Short-stay resident measures
Pneumococcal Vaccine Info Percent of short-stay residents assessed and appropriately given the pneumococcal vaccine 89.6%
26% better than Maine average

Maine average: 70.8%

Antipsychotic medication increase Info Percent of short-stay residents who newly received an antipsychotic medication 1.2%
15% better than Maine average

Maine average: 1.4%

Influenza Vaccine Info Percent of short-stay residents assessed and appropriately given the seasonal influenza vaccine 88.7%
19% better than Maine average

Maine average: 74.5%

Breakdown by payment type

Medicare

16% of new residents, usually for short-term rehab.

Typical stay 1 - 2 months

Private pay

77% of new residents, often for short stays.

Typical stay 3 - 4 months

Medicaid

8% of new residents, often for long-term daily care.

Typical stay 3 years

Facility Characteristics

Source: CMS Long-Term Care Facility Characteristics (Data as of Jan 2026)

Total residents 65
Medicare
3
4.6% of residents
Medicaid
48
73.8% of residents
Private pay or other
14
21.5% of residents
Programs & Services
Residents Group

Residents meet regularly to discuss policies, care quality, and activities

Nurse Aide Training

State-approved Nurse Aide Training and Competency Evaluation Program on-site

Active Resident Council

Organized group of residents that meets regularly to discuss facility policies, quality of life, and activities.

Finances and operations

Based on CMS SNF Cost Report for fiscal year ending in 06/2024.

Nonprofit
Nonprofit Corporation
Net patient revenue Info Net patient revenue — what the home actually collects for resident care, after contractual allowances, bad debt and discounts are subtracted from its gross charges (CMS cost report, Worksheet G-3). It covers resident care only; money the home earns from other sources is shown separately as "Other income."
$10.6M
Net patient income Info Net patient income: net patient revenue minus the home's total operating expenses. A positive figure means it earns more from resident care than it spends to deliver it; a negative figure means the opposite. It excludes non-operating "other income."
-$5.3M
Nonprofit Nonprofit Corporation
Net patient revenue Info Net patient revenue — what the home actually collects for resident care, after contractual allowances, bad debt and discounts are subtracted from its gross charges (CMS cost report, Worksheet G-3). It covers resident care only; money the home earns from other sources is shown separately as "Other income."
$10.6M Rank #19 / 40Revenue — State benchmarkedThis home is ranked 19th out of 40 homes in Maine. Shows this facility's annual revenue compared to the Maine average. Higher revenue generally means more resources for staffing and capital — read alongside Payroll %.Rankings are based only on facilities in Maine that report data for that category. Facilities without available data are excluded from the ranking.Click the rank badge to see the full State ranking.Click here to see the full State ranking.
Net patient income Info Net patient income: net patient revenue minus the home's total operating expenses. A positive figure means it earns more from resident care than it spends to deliver it; a negative figure means the opposite. It excludes non-operating "other income."
-$5.3M
Other income Info Money the home earns outside of resident care — such as investments, grants, rentals and other non-operating sources (CMS cost report, Worksheet G-3). It is tracked separately from net patient revenue: it is not part of that figure, and it is not included in net patient income.
$39.7K
Payroll costs Info Staff salaries plus wage-related costs — benefits such as payroll taxes, health insurance and retirement — from the home's own accounting records (CMS cost report, Worksheet A). Contract or agency labor is counted separately, under other operating costs. Rank #15 / 40Payroll — State benchmarkedThis home is ranked 15th out of 40 homes in Maine. Shows total annual staff payroll benchmarked to the Maine average. Higher payroll investment relative to peers often signals better staffing and less reliance on cheaper contract labor.Rankings are based only on facilities in Maine that report data for that category. Facilities without available data are excluded from the ranking.Click the rank badge to see the full State ranking.Click here to see the full State ranking.
$8.8M 83.1% of net patient revenue Info Payroll as a share of revenue: staff salaries and wage-related benefits divided by net patient revenue. A higher figure means more of each revenue dollar goes to staff pay. Rank #5 / 40Payroll % — State benchmarkedThis home is ranked 5th out of 40 homes in Maine. Shows payroll as a percentage of revenue versus the Maine average. Well-run Maine facilities typically land around 60–66% — the top third Statewide. Below 25% may signal understaffing or heavy agency use — read with Staffing ratings.Rankings are based only on facilities in Maine that report data for that category. Facilities without available data are excluded from the ranking.Click the rank badge to see the full State ranking.Click here to see the full State ranking.
Other operating costs Info Everything it costs to run the home apart from payroll — food, utilities, supplies, maintenance, contract labor and administration. Calculated as total operating expense minus payroll (staff salaries and wage-related benefits).
$7.1M
Total costs Info The home's total operating expense for the year — all the costs of running it, salaries included (CMS cost report, Worksheet G-3).
$16.0M

What does this home offer?

Pets allowed icon
Pets allowed icon

Pets Allowed

Building type icon
Building type icon

Building Type: Single-story

Transportation services icon

Transportation Services

Fitness and recreation icon

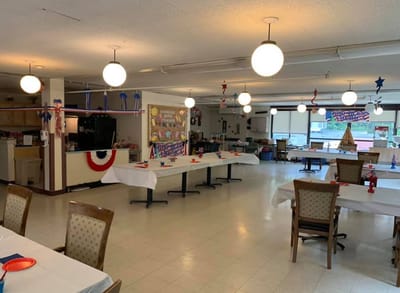
Fitness and Recreation

Who this home usually serves

TYPE OF STAY

Primarily short stays

Residents typically stay for brief periods, with frequent admissions and discharges throughout the year.

Most new residents arrive under private pay (77% of admissions), and a typical private pay stay runs around 3 - 4 months.

Admissions
213 total

Coverage residents most often arrive under.

Medicare 16%
Private pay 77%
Medicaid 8%
Discharges
222 total

Coverage residents most often leave under.

Medicare 17%
Private pay 77%
Medicaid 6%

Places of interest near MaineGeneral Rehabilitation & Long Term Care – Gray Birch

Address 37 Gray Birch Dr, Augusta, ME 04330

Calculate Travel Distance to MaineGeneral Rehabilitation & Long Term Care – Gray Birch

Add your location

Address

Compare Nursing Homes around Augusta

The information below is reported by the Maine Department of Health and Human Services, Division of Licensing and Certification.

4 facilities compared · CMS & ME Dept. of Health data

Maine Veterans‘ Homes Augusta
NH
AL
MC
RC
Augusta
108
Facility 108
ME AVG 20
Rank #10 / 357
93.1%
Facility 93.1%
ME AVG 83.1%
Rank #134 / 251
+12%
7.43
Facility 7.43
ME AVG 4.50
Rank #1 / 34
+2% +65%
$0
Facility $0
ME AVG $26.4k
Rank #1 / 34
6
Facility 6
ME AVG 28.5
Rank #1 / 34
3.0
Facility 3.0
ME AVG 5.9
Rank #1 / 34
- 102 -
7
Facility 7
ME AVG 31
Rank #316 / 422
Maine Veterans' Home
$86.7M
Facility $86.7M
ME AVG $16.9M
Rank #1 / 40
$16.6M
Facility $16.6M
ME AVG $4.7M
Rank #1 / 40
19.2%
Facility 19.2%
ME AVG 37.8%
Rank #39 / 40
205126
MaineGeneral Rehabilitation & Long Term Care – Gray Birch
NH
AL
Augusta (Gray Birch Drive)
77
Facility 77
ME AVG 20
Rank #27 / 357
88.4%
Facility 88.4%
ME AVG 83.1%
Rank #157 / 251
+6%
5.57
Facility 5.57
ME AVG 4.50
Rank #3 / 34
+34% +24%
$9.8k
Facility $9.8k
ME AVG $26.4k
Rank #22 / 34
21
Facility 21
ME AVG 28.5
Rank #7 / 34
7.0
Facility 7.0
ME AVG 5.9
Rank #24 / 34
1 66 -
28
Facility 28
ME AVG 31
Rank #195 / 422
Mainegeneral Health
$10.6M
Facility $10.6M
ME AVG $16.9M
Rank #19 / 40
$8.8M
Facility $8.8M
ME AVG $4.7M
Rank #15 / 40
83.1%
Facility 83.1%
ME AVG 37.8%
Rank #5 / 40
205054
Augusta Center for Health & Rehabilitation
NH
HC
NC
PC
RC
Augusta (Mayfair)
72
Facility 72
ME AVG 20
Rank #33 / 357
95.1%
Facility 95.1%
ME AVG 83.1%
Rank #125 / 251
+14%
3.64
Facility 3.64
ME AVG 4.50
Rank #25 / 34
+9% -19%
$10.1k
Facility $10.1k
ME AVG $26.4k
Rank #24 / 34
26
Facility 26
ME AVG 28.5
Rank #11 / 34
4.3
Facility 4.3
ME AVG 5.9
Rank #8 / 34
1 67 -
23
Facility 23
ME AVG 31
Rank #208 / 422
Ryan Francis
$9.4M
Facility $9.4M
ME AVG $16.9M
Rank #30 / 40
$4.7M
Facility $4.7M
ME AVG $4.7M
Rank #26 / 40
49.8%
Facility 49.8%
ME AVG 37.8%
Rank #12 / 40
205077
Oak Grove Center
NH
HC
MC
RC
Waterville (Cool Street)
90
Facility 90
ME AVG 20
Rank #15 / 357
58.8%
Facility 58.8%
ME AVG 83.1%
Rank #227 / 251
-29%
3.09
Facility 3.09
ME AVG 4.50
Rank #33 / 34
-8% -31%
$14.1k
Facility $14.1k
ME AVG $26.4k
Rank #29 / 34
63
Facility 63
ME AVG 28.5
Rank #34 / 34
9.0
Facility 9.0
ME AVG 5.9
Rank #28 / 34
1 85 -
41
Facility 41
ME AVG 31
Rank #146 / 422
Laura Matones
$10.8M
Facility $10.8M
ME AVG $16.9M
Rank #14 / 40
$5.0M
Facility $5.0M
ME AVG $4.7M
Rank #21 / 40
46%
Facility 46%
ME AVG 37.8%
Rank #32 / 40
205091

Financial Assistance for
Nursing Home in Maine

MaineGeneral Rehabilitation & Long Term Care – Gray Birch is located in Augusta, Maine.
Here are the financial assistance programs available to residents in Maine.

Get Financial aid guidance

Home and Community Benefits for the Elderly

MaineCare HCB Program

Age 65+ or 18+ with disability
General Maine resident, Medicaid- eligible, nursing home-level care need.
Income Limits (2025) ~$2,829/month 300% FBR, individual
Asset Limits $2,000 (individual), $3,000 (couple).
ME

Rural access emphasized.

Benefits
Personal care (5-7 hours/day) Respite (240 hours/year) Meals ($6/meal) Adult day services ($60/day)

Maine Statewide Respite Program

ME Respite Program

Age
General Caregiver of someone 60+ with dementia, Maine resident.
Income Limits ~$2,500/month individual, varies
Asset Limits $40,000 individual
ME

Limited to dementia caregivers; capped funding.

Benefits
In-home respite (up to 30 days/year) Adult day care (~$60/day)

MaineCare Long-Term Care (Nursing Facility Services)

MaineCare Nursing Facility Services

Age 65+
General Maine resident, Medicaid-eligible, requires nursing home-level care.
Income Limits (2025) $943/month (individual); must be less than nursing home cost for full coverage.
Asset Limits $2,000 (individual), $3,000 (couple); spousal allowance up to $155,356.
ME

Home equity limit of $636,000; estate recovery applies post-55.

Benefits
24/7 nursing care Meals Therapy Medications (hours unlimited per medical need)

Consumer-Directed Home-Based Care (CDHBC)

Maine Consumer-Directed Personal Assistance Services

Age 65+
General Maine resident, needs ADL assistance, income/asset limits apply.
Income Limits (2025) ~$2,000/month varies by AAA
Asset Limits Not strict; prioritizes low-income.
ME

Available through five Area Agencies on Aging.

Benefits
Personal care (20-30 hours/week) PERS Adult day care Home modifications

Home Accessibility and Repair Program

Maine State Housing Authority Home Accessibility and Repair

Age 62+
General Maine resident, homeowner, low-income.
Income Limits (2025) ~$34,000/year individual, 80% AMI, varies by county
Asset Limits Not specified; focus on income.
ME

Includes Elderly Hardship Grants for urgent repairs.

Benefits
Wheelchair ramps Grab bars Roof repairs (up to $20,000/project)

Program of All-Inclusive Care for the Elderly (PACE)

Maine PACE (not widely available yet)

Age 55+
General Maine resident, Medicare/Medicaid-eligible, nursing home-level care need, community-safe.
Income Limits (2025) No strict limit; Medicaid portion $2,901/month max.
Asset Limits $2,000 (individual) for Medicaid portion.
ME

Pilot phase; check availability with DHHS.

Benefits
Medical care Personal care Day center Transportation Respite (tailored to need)

Veterans Aid and Attendance (A&A) Benefit

Maine VA Aid and Attendance

Age
General Wartime veteran/spouse, age 65+ or disabled, needs ADL help, Maine resident.
Income Limits (2025) Net income minus medical expenses < $1,984/month individual with A&A
Asset Limits $155,356 net worth limit
ME

High veteran population in rural areas.

Benefits
Cash benefit ($1,478-$2,471/month, varies by status) for care costs

Medicare Savings Programs (MSP)

Maine Medicare Savings Programs

Age 65+
General Maine resident, Medicare Part A/B enrollee.
Income Limits (2025) $2,014/month (individual, QMB), $2,706/month (SLMB/QI).
Asset Limits $9,090 (individual), $13,630 (couple).
ME

Includes Qualified Medicare Beneficiary (QMB), Specified Low-Income Medicare Beneficiary (SLMB), and Qualified Individual (QI).

Benefits
Covers Medicare premiums (up to $174.70/month Part B) Co-pays Deductibles

Frequently Asked Questions about MaineGeneral Rehabilitation & Long Term Care – Gray Birch

What neighborhood is MaineGeneral Rehabilitation & Long Term Care – Gray Birch in?

MaineGeneral Rehabilitation & Long Term Care – Gray Birch is in the Gray Birch Drive neighborhood.

Is MaineGeneral Rehabilitation & Long Term Care – Gray Birch in a walkable area?

MaineGeneral Rehabilitation & Long Term Care – Gray Birch has a walk score of 28. Somewhat walkable. A few nearby services may be reachable on foot, but most trips require transportation.

What is the occupancy rate at MaineGeneral Rehabilitation & Long Term Care – Gray Birch?

MaineGeneral Rehabilitation & Long Term Care – Gray Birch's occupancy is 88.4%.

Does MaineGeneral Rehabilitation & Long Term Care – Gray Birch operate as a for-profit or non-profit?

MaineGeneral Rehabilitation & Long Term Care – Gray Birch is registered as a non-profit.

Are there photos of MaineGeneral Rehabilitation & Long Term Care – Gray Birch?

Yes — there are 4 photos of MaineGeneral Rehabilitation & Long Term Care – Gray Birch in the photo gallery on this page.

What is the address of MaineGeneral Rehabilitation & Long Term Care – Gray Birch?

MaineGeneral Rehabilitation & Long Term Care – Gray Birch is located at 37 Gray Birch Dr, Augusta, ME 04330.

What is the phone number of MaineGeneral Rehabilitation & Long Term Care – Gray Birch?

(207) 621-7100 will put you in contact with the team at MaineGeneral Rehabilitation & Long Term Care – Gray Birch.

Guides for Better Senior Living

Care Cost Calculator: See Prices in Your Area

Nursing Home Data Explorer

Don’t Wait Too Long: 7 Red Flag Signs Your Parent Needs Assisted Living Now

The True Cost of Assisted Living in 2025 – And How Families Are Paying For It

Understanding Senior Living Costs: Pricing Models, Discounts & Financial Assistance