

Occupancy rate
50%
Indiana average: 69%

We arrange tours, appointments, and even moving support so you don’t have to
Located in Bloomington, Indiana, Majestic Care provides person-centered care, not just alleviating needs but also ensuring genuine contentment. Operating across various locations nationwide, Majestic Care boasts a highly qualified care team, comprising licensed and compassionate professionals renowned for their top-notch clinical expertise.
Majestic Care’s comprehensive services cover a spectrum of specialized care, including short-term rehabilitation, physical, occupational, and speech therapies, outpatient therapy, memory care, long-term care, hospice care, and respite care. Their offerings extend to behavioral health services, and they even provide options for assisted living and independent living, catering to the unique needs of families and seniors. Remarkably, Majestic Care goes the extra mile, offering specialized services like dialysis care, ventilator care, and pediatric care, ensuring a holistic approach to healthcare.
 Official CMS rating based on health inspections, staffing and quality measures.
Official CMS rating based on deficiencies found during state health inspections.
Official CMS rating based on nurse staffing hours per resident per day.
Official CMS rating based on clinical outcomes for residents.
Average daily nursing hours per resident (adjusted for acuity). Higher values indicate more nursing time per resident.
Hours of care per resident per day, broken down by staff type. Data from CMS Medicare.
Registered nurse hours per resident per day.
Official CMS rating based on health inspections, staffing and quality measures.
Official CMS rating based on deficiencies found during state health inspections.
Official CMS rating based on nurse staffing hours per resident per day.
Official CMS rating based on clinical outcomes for residents.
Average daily nursing hours per resident (adjusted for acuity). Higher values indicate more nursing time per resident.
Hours of care per resident per day, broken down by staff type. Data from CMS Medicare.
Registered nurse hours per resident per day.
May provide extensive amenities, services and programs.
Lower occupancy suggests more openings may be available.
Most residents stay for extended periods and receive ongoing daily care.
23% of new residents, usually for short-term rehab.
50% of new residents, often for short stays.
28% of new residents, often for long-term daily care.
The portion of the home's budget spent on staff, including nurses, caregivers, and other employees who support care and operations.
All remaining costs needed to run the home, such as food, utilities, building maintenance, supplies and administrative expenses.
Indiana average: 69%
Majestic Care of Bloomington is legally operated by COLUMBUS REGIONAL HOSPITAL, and administrated by WARREN MCCREERY.
Key information about the people who lead and staff this community.
In Indiana, the Department of Health, Division of Long Term Care is the primary regulatory body that performs onsite inspections and quality of care reviews for all licensed facilities.
24 visits/inspections triggered by complaints
2 with citations
8 without citations
Indiana average: 8 complaint visits
Indiana average: 3 inspections with citations
Formal expressions of dissatisfaction or concern made by residents, or their families regarding various aspects of the care, services, and environment provided.
Indiana average: 4 complaints
Citations indicate regulatory violations. A higher number implies the facility had several areas requiring improvement.
Indiana average: 26 citations
Deficiencies indicate regulatory issues. A higher number implies the facility had several areas requiring improvement.
The most recent inspection on June 30, 2025, found no deficiencies related to the complaint investigated. Earlier inspections showed a mix of compliance and some deficiencies, primarily involving documentation accuracy, Life Safety Code issues such as sprinkler system maintenance, and occasional resident care concerns like following physician orders. Complaint investigations were mostly unsubstantiated, with one substantiated case in January 2025 related to incomplete wound care documentation. No fines, immediate jeopardy findings, or enforcement actions were listed in the available reports. The facility’s record shows some improvement in Life Safety Code compliance and resident care documentation since early 2025, following prior citations.
Indiana average 6
Last Health inspection on Jan 2025
Health citations are formal notices following inspections when they fail to comply with safety and care standards.
5 of 6 citations resulted from standard inspections; and 1 of 6 resulted from complaint investigations.
Indiana average: 0.2
Indiana average: 0.6
Data sourced from CMS Health Deficiencies reports. Citation severity codes range from A (least serious) to L (most serious). Immediate Jeopardy (J-L) citations indicate situations where the facility's noncompliance has placed residents at risk of death or serious harm.
Assisted Living For seniors needing help with daily tasks but not full-time nursing.
Memory Care Specialized care for those with Memory Loss, Alzheimer's, or dementia, ensuring safety and support.
Nursing Homes 24/7 care needed
Hospice Care
Memory Care Specialized care for those with Memory Loss, Alzheimer's, or dementia, ensuring safety and support.
Nursing Homes 24/7 care needed
Respite Care
Memory Care Specialized care for those with Memory Loss, Alzheimer's, or dementia, ensuring safety and support.
Nursing Homes 24/7 care needed
Hospice Care
Nursing Homes 24/7 care needed
Respite Care
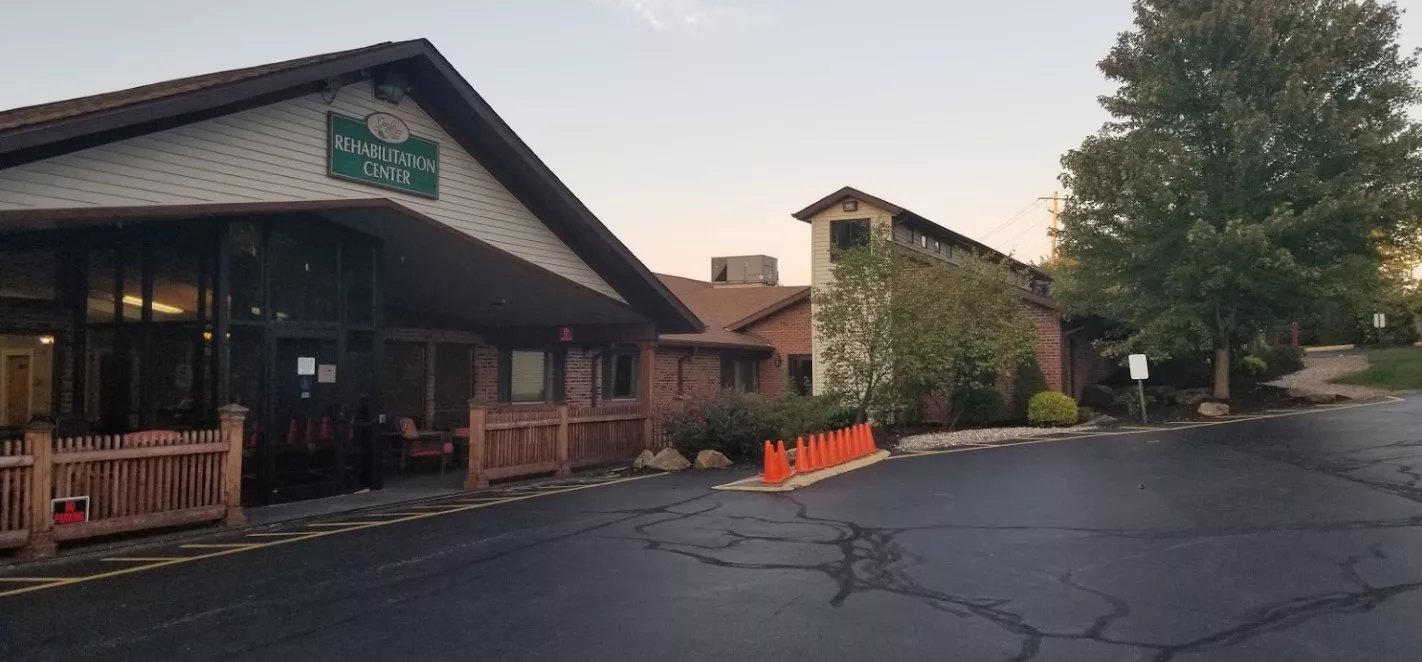
 Stonecroft Health Campus
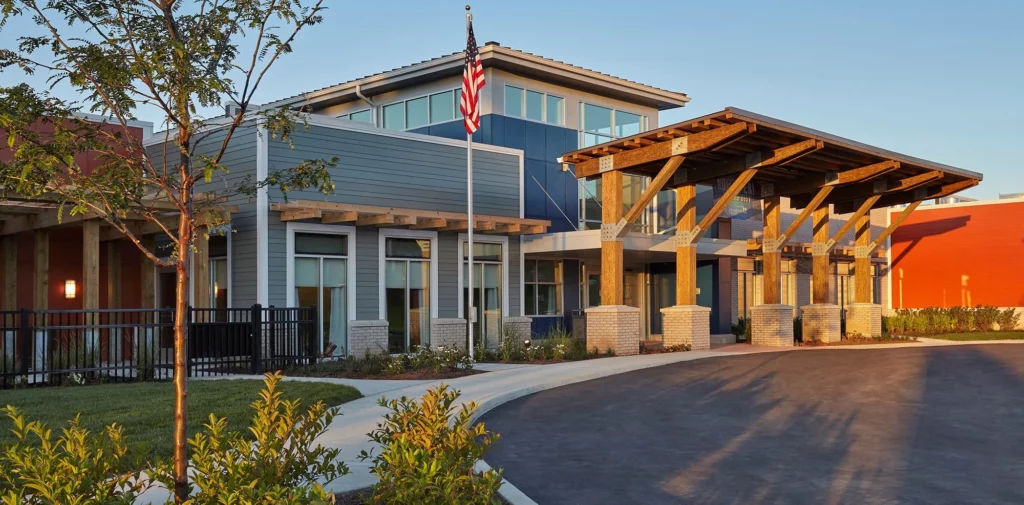
  Majestic Care of Bloomington
 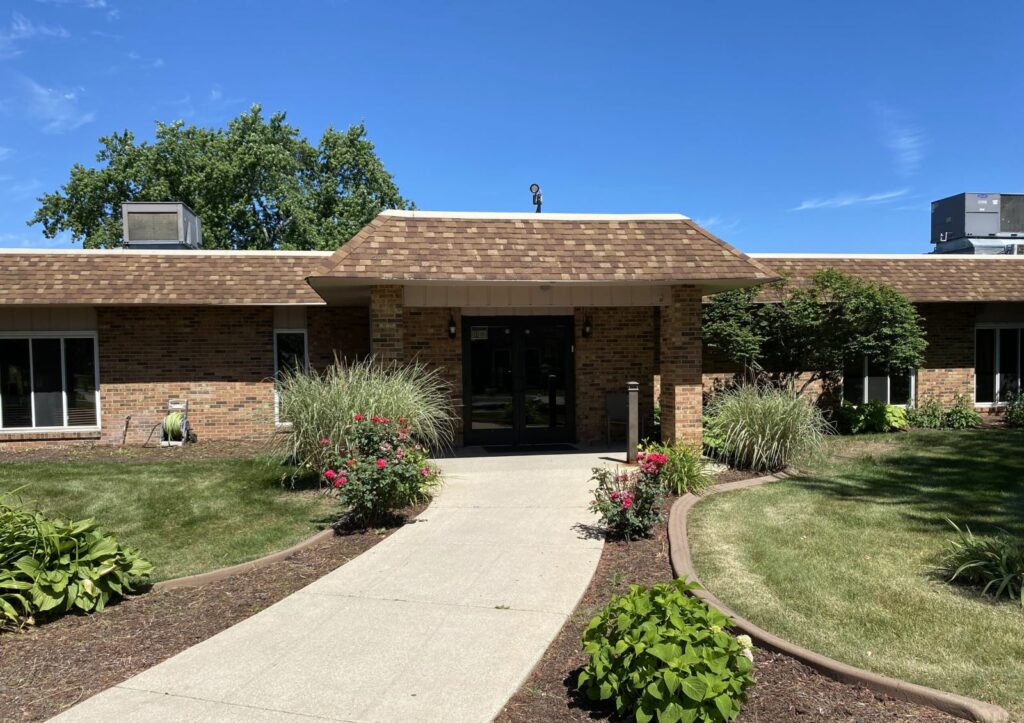 Brickyard Healthcare – Bloomington Care Center
 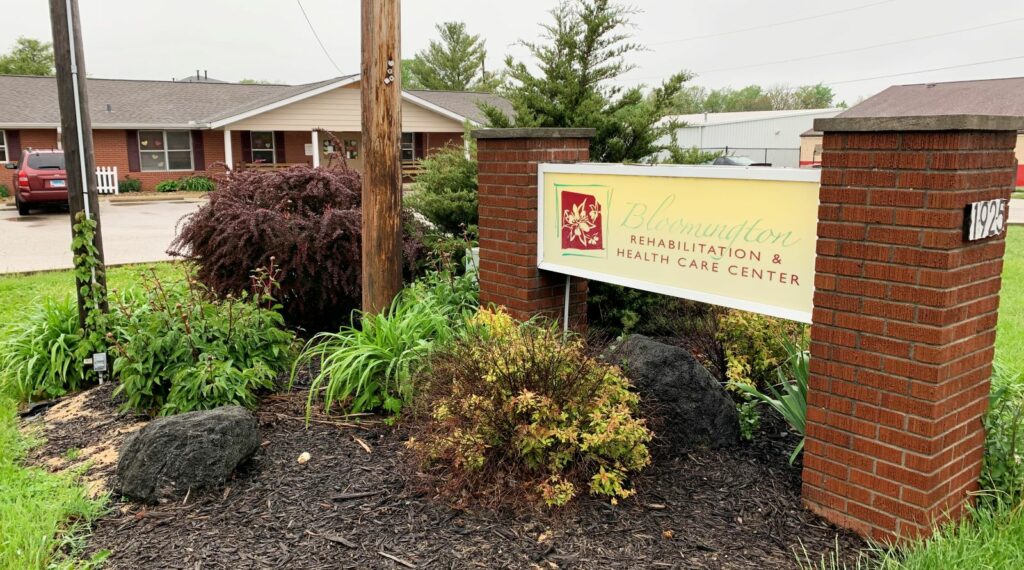 Bloomington Nursing & Rehabilitation Center
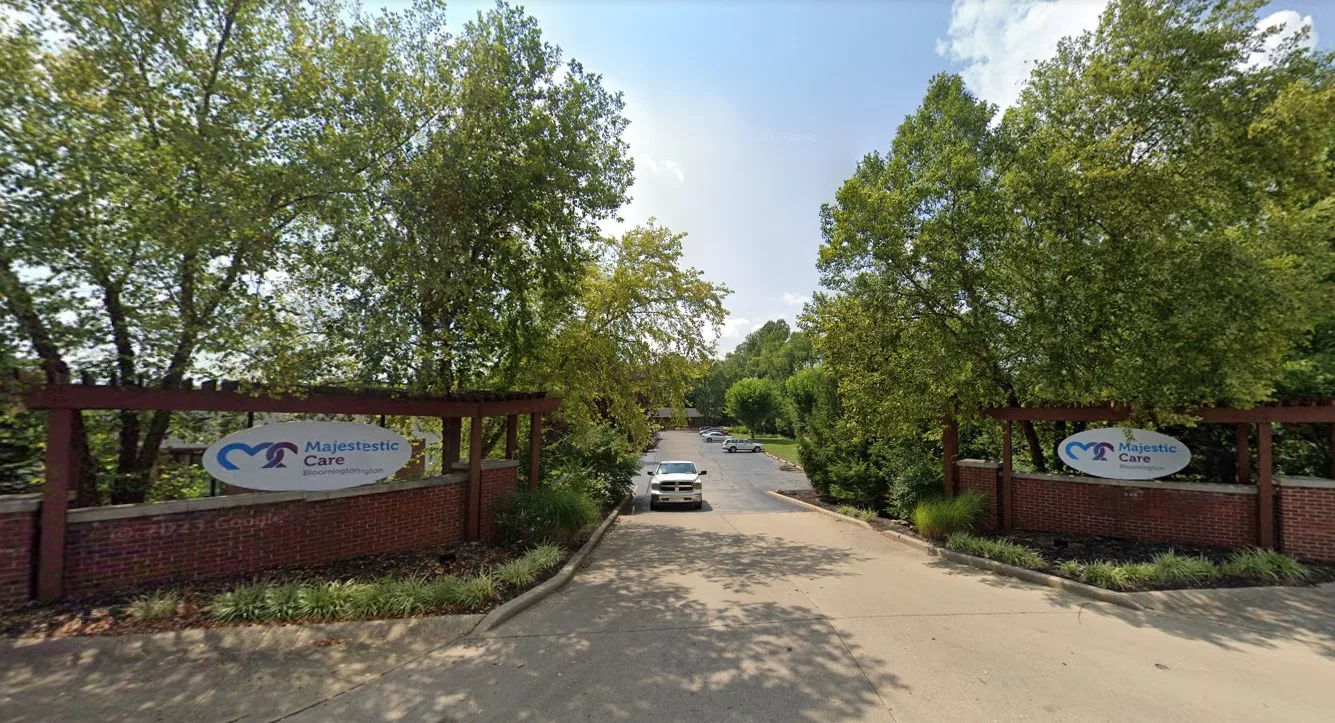
![]() 3.9 miles from city center — 1.64 miles to nearest hospital (Indiana Spine Group)
3.9 miles from city center — 1.64 miles to nearest hospital (Indiana Spine Group)
![]() 1100 S Curry Pike, Bloomington, IN 47403
1100 S Curry Pike, Bloomington, IN 47403
Add your location
Source: CMS Payroll-Based Journal (Q2 2025)
| Role ⓘ | Count ⓘ | Avg Shift (hrs) ⓘ | Uses Contractors? ⓘ |
|---|---|---|---|
| Registered Nurse | 9 | 9.9 | No |
| Licensed Practical Nurse | 17 | 10 | No |
| Certified Nursing Assistant | 48 | 9.4 | No |
| Role ⓘ | Employees ⓘ | Contractors ⓘ | Total Staff ⓘ | Total Hours ⓘ | Days Worked ⓘ | % of Days ⓘ | Avg Shift (hrs) ⓘ |
|---|---|---|---|---|---|---|---|
| Certified Nursing Assistant | 48 | 0 | 48 | 17,391 | 91 | 100% | 9.4 |
| Licensed Practical Nurse | 17 | 0 | 17 | 5,726 | 91 | 100% | 10 |
| Registered Nurse | 9 | 0 | 9 | 2,672 | 91 | 100% | 9.9 |
| Medication Aide/Technician | 7 | 0 | 7 | 2,644 | 89 | 98% | 9.9 |
| Other Dietary Services Staff | 7 | 0 | 7 | 2,577 | 91 | 100% | 7.5 |
| RN Director of Nursing | 4 | 0 | 4 | 2,081 | 78 | 86% | 8.3 |
| Clinical Nurse Specialist | 5 | 0 | 5 | 1,470 | 69 | 76% | 8 |
| Physical Therapy Assistant | 0 | 1 | 1 | 578 | 75 | 82% | 7.7 |
| Speech Language Pathologist | 0 | 4 | 4 | 541 | 67 | 74% | 7.2 |
| Mental Health Service Worker | 2 | 1 | 3 | 527 | 62 | 68% | 7.7 |
| Administrator | 1 | 0 | 1 | 512 | 64 | 70% | 8 |
| Nurse Practitioner | 1 | 0 | 1 | 512 | 64 | 70% | 8 |
| Dietitian | 1 | 0 | 1 | 446 | 59 | 65% | 7.6 |
| Feeding Assistant | 0 | 4 | 4 | 342 | 59 | 65% | 3.6 |
| Qualified Social Worker | 0 | 2 | 2 | 334 | 50 | 55% | 6.2 |
| Respiratory Therapy Technician | 0 | 2 | 2 | 239 | 51 | 56% | 4.7 |
| Dental Services Staff | 3 | 0 | 3 | 147 | 16 | 18% | 7 |
| Medical Director | 0 | 1 | 1 | 52 | 13 | 14% | 4 |
| Occupational Therapy Assistant | 0 | 3 | 3 | 43 | 6 | 7% | 5.4 |
| Physical Therapy Aide | 0 | 1 | 1 | 37 | 11 | 12% | 3.3 |
Source: CMS Long-Term Care Facility Characteristics (Data as of Jan 2026)
Residents meet regularly to discuss policies, care quality, and activities
Organized group of residents that meets regularly to discuss facility policies, quality of life, and activities.
Data sourced from CMS Long-Term Care Facility Characteristics quarterly report. Payer mix reflects the current resident census by primary payment source.
These measures show how residents usually do over time at this home, based on health outcomes and preventive care.
Indiana average: 8.0
Indiana average: 17.1
Indiana average: 12.0%
Indiana average: 14.4%
Indiana average: 24.6%
Indiana average: 3.9%
Indiana average: 4.4%
Indiana average: 1.2%
Indiana average: 5.7%
Indiana average: 24.1%
Indiana average: 12.4%
Indiana average: 93.7%
Indiana average: 95.4%
Indiana average: 1.60
Indiana average: 1.48
Indiana average: 81.7%
Indiana average: 1.4%
Indiana average: 79.0%
Indiana average: 22.4%
Indiana average: 10.5%
Indiana average: 0.8%
Indiana average: 53.7%
Indiana average: 50.6%
Quality measures are calculated from Minimum Data Set (MDS) assessments. For most measures, lower percentages indicate better care quality.
Historical financial and operational data for Majestic Care of Bloomington based on CMS SNF Cost Reports.
Loading trend charts...
Care Cost Calculator: See Prices in Your Area
Nursing Home Data Explorer
Don’t Wait Too Long: 7 Red Flag Signs Your Parent Needs Assisted Living Now
The True Cost of Assisted Living in 2025 – And How Families Are Paying For It
Understanding Senior Living Costs: Pricing Models, Discounts & Financial Assistance

Touring a community? Use this expert-backed checklist to stay organized, ask the right questions, and find the perfect fit.
We'll send you a PDF version of the touring checklist.


