


Hospitalizations per 1,000 days
 Number of hospitalizations per 1,000 long-stay resident days.
1.84
Number of hospitalizations per 1,000 long-stay resident days.
1.84
Tennessee average: 1.58
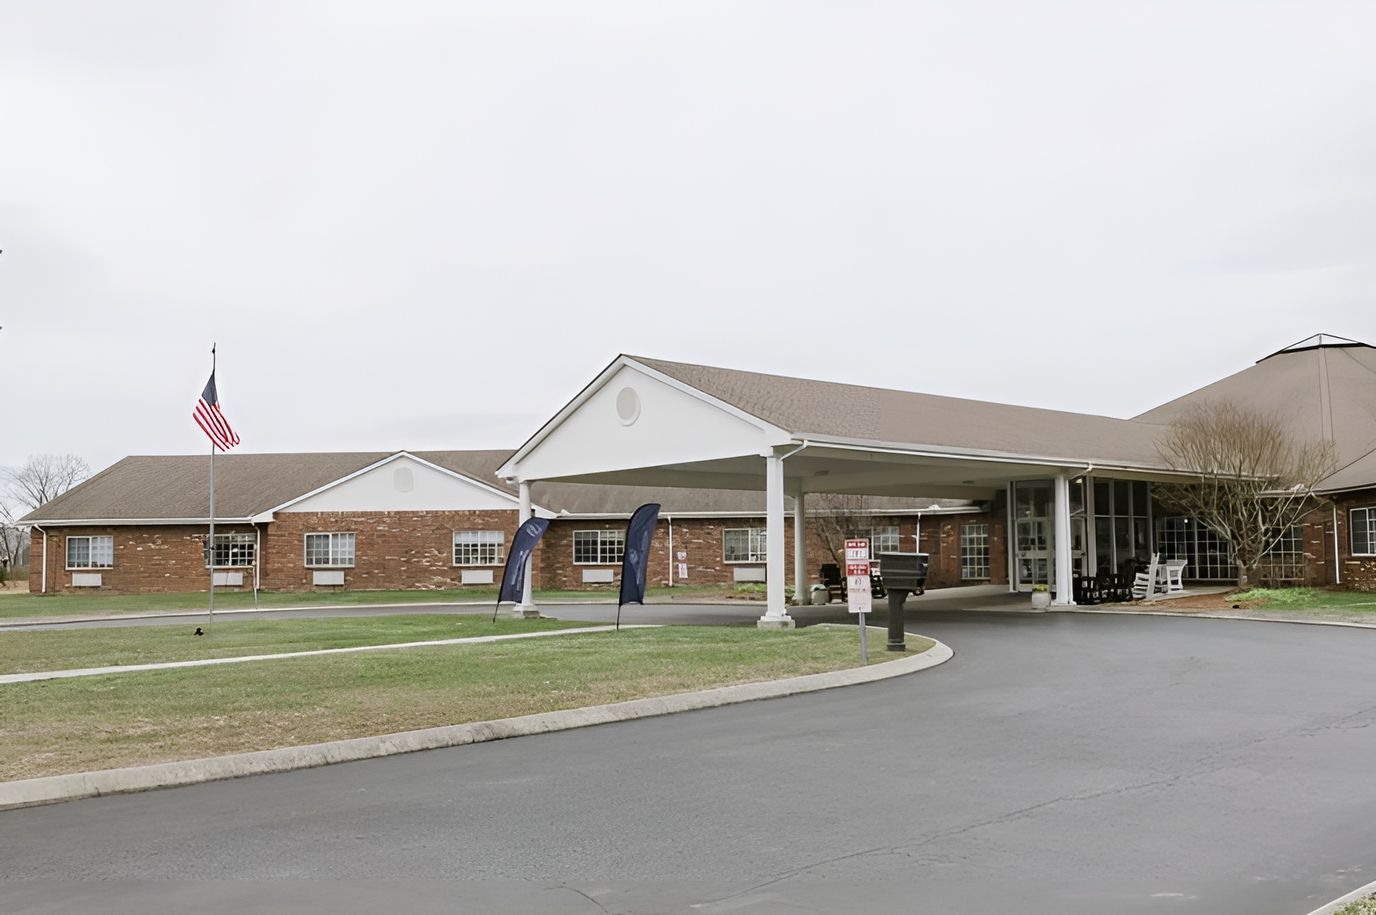

Owned by Kerry Dickerson, Manchester Center for Rehabilitation and Healing is a single-story skilled nursing community in Manchester, Tennessee. The facility is located on Interstate Drive in a car-dependent area, so most errands and visits require transportation. However, families can still conveniently access the surrounding region. Medicare, Medicaid, and private pay are accepted, giving families several ways to cover short-term post-acute rehabilitation and longer-term nursing care.
Residents stay an average of about 159 days, including those recovering after a hospital stay and needing ongoing skilled nursing care. The facility serves residents recovering from surgery or injury and those requiring longer-term support.
Daily care is provided by a care team. Registered nurses average 31 minutes of care per resident each day. Nurse aides provide 2 hours and 23 minutes of direct support, while licensed practical nurses contribute another 31 minutes. In total, residents receive about 3 hours and 15 minutes of nursing care each day. This staffing level supports rehabilitation goals and everyday personal care needs.
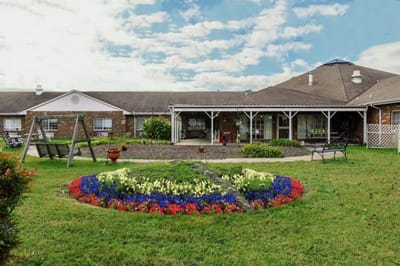
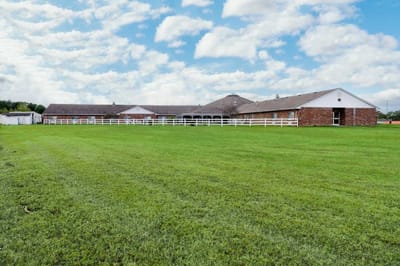
The community offers shared room accommodations and has a single-story layout. With this design, residents and families can wayfound around the building. Families considering Manchester Center should take a tour to learn more about the room setup, daily routines, and how the care team supports rehabilitation and ongoing care.
| Staff type | Hours / Day / Resident | vs state avg |
|---|---|---|
|
Registered Nurse (RN)
| 31m per day | ▼ 16% State avg: 37m per day · National avg: 41m per day |
|
LPN / LVN
| 1h 20m per day | ▲ 21% State avg: 1h 6m per day · National avg: 52m per day |
|
Nurse Aide
| 2h 23m per day | ▲ 10% State avg: 2h 9m per day · National avg: 2h 21m per day |
|
Weekend Total Nursing
| 3h 25m per day | ■ Avg State avg: 3h 21m per day · National avg: 3h 26m per day |
|
Physical Therapist
| 6m per day | ▲ 12% State avg: 5m per day · National avg: 4m per day |
|
Weekend RN
| 19m per day | ▼ 22% State avg: 25m per day · National avg: 29m per day |
Offers a balance of services and community atmosphere.
Federal penalties imposed by CMS for regulatory violations, including civil money penalties (fines) and denials of payment for new Medicare/Medicaid admissions.
Source: CMS Penalties Database
No penalties in the past 3 years
No civil money penalties or payment denials were reported in the last 3 years.
These measures show how residents usually do over time at this home, based on health outcomes and preventive care.
Tennessee average: 1.58
Tennessee average: 1.57
Tennessee average: 22.2%
Tennessee average: 11.2%
Tennessee average: 0.8%
Tennessee average: 53.7%
Tennessee average: 50.6%
Quality measures are calculated from Minimum Data Set (MDS) assessments. For most measures, lower percentages indicate better care quality.
41% of new residents, usually for short-term rehab.
33% of new residents, often for short stays.
27% of new residents, often for long-term daily care.
Based on CMS SNF Cost Report for fiscal year ending in 12/2023.
No pets allowed
Housing Options: Shared Rooms
Building Type: Single-story
Housekeeping Services
Social and Recreational Activities

On-site Medical Care and Health Services
Rehabilitative Support
Most residents typically stay for a few weeks or months before returning home or moving on.
New residents most often arrive under Medicare (41% of admissions), and a typical Medicare stay runs around 1 - 2 months.
Coverage residents most often arrive under.
Coverage residents most often leave under.
![]() 1.2 miles from city center
1.2 miles from city center
![]() Estimated distance in miles from Manchester's city center to Manchester Center for Rehabilitation and Healing's address, calculated via Google Maps.
Estimated distance in miles from Manchester's city center to Manchester Center for Rehabilitation and Healing's address, calculated via Google Maps.
Add your location
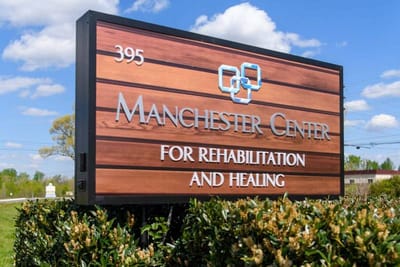
Manchester Center for Rehabilitation and Healing is located in Manchester, Tennessee.
Here are the financial assistance programs available to residents in Tennessee.
Manchester Center for Rehabilitation and Healing is in the Interstate Drive neighborhood.
Manchester Center for Rehabilitation and Healing has a walk score of 16. Car-dependent. Most errands require a car, with limited nearby walkable options.
Manchester Center for Rehabilitation and Healing's occupancy is 87.1%.
No, Manchester Center for Rehabilitation and Healing has a no-pet policy.
Manchester Center for Rehabilitation and Healing is registered as a for-profit.
Yes — there are 6 photos of Manchester Center for Rehabilitation and Healing in the photo gallery on this page.
Manchester Center for Rehabilitation and Healing is located at 395 Interstate Dr, Manchester, TN 37355.
Care Cost Calculator: See Prices in Your Area
Nursing Home Data Explorer
Don’t Wait Too Long: 7 Red Flag Signs Your Parent Needs Assisted Living Now
The True Cost of Assisted Living in 2025 – And How Families Are Paying For It
Understanding Senior Living Costs: Pricing Models, Discounts & Financial Assistance


