


Marquis Hope Village ALF
Nursing Home & Assisted Living · Canby, OR


Marquis Hope Village ALF
Nursing Home & Assisted Living · Canby, OR
Located on South Ivy, Marquis Hope Village is a nursing home in Canby, Oregon, that has been providing comprehensive care for over 28 years. The community also provides memory care, rehabilitation services, nursing care, and respite care within its 92-bed setting. With a Walk Score of 88, the community is in a highly walkable neighborhood where most services are available within walking distance.
With a broad range of clinical services, the community offers rehabilitation programs and post-hospital care. Short-term respite stays are also available for those needing temporary care. Specialized services include ventilator care and intravenous therapy for residents with more complex medical needs. Memory care and assisted living services are also provided to accommodate varying levels of care.
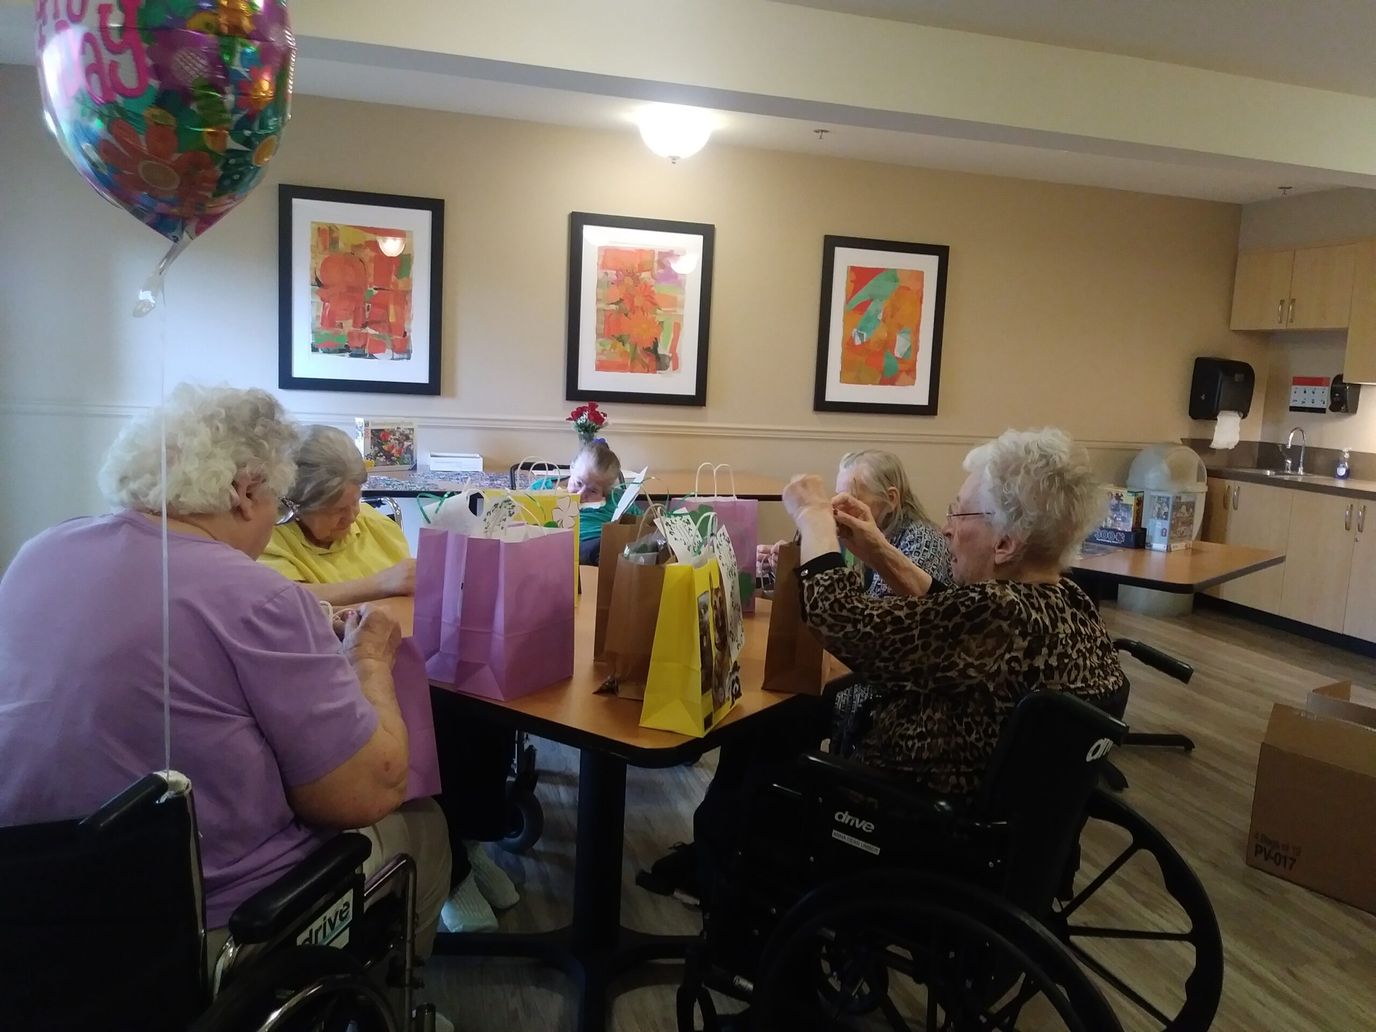
Licensed nursing staff is available around the clock, supplemented by an on-site nurse practitioner. Housekeeping services, an on-site hair salon and barber care, and a private dining room are also provided. Meanwhile, special events and holiday celebrations are conducted to encourage social engagement and community involvement.
Staffing documentation practices and call light response procedures were cited as areas requiring attention. Moreover, previous reviews noted concerns involving resident health service records, abuse reporting processes, staff training, fire safety compliance, and building maintenance. Corrective actions have been implemented to address these issues. However, staffing oversight and operational documentation still warrant ongoing compliance focus.
92-bed community Rank #69 / 351Bed count — State benchmarkedThis home is ranked 69th out of 351 homes in Oregon. Shows this facility's certified or reported bed count compared to other Oregon facilities. Larger communities may offer more amenities, programs, and on-site services for residents and families.Rankings are based only on facilities in Oregon that report data for that category. Facilities without available data are excluded from the ranking.Click the rank badge to see the full State ranking.Click here to see the full State ranking.
A larger shared setting that may offer more common spaces and organized community services.
28 years in operation Rank #104 / 374Years in operation — State benchmarkedThis home is ranked 104th out of 374 homes in Oregon. Shows how long this facility has been in operation compared to other Oregon facilities. Longer operating histories may benefit residents, families, and staff.Rankings are based only on facilities in Oregon that report data for that category. Facilities without available data are excluded from the ranking.Click the rank badge to see the full State ranking.Click here to see the full State ranking.
A longer operating history, which may indicate experience navigating regulations and delivering ongoing care.
Walk Score: 88 / 100 Rank #41 / 476Walk Score — State benchmarkedThis home is ranked 41st out of 476 homes in Oregon. Shows how walkable this facility's neighborhood is compared to the average Walk Score across Oregon facilities. Higher scores benefit residents, families, and staff.Rankings are based only on facilities in Oregon that report data for that category. Facilities without available data are excluded from the ranking.Click the rank badge to see the full State ranking.Click here to see the full State ranking.
Very walkable. Most errands can be accomplished on foot, and many essentials are within a short walk.
About this community
Facility TypeAssisted Living Facility
StatusActive
IssuanceMarch 4, 1998
CountyClackamas
License Number70M099
Marquis Hope Village ALF is administered by Marci Bird.
Owner NameMarquis Companies I, Inc
Rehabilitation Services
Respite Care
Short-Term Rehab
24-Hour Staffing
Post Hospital Care
Ventilator Care
Alzheimer’s / Memory Care
Assisted Living Communities
Home Health
Home Care
Hospice
24-Hour Licensed Nursing Services
Nurse Practitioner
Intravenous Therapy
Private Dining Room For Family
Special Events / Holidays
Activities Based On Hobbies And Interests
Hair Salon And Barber Services
Hospice & Respite Care
Laundry And Housekeeping
Wound And Pulmonary Care
Social Work Counseling
Nutritional Planning
Extensive Therapeutic Recreation Program
Dental And Podiatric Services
Monthly Pharmaceutical Review
Inspection History
In Oregon, the Department of Human Services, Aging and People with Disabilities performs unannounced surveys and regular inspections to ensure resident safety in all care settings.
Since 2022 · 4 years of data
10 deficiencies
3 inspections
Inspection Scorecard
 This scorecard compares key inspection, deficiency, and complaint metrics at this facility against the Oregon state average. Metrics rated ≥15% worse than average are highlighted in red; those ≥15% better are highlighted in green.
Since 2022 vs. Oregon state average
Overall vs. OR average
0 Worse
No metrics in this bucket.
3 Better
Metrics better than Oregon average:
• Total deficiencies (68% below)
• Deficiencies per year (68% below)
• Deficiencies per inspection (25% below)
• Total deficiencies (68% below)
• Deficiencies per year (68% below)
• Deficiencies per inspection (25% below)
Latest Inspection
July 1, 2024
Deficiencies
| This Facility | OR Average | vs. OR Avg |
|---|---|---|---|
|
Total deficiencies
| 10 | 31 | This facility has 68% fewer total deficiencies than a typical Oregon assisted living residence (10 vs. OR avg 31).↓ 68% better |
|
Deficiencies per year
| 2.5 | 7.8 | This facility has 68% fewer deficiencies per year than a typical Oregon assisted living residence (2.5 vs. OR avg 7.8).↓ 68% better |
|
Deficiencies per inspection
| 3.3 | 4.4 | This facility has 25% fewer deficiencies per inspection than a typical Oregon assisted living residence (3.3 vs. OR avg 4.4).↓ 25% better |
Inspections
| This Facility | OR Average | vs. OR Avg |
|---|---|---|---|
|
Total inspections
| 3 | 7 | This facility has had 57% fewer total inspections than the Oregon average (3 vs. OR avg 7). More inspections can mean more regulatory scrutiny rather than worse care.↓ 57% fewer |
Inspection Reports Summary
An editor-reviewed summary of the themes and findings across this facility's recent inspection reports.
- July 1, 2024 complaint investigation found one deficiency for failing to fully implement and update the Acuity Based Staffing Tool, affecting staffing hours and call light response times.
- May 17, 2023 kitchen inspection found the facility in substantial compliance with food sanitation rules, with only one minor comment-level deficiency noted.
- June 6, 2022 inspection cited 10 deficiencies including failure to report and investigate abuse, resident health services, training, fire safety, and building maintenance; some issues remained uncorrected after revisit.
Places of interest near Marquis Hope Village ALF
![]() 0.0 miles from city center
0.0 miles from city center
![]() Estimated distance in miles from Canby's city center to Marquis Hope Village ALF's address, calculated via Google Maps.
Estimated distance in miles from Canby's city center to Marquis Hope Village ALF's address, calculated via Google Maps.
Calculate Travel Distance to Marquis Hope Village ALF
Add your location
Frequently Asked Questions about Marquis Hope Village ALF
Who is the owner of Marquis Hope Village ALF?
Marquis Hope Village ALF is legally operated by Marquis Companies I, Inc., and administered by Marci Bird.
Is Marquis Hope Village ALF in a walkable area?
Marquis Hope Village ALF has a walk score of 88. Very walkable. Most errands can be accomplished on foot, and many essentials are within a short walk.
What is the license number of Marquis Hope Village ALF?
According to OR state health department records, Marquis Hope Village ALF's license number is 70M099.
What is the best email address for Marquis Hope Village ALF?
The team at Marquis Hope Village ALF can be reached at mkbird@marquiscompanies.com.
Who is the administrator of Marquis Hope Village ALF?
Marci Bird is the administrator of Marquis Hope Village ALF.
How many beds does Marquis Hope Village ALF have?
Marquis Hope Village ALF has 92 beds.
Has Marquis Hope Village ALF had any recent deficiencies?
Marquis Hope Village ALF has had 10 recently reported deficiencies.
Guides for Better Senior Living
Care Cost Calculator: See Prices in Your Area
Nursing Home Data Explorer
Don’t Wait Too Long: 7 Red Flag Signs Your Parent Needs Assisted Living Now
The True Cost of Assisted Living in 2025 – And How Families Are Paying For It
Understanding Senior Living Costs: Pricing Models, Discounts & Financial Assistance
Updated on
