Marshwood Center
Nursing Home, Hospice Care, Palliative Care & Respite Care · Lewiston, ME
CMS overall rating Info CMS (the Centers for Medicare & Medicaid Services) is the federal agency that rates nursing home quality. Its Overall Rating runs from 1 to 5 stars, combining health inspections, staffing, and quality measures, with inspections weighted most heavily.

Marshwood Center

Nursing Home, Hospice Care, Palliative Care & Respite Care · Lewiston, ME
CMS overall rating Info CMS (the Centers for Medicare & Medicaid Services) is the federal agency that rates nursing home quality. Its Overall Rating runs from 1 to 5 stars, combining health inspections, staffing, and quality measures, with inspections weighted most heavily.
Calculator: See prices in your area
Marshwood Center accepts Medicaid, Medicare, and private pay.

Overview of Marshwood Center

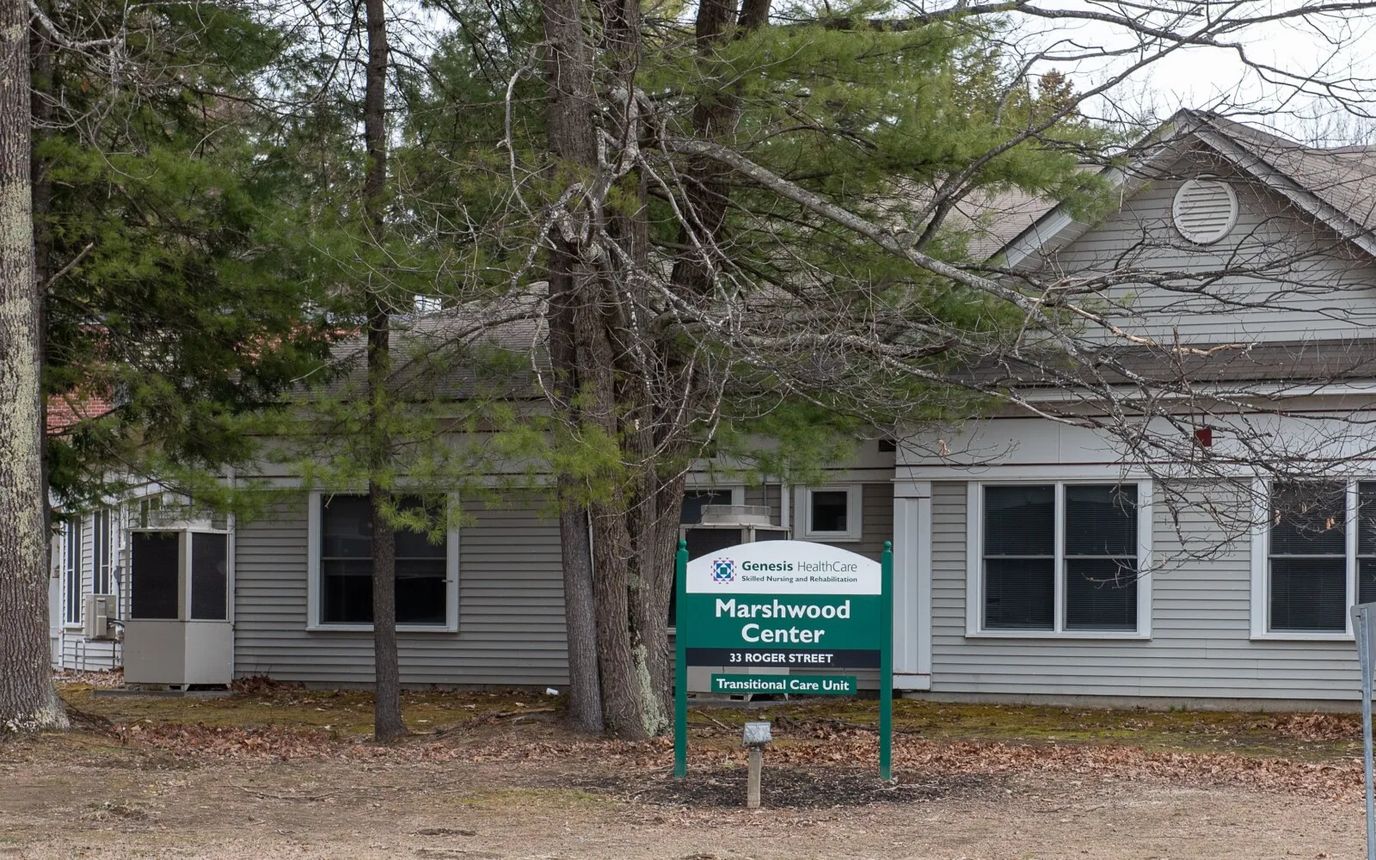
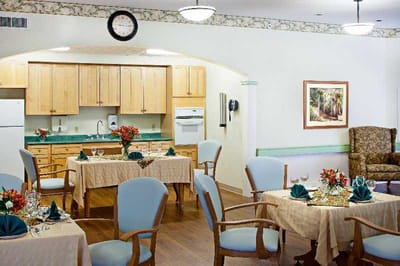
Marshwood Center of the Genesis Healthcare Community is an exceptional senior living community located in Lewiston, ME. It provides a wide variety of living options and healthcare services, including assisted living, short-term rehabilitation, long-term care, and respite care. A recipient of the AHCA Bronze Quality Award, Marshwood Center has proven excellence in improving the overall well-being and health of everyone it serves.

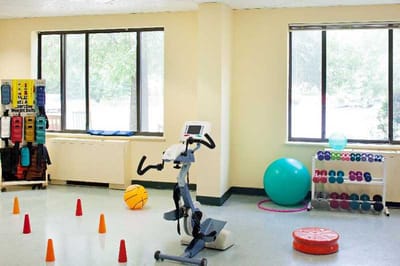
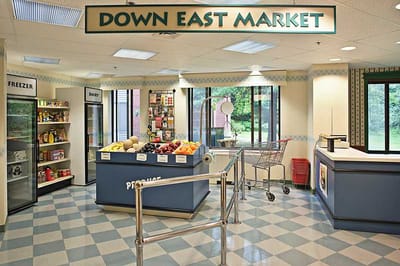
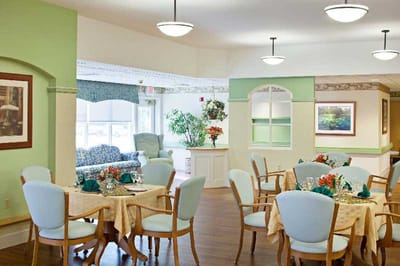
Keeping a professional and compassionate level of service for its residents, Marshwood Center cultivates the holistic needs of its residents through a spectrum of amenities, including a fitness room, housekeeping, individual climate control, and comfortable common and lounge areas where residents can gather with friends and family. During critical life moments, you need excellent support to understand your unique needs and when it comes to this, Marshwood Center is a community you can trust.

Quality ratings

Measured by Centers for Medicare & Medicaid Services (CMS)

Overall rating Info The Overall CMS Rating combines results from health inspections, staffing levels and quality measures. Health inspections carry the most weight. Staffing and quality scores can increase or decrease the final rating based on performance compared to state and national standards.
At ME avg. At ME avg.ME average: 3.0Click the badge to see the full State ranking.Click here to see the full State ranking.
Health Inspection Info Based on the results of the facility's three most recent standard inspections and any complaint investigations. CMS reviews the number, scope, and severity of deficiencies, with more recent findings weighted more heavily.
▲ 5.5% Above ME avg. ▲ 5.5% Above ME avg.ME average: 2.8Click the badge to see the full State ranking.Click here to see the full State ranking.
Staffing Info Measures average nursing staff hours per resident per day, including Registered Nurses (RNs) and total nursing staff. Ratings are adjusted based on the level of care residents require and are compared to state and national benchmarks.
At ME avg. At ME avg.ME average: 4.0Click the badge to see the full State ranking.Click here to see the full State ranking.
Quality Measures Info Based on clinical and physical health indicators reported to CMS, such as hospital readmissions, falls, pressure ulcers, and improvements in mobility. These measures reflect how well residents' health needs are being managed.
▲ 46.7% Above ME avg. ▲ 46.7% Above ME avg.ME average: 2.7Click the badge to see the full State ranking.Click here to see the full State ranking.

Staffing hours breakdown

Info Daily nursing hours per resident by staff type, reported to CMS. Higher is generally better — compare this facility to state and national averages to see where staffing stands.

Hours per resident per day — compared to Maine state averages

Total nursing care / resident Info This home is ranked 27th out of 34 homes in Maine for nurse hours. Total adjusted nursing hours per resident per day, combining RN, LPN, and aide time. CMS adjusts this for case-mix so facilities can be fairly compared.
3h 29m per day
Rank #27 / 34Nurse hours — State benchmarkedThis home is ranked 27th out of 34 homes in Maine. Shows adjusted nurse hours per resident per day benchmarked to the Maine average, with a ranking across 34 Maine facilities. More hours mean more direct care. The national average is about 3.5 hrs; below 3.0 is a red flag.Rankings are based only on facilities in Maine that report data for that category. Facilities without available data are excluded from the ranking.Click the rank badge to see the full State ranking.Click here to see the full State ranking.
This facility Maine avg (4h 30m per day)
vs Maine avg
-22%

3 of 6 metrics below state avg

Standout metric Physical Therapist is +37% above state avg
Staff typeHours / Day / Residentvs state avg
Registered Nurse (RN) Info RNs hold the highest nursing license and can assess residents, interpret test results, and direct care plans. More RN hours per day often signals stronger clinical oversight and faster response to health changes. 1h 2m per day ■ Avg State avg: 1h 2m per day · National avg: 41m per day
LPN / LVN Info Licensed Practical Nurses (LPNs) or Licensed Vocational Nurses (LVNs) deliver routine hands-on care — medication administration, wound dressing, and monitoring vital signs. They work under RN supervision and make up a large share of daily bedside care. 20m per day ▼ 26% State avg: 27m per day · National avg: 52m per day
Nurse Aide Info Certified Nurse Aides (CNAs) provide the most direct day-to-day assistance: bathing, dressing, feeding, and mobility. Nurse aide hours are typically the largest staffing category and directly affect residents' quality of life. 2h 32m per day ▼ 11% State avg: 2h 52m per day · National avg: 2h 20m per day
Weekend Total Nursing Info Combined nursing hours (RN + LPN + Nurse Aide) per resident per day on weekends. Staffing often drops on weekends — this figure reveals whether the facility maintains adequate coverage outside of weekday hours. 3h 39m per day ▼ 7% State avg: 3h 55m per day · National avg: 3h 26m per day
Physical Therapist Info Hours per resident per day provided by licensed Physical Therapists (PTs) or PT Assistants. PT services help residents recover mobility after injury or illness and are especially important for post-acute (short-stay) rehabilitation. 5m per day ▲ 37% State avg: 4m per day · National avg: 4m per day
Weekend RN Info Registered nurse hours specifically on weekends. Facilities sometimes reduce RN presence on Saturdays and Sundays — a low weekend RN figure compared to weekday hours can indicate reduced clinical oversight when most administrative staff are absent. 47m per day ▲ 6% State avg: 44m per day · National avg: 28m per day

Capacity and availability

This home usually has limited availability

Higher occupancy than the Maine average: 83.1%
Occupancy rate
89% Rank #152 / 251Occupancy rate — State benchmarkedThis home is ranked 152nd out of 251 homes in Maine. Shows this facility's occupancy rate versus the Maine average, with its Statewide rank out of 251. Higher occupancy signals strong local demand and financial stability.Rankings are based only on facilities in Maine that report data for that category. Facilities without available data are excluded from the ranking.Click the rank badge to see the full State ranking.Click here to see the full State ranking.
Avg. Length of Stay
89 days
Bed community size
108-bed community Rank #10 / 357Bed count — State benchmarkedThis home is ranked 10th out of 357 homes in Maine. Shows this facility's certified or reported bed count compared to other Maine facilities. Larger communities may offer more amenities, programs, and on-site services for residents and families.Rankings are based only on facilities in Maine that report data for that category. Facilities without available data are excluded from the ranking.Click the rank badge to see the full State ranking.Click here to see the full State ranking.
A larger shared setting that may offer more common spaces and organized community services.
Years in operation
15 years in operation
A community with a solid operating history and experience delivering ongoing care.
Walk Score
Walk Score: 21 / 100 Rank #223 / 422Walk Score — State benchmarkedThis home is ranked 223rd out of 422 homes in Maine. Shows how walkable this facility's neighborhood is compared to the average Walk Score across Maine facilities. Higher scores benefit residents, families, and staff.Rankings are based only on facilities in Maine that report data for that category. Facilities without available data are excluded from the ranking.Click the rank badge to see the full State ranking.Click here to see the full State ranking.
Car-dependent. Most errands require a car, with limited nearby walkable options.

About this community

Awards

2024 AHCA/NCAL Bronze National Quality Award

License Details

CMS Certification Number205072
AccreditationsAHCA Bronze Quality Award

Staffing

Key information about the people who lead and staff this community.

Leadership

ContactMs. Meghan Welch, Executive Director

Staff Composition

Total Employees
35
Full-Time Employees
35

Payment & Insurance

2 services
Accept Medicaid
Accept Medicare

Therapy & Rehabilitation

3 services
Rehabilitation Services
Respite Care
Short-Term Rehab

Staffing & Medical

2 services
Doctor on Staff
24-Hour Staffing

Additional Services

4 services
Shortstay Care
Longterm Care
Palliative Care
Rehabilitation Therapy

Additional Policies & Features

HousekeepingYes
Linen ServiceYes

Amenities & Lifestyle

Private And Semi-Private Rooms
Individual Climate Control
Activity Room
Fitness Room
Conveniently Located
Beauty Salon / Barber Services
Cable Television
Comfortable Common And Lounge Areas
Dining Room
In-Room Dining Options
Complimentary Laundry Facility On-Site
Computer With Internet Access
Housekeeping
Laundry Facility On-Site
Mail And Newspaper Service
Pets Permitted
Phone Service
Wireless Internet
Smoke Free Environment
Specific ProgramsOrthopedic Rehabilitation, VA Contracted, On-site Medical Director, On-site Nurse Practitioner, Attending Physicians, Registered Nurses, IV Therapy, Total Parenteral Nutrition (TPN), Colostomy care, Podiatry care, Wound care, Pain management, Case management, Dietary and nutrition needs management, Discharge planning, Individual treatment plans, Coordinated transportation, Cultural, educational, religious and social activities, Recreation activities

Contact Marshwood Center

Inspection History

In Maine, the Department of Health and Human Services, Division of Licensing and Certification is responsible for inspecting long-term care facilities to ensure they meet quality of care standards.

Since 2021 · 5 years of data 30 deficiencies 4 inspections

Inspection Scorecard Info This scorecard compares key inspection, deficiency, and complaint metrics at this facility against the Maine state average. Metrics rated ≥15% worse than average are highlighted in red; those ≥15% better are highlighted in green.

Since 2021 vs. Maine state average
Overall vs. ME average 3 Worse Metrics worse than Maine average:
• Total deficiencies (900% above)
• Deficiencies per year (900% above)
• Deficiencies per inspection (3650% above)
1 Better Metrics better than Maine average:
• Total inspections (80% below)
Latest Inspection December 19, 2024 Routine

Deficiencies Info Deficiencies are formal regulatory issues recorded during state inspections.

This FacilityME Averagevs. ME Avg
Total deficiencies Info Formal regulatory issues recorded by inspectors across all inspection types. 303 This facility has 900% more total deficiencies than a typical Maine nursing home (30 vs. ME avg 3).↑ 900% worse
Deficiencies per year Info Average deficiencies per year since 2021. 60.6 This facility has 900% more deficiencies per year than a typical Maine nursing home (6 vs. ME avg 0.6).↑ 900% worse
Deficiencies per inspection Info Average deficiencies per inspection. 7.50.2 This facility has 3650% more deficiencies per inspection than a typical Maine nursing home (7.5 vs. ME avg 0.2).↑ 3650% worse

Inspections Info State inspections evaluate whether the facility meets health and safety standards.

This FacilityME Averagevs. ME Avg
Total inspections Info Combined count of all routine and focused inspections. Excludes complaint investigations. 420 This facility has 80% fewer total inspections than a typical Maine nursing home (4 vs. ME avg 20).↓ 80% better

Health Inspection History

Inspections since 2021
Total health inspections 5

Maine average 5


Last Health inspection on Dec 2024

Total health citations
31 Rank #19 / 34Health citations — State benchmarkedThis home is ranked 19th out of 34 homes in Maine. Shows this facility's total health deficiency citations benchmarked to the Maine State average, with a ranking across all 34 ME facilities. Lower citation counts earn a better rank.Rankings are based only on facilities in Maine that report data for that category. Facilities without available data are excluded from the ranking.Click the rank badge to see the full State ranking.Click here to see the full State ranking.

Maine average 28.5

Citations per inspection
6.2 Rank #21 / 34Citations per inspection — State benchmarkedThis home is ranked 21st out of 34 homes in Maine. Shows average deficiency citations per CMS inspection for this facility versus the Maine mean across 34 facilities with citation data. Lower is better.Rankings are based only on facilities in Maine that report data for that category. Facilities without available data are excluded from the ranking.Click the rank badge to see the full State ranking.Click here to see the full State ranking.

Maine average 5.88


Health citations are formal notices following inspections when they fail to comply with safety and care standards.

28 of 31 citations resulted from standard inspections; and 3 of 31 resulted from complaint investigations.

Breakdown of citation severity (last 5 years)
Critical health citations
0
100% better than Maine average

Maine average: 0.3


Serious health citations
0
100% better than Maine average

Maine average: 0.4

0 critical citations Maine average: 0.3

0 serious citations Maine average: 0.4

29 moderate citations Maine average: 25.8

2 minor citations Maine average: 2.1
Citations history (last 5 years)
Administration moderate citation Dec 19, 2024
Corrected

Nursing Services moderate citation Dec 19, 2024
Corrected

Nursing Services moderate citation Dec 19, 2024
Corrected

Nursing Services minor citation Dec 19, 2024
Corrected

Staffing Data

Reporting period: October 1 – December 31, 2025 (Q4 2025). Source: CMS Payroll-Based Journal report.

Total staff 177
Employees 163
Contractors 14
Staff to resident ratio 1.72 : 1
15% fewer staff per resident than Maine average
Maine average ratio: 2.03 : 1 Maine average ratio: 2.03 : 1See full Maine ranking
Avg staff/day 63
Average shift 7.4 hours
9% worse than Maine average
Maine average: 8.1 hours Maine average shift: 8.1 hoursSee full Maine ranking
Total staff hours (quarter) 42,814

Nursing staff breakdown

Q4 2025 · Oct 1 – Dec 31 More info This data comes from the CMS Payroll-Based Journal report covering October 1 – December 31, 2025.
Registered Nurse

Manages medical care and health needs.

RN Staff Info 26 total: 25 full-time employees and 1 contractor. 26
Average shift length Info Average shift length. Calculated as total hours divided by days worked and average staff per day. 8.5 hours
Licensed Practical Nurse

Assists with medical care and medications.

LPN Staff Info 10 total: 5 full-time employees and 5 contractors. 10
Average shift length Info Average shift length. Calculated as total hours divided by days worked and average staff per day. 7.9 hours
Certified Nursing Assistant

Helps with daily care and mobility.

CNA Staff Info All 79 CNA Staff are full-time employees. No contractors work on this role. 79
Average shift length Info Average shift length. Calculated as total hours divided by days worked and average staff per day. 7.2 hours

Contractor staffing

Q4 2025 · Oct 1 – Dec 31 More info This data comes from the CMS Payroll-Based Journal report covering October 1 – December 31, 2025.

Total hours from contractors

3.8%

1,622 contractor hours this quarter

Licensed Practical Nurse: 5 Occupational Therapy Aide: 2 Occupational Therapy Assistant: 2 Registered Nurse: 1 Qualified Social Worker: 1 Speech Language Pathologist: 1 Mental Health Service Worker: 1 Medical Director: 1

Staff by category

Q4 2025 · Oct 1 – Dec 31 More info This data comes from the CMS Payroll-Based Journal report covering October 1 – December 31, 2025.
Certified Nursing Assistant7907919,47792100%7.2
Registered Nurse251267,23292100%8.5
Medication Aide/Technician110113,57992100%7.5
Licensed Practical Nurse55102,56792100%7.9
Clinical Nurse Specialist5051,7618289%7.1
Other Dietary Services Staff9091,1479199%6
Speech Language Pathologist3141,0767379%7.3
Physical Therapy Assistant4048827177%7.5
Respiratory Therapy Technician6068326874%7.7
Physical Therapy Aide5057897683%6.4
Qualified Social Worker3146226571%7.3
Mental Health Service Worker1125956267%8.5
Administrator2024705964%8
Other Social Services Staff1014676065%7.8
RN Director of Nursing1014646267%7.5
Nurse Practitioner2024645863%8
Occupational Therapy Aide0222513841%6.6
Occupational Therapy Assistant022954347%2.1
Medical Director011391011%3.9
Nurse Aide in Training101811%7.5
79 Certified Nursing Assistant
% of Days 100%
26 Registered Nurse
% of Days 100%
11 Medication Aide/Technician
% of Days 100%
10 Licensed Practical Nurse
% of Days 100%
5 Clinical Nurse Specialist
% of Days 89%
9 Other Dietary Services Staff
% of Days 99%
4 Speech Language Pathologist
% of Days 79%
4 Physical Therapy Assistant
% of Days 77%
6 Respiratory Therapy Technician
% of Days 74%
5 Physical Therapy Aide
% of Days 83%
4 Qualified Social Worker
% of Days 71%
2 Mental Health Service Worker
% of Days 67%
2 Administrator
% of Days 64%
1 Other Social Services Staff
% of Days 65%
1 RN Director of Nursing
% of Days 67%
2 Nurse Practitioner
% of Days 63%
2 Occupational Therapy Aide
% of Days 41%
2 Occupational Therapy Assistant
% of Days 47%
1 Medical Director
% of Days 11%
1 Nurse Aide in Training
% of Days 1%

Penalties and fines

Federal penalties imposed by CMS for regulatory violations, including civil money penalties (fines) and denials of payment for new Medicare/Medicaid admissions.

Source: CMS Penalties Database

No penalties in the past 3 years

No civil money penalties or payment denials were reported in the last 3 years.

Quality of care over time

These measures show how residents usually do over time at this home, based on health outcomes and preventive care.

High-risk clinical events score Info A composite score based on pressure ulcers, falls with injury, weight loss, walking ability decline, and activities of daily living decline. 13.8
In line with Maine average

Maine average: 14.2

Functional decline score Info A composite score based on activities of daily living decline, walking ability decline, and incontinence. 28.1
In line with Maine average

Maine average: 29.1

Long-stay resident measures
Above average Maine avg: 2.6 Info CMS star rating based on long-stay quality measure performance. 5 stars = significantly above average, 1 star = significantly below average.
Need for Help with Daily Activities Increased Info Percent of long-stay residents whose need for help with daily activities has increased 18.8%
28% better than Maine average

Maine average: 26.0%

Walking Ability Worsened Info Percent of long-stay residents whose ability to move independently worsened 31.2%
In line with Maine average

Maine average: 31.4%

Low Risk Residents with Bowel/Bladder Incontinence Info Percent of low risk long-stay residents who lose control of their bowels or bladder 34.3%
15% worse than Maine average

Maine average: 29.8%

Falls with Major Injury Info Percent of long-stay residents experiencing one or more falls with major injury 0.7%
85% better than Maine average

Maine average: 4.4%

High Risk Residents with Pressure Ulcers Info Percent of long-stay high risk residents with pressure ulcers 6.3%
41% worse than Maine average

Maine average: 4.5%

Urinary Tract Infection Info Percent of long-stay residents with a urinary tract infection 2.1%
25% better than Maine average

Maine average: 2.8%

Lost Too Much Weight Info Percent of long-stay residents who lose too much weight 11.7%
112% worse than Maine average

Maine average: 5.5%

Depressive Symptoms Info Percent of long-stay residents who have depressive symptoms 9.1%
13% better than Maine average

Maine average: 10.5%

Antipsychotic Use Info Percent of long-stay residents who received an antipsychotic medication 13.9%
30% better than Maine average

Maine average: 19.8%

Pneumococcal Vaccine Info Percent of long-stay residents assessed and appropriately given the pneumococcal vaccine 92.2%
In line with Maine average

Maine average: 90.1%

Influenza Vaccine Info Percent of long-stay residents assessed and appropriately given the seasonal influenza vaccine 92.9%
In line with Maine average

Maine average: 95.5%

Hospitalizations per 1,000 days Info Number of hospitalizations per 1,000 long-stay resident days. 0.84
40% better than Maine average

Maine average: 1.39

ED visits per 1,000 days Info Number of outpatient emergency department visits per 1,000 long-stay resident days. 0.40
81% better than Maine average

Maine average: 2.08

Short-stay resident measures
Significantly above average Maine avg: 3.3 Info CMS star rating based on short-stay quality measure performance. 5 stars = much above average, 1 star = much below average.
Pneumococcal Vaccine Info Percent of short-stay residents assessed and appropriately given the pneumococcal vaccine 85.3%
20% better than Maine average

Maine average: 70.8%

Antipsychotic medication increase Info Percent of short-stay residents who newly received an antipsychotic medication 0.6%
62% better than Maine average

Maine average: 1.4%

Influenza Vaccine Info Percent of short-stay residents assessed and appropriately given the seasonal influenza vaccine 82.2%
10% better than Maine average

Maine average: 74.5%

Re-hospitalized after SNF stay Info Percentage of short-stay residents who were re-hospitalized after their nursing home admission. 14.9%
27% better than Maine average

Maine average: 20.5%

Emergency department visits Info Percentage of short-stay residents who had an outpatient emergency department visit. 7.8%
50% better than Maine average

Maine average: 15.6%

Falls with major injury Info Percentage of SNF residents who experience falls with major injury during their stay. 0.7%
10% better than Maine average

Maine average: 0.8%

Ability to care for self at discharge Info Percentage of residents at or above expected ability to care for themselves at discharge. 49.1%
9% worse than Maine average

Maine average: 53.7%

Successful return to home or community Info Rate of successful return to home or community from a skilled nursing facility. 60.4%
20% better than Maine average

Maine average: 50.6%

Breakdown by payment type

Medicare

31% of new residents, usually for short-term rehab.

Typical stay 1 - 2 months

Private pay

58% of new residents, often for short stays.

Typical stay 1 months

Medicaid

11% of new residents, often for long-term daily care.

Typical stay 1 - 2 years

Facility Characteristics

Source: CMS Long-Term Care Facility Characteristics (Data as of Jan 2026)

Total residents 103
Medicare
13
12.6% of residents
Medicaid
67
65% of residents
Private pay or other
23
22.3% of residents
Programs & Services
Residents Group

Residents meet regularly to discuss policies, care quality, and activities

Nurse Aide Training

State-approved Nurse Aide Training and Competency Evaluation Program on-site

Active Resident Council

Organized group of residents that meets regularly to discuss facility policies, quality of life, and activities.

Finances and operations

Based on CMS SNF Cost Report for fiscal year ending in 09/2023.

For-profit
Operated by a single business entity.
Net patient revenue Info Net patient revenue — what the home actually collects for resident care, after contractual allowances, bad debt and discounts are subtracted from its gross charges (CMS cost report, Worksheet G-3). It covers resident care only; money the home earns from other sources is shown separately as "Other income."
$13.4M
Net patient income Info Net patient income: net patient revenue minus the home's total operating expenses. A positive figure means it earns more from resident care than it spends to deliver it; a negative figure means the opposite. It excludes non-operating "other income."
-$534.8K
For-profit Operated by a single business entity.
Net patient revenue Info Net patient revenue — what the home actually collects for resident care, after contractual allowances, bad debt and discounts are subtracted from its gross charges (CMS cost report, Worksheet G-3). It covers resident care only; money the home earns from other sources is shown separately as "Other income."
$13.4M Rank #11 / 40Revenue — State benchmarkedThis home is ranked 11th out of 40 homes in Maine. Shows this facility's annual revenue compared to the Maine average. Higher revenue generally means more resources for staffing and capital — read alongside Payroll %.Rankings are based only on facilities in Maine that report data for that category. Facilities without available data are excluded from the ranking.Click the rank badge to see the full State ranking.Click here to see the full State ranking.
Net patient income Info Net patient income: net patient revenue minus the home's total operating expenses. A positive figure means it earns more from resident care than it spends to deliver it; a negative figure means the opposite. It excludes non-operating "other income."
-$534.8K
Other income Info Money the home earns outside of resident care — such as investments, grants, rentals and other non-operating sources (CMS cost report, Worksheet G-3). It is tracked separately from net patient revenue: it is not part of that figure, and it is not included in net patient income.
$1.1M
Payroll costs Info Staff salaries plus wage-related costs — benefits such as payroll taxes, health insurance and retirement — from the home's own accounting records (CMS cost report, Worksheet A). Contract or agency labor is counted separately, under other operating costs. Rank #13 / 40Payroll — State benchmarkedThis home is ranked 13th out of 40 homes in Maine. Shows total annual staff payroll benchmarked to the Maine average. Higher payroll investment relative to peers often signals better staffing and less reliance on cheaper contract labor.Rankings are based only on facilities in Maine that report data for that category. Facilities without available data are excluded from the ranking.Click the rank badge to see the full State ranking.Click here to see the full State ranking.
$6.0M 45.2% of net patient revenue Info Payroll as a share of revenue: staff salaries and wage-related benefits divided by net patient revenue. A higher figure means more of each revenue dollar goes to staff pay. Rank #19 / 40Payroll % — State benchmarkedThis home is ranked 19th out of 40 homes in Maine. Shows payroll as a percentage of revenue versus the Maine average. Well-run Maine facilities typically land around 60–66% — the top third Statewide. Below 25% may signal understaffing or heavy agency use — read with Staffing ratings.Rankings are based only on facilities in Maine that report data for that category. Facilities without available data are excluded from the ranking.Click the rank badge to see the full State ranking.Click here to see the full State ranking.
Other operating costs Info Everything it costs to run the home apart from payroll — food, utilities, supplies, maintenance, contract labor and administration. Calculated as total operating expense minus payroll (staff salaries and wage-related benefits).
$7.9M
Total costs Info The home's total operating expense for the year — all the costs of running it, salaries included (CMS cost report, Worksheet G-3).
$13.9M

What does this home offer?

Pets allowed icon
Pets allowed icon

Pets Allowed

Housing options icon

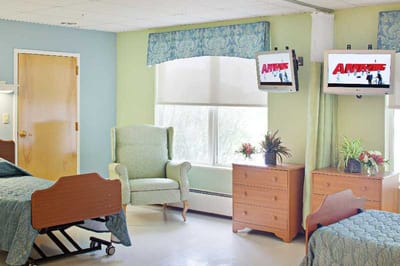
Housing Options: Private Rooms / Semi-Private Rooms

Building type icon
Building type icon

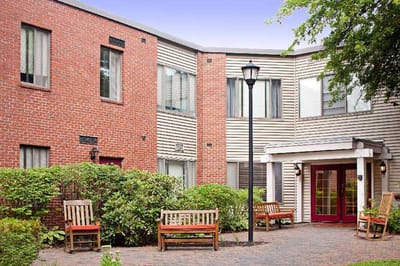
Building Type: Two-story

Transportation services icon

Transportation Services

Fitness and recreation icon

Fitness and Recreation

Who this home usually serves

TYPE OF STAY

Mix of rehab and long-term care

This home supports both short-term rehab and long-term care, with residents staying for a wide range of durations.

Most new residents arrive under private pay (58% of admissions), and a typical private pay stay runs around 1 months.

Admissions
386 total

Coverage residents most often arrive under.

Medicare 31%
Private pay 58%
Medicaid 11%
Discharges
392 total

Coverage residents most often leave under.

Medicare 23%
Private pay 52%
Medicaid 25%

Places of interest near Marshwood Center

Address 2.8 miles from city center Info Estimated distance in miles from Lewiston's city center to Marshwood Center's address, calculated via Google Maps. — 1.93 miles to nearest hospital (St. Mary's Regional Medical Center)

Calculate Travel Distance to Marshwood Center

Add your location

Address

Compare Nursing Homes around Lewiston

The information below is reported by the Maine Department of Health and Human Services, Division of Licensing and Certification.

4 facilities compared · CMS & ME Dept. of Health data

Marshwood Center
NH
HC
PC
RC
Lewiston
108
Facility 108
ME AVG 20
Rank #10 / 357
89.0%
Facility 89.0%
ME AVG 83.1%
Rank #152 / 251
+7%
3.49
Facility 3.49
ME AVG 4.50
Rank #27 / 34
-2%-22%
$0
Facility $0
ME AVG $26.4k
Rank #1 / 34
31
Facility 31
ME AVG 28.5
Rank #19 / 34
6.2
Facility 6.2
ME AVG 5.9
Rank #21 / 34
-99-
21
Facility 21
ME AVG 31
Rank #223 / 422
Beth Barends
$13.4M
Facility $13.4M
ME AVG $16.9M
Rank #11 / 40
$6.0M
Facility $6.0M
ME AVG $4.7M
Rank #13 / 40
45.2%
Facility 45.2%
ME AVG 37.8%
Rank #19 / 40
205072
St. Mary’s D‘Youville Pavilion
NH
IL
MC
Lewiston
210
Facility 210
ME AVG 20
Rank #2 / 357
--
3.97
Facility 3.97
ME AVG 4.50
Rank #20 / 34
+43%-12%
$0
Facility $0
ME AVG $26.4k
Rank #1 / 34
25
Facility 25
ME AVG 28.5
Rank #9 / 34
5.0
Facility 5.0
ME AVG 5.9
Rank #11 / 34
-168-
0
Facility 0
ME AVG 31
Rank #373 / 422
-
-
Facility -
ME AVG $16.9M
Rank #3 / 40
-
Facility -
ME AVG $4.7M
Rank #12 / 40
-
Facility -
ME AVG 37.8%
Rank #34 / 40
205053
Russell Park Rehabilitation & Living Center
NH
AL
RC
Lewiston (Russell Street)
50
Facility 50
ME AVG 20
Rank #56 / 357
87.3%
Facility 87.3%
ME AVG 83.1%
Rank #164 / 251
+5%
4.33
Facility 4.33
ME AVG 4.50
Rank #16 / 34
-34%-4%
$0
Facility $0
ME AVG $26.4k
Rank #1 / 34
46
Facility 46
ME AVG 28.5
Rank #29 / 34
9.2
Facility 9.2
ME AVG 5.9
Rank #30 / 34
-46-
41
Facility 41
ME AVG 31
Rank #146 / 422
-
$7.3M
Facility $7.3M
ME AVG $16.9M
Rank #26 / 40
$3.8M
Facility $3.8M
ME AVG $4.7M
Rank #34 / 40
51.4%
Facility 51.4%
ME AVG 37.8%
Rank #36 / 40
205052
Montello Manor
NH
AL
NC
Lewiston (College Street)
37
Facility 37
ME AVG 20
Rank #68 / 357
81.0%
Facility 81.0%
ME AVG 83.1%
Rank #180 / 251
-2%
4.18
Facility 4.18
ME AVG 4.50
Rank #19 / 34
-38%-7%
$14.5k
Facility $14.5k
ME AVG $26.4k
Rank #30 / 34
38
Facility 38
ME AVG 28.5
Rank #25 / 34
7.6
Facility 7.6
ME AVG 5.9
Rank #27 / 34
134-
33
Facility 33
ME AVG 31
Rank #174 / 422
Richard A. Rousseau Trust B
$5.8M
Facility $5.8M
ME AVG $16.9M
Rank #34 / 40
$2.9M
Facility $2.9M
ME AVG $4.7M
Rank #33 / 40
50.2%
Facility 50.2%
ME AVG 37.8%
Rank #30 / 40
205006

Financial Assistance for
Nursing Home in Maine

Marshwood Center is located in Lewiston, Maine.
Here are the financial assistance programs available to residents in Maine.

Get Financial aid guidance

Home and Community Benefits for the Elderly

MaineCare HCB Program

Age 65+ or 18+ with disability
General Maine resident, Medicaid- eligible, nursing home-level care need.
Income Limits (2025) ~$2,829/month 300% FBR, individual
Asset Limits $2,000 (individual), $3,000 (couple).
ME

Rural access emphasized.

Benefits
Personal care (5-7 hours/day) Respite (240 hours/year) Meals ($6/meal) Adult day services ($60/day)

Maine Statewide Respite Program

ME Respite Program

Age
General Caregiver of someone 60+ with dementia, Maine resident.
Income Limits ~$2,500/month individual, varies
Asset Limits $40,000 individual
ME

Limited to dementia caregivers; capped funding.

Benefits
In-home respite (up to 30 days/year) Adult day care (~$60/day)

MaineCare Long-Term Care (Nursing Facility Services)

MaineCare Nursing Facility Services

Age 65+
General Maine resident, Medicaid-eligible, requires nursing home-level care.
Income Limits (2025) $943/month (individual); must be less than nursing home cost for full coverage.
Asset Limits $2,000 (individual), $3,000 (couple); spousal allowance up to $155,356.
ME

Home equity limit of $636,000; estate recovery applies post-55.

Benefits
24/7 nursing care Meals Therapy Medications (hours unlimited per medical need)

Consumer-Directed Home-Based Care (CDHBC)

Maine Consumer-Directed Personal Assistance Services

Age 65+
General Maine resident, needs ADL assistance, income/asset limits apply.
Income Limits (2025) ~$2,000/month varies by AAA
Asset Limits Not strict; prioritizes low-income.
ME

Available through five Area Agencies on Aging.

Benefits
Personal care (20-30 hours/week) PERS Adult day care Home modifications

Home Accessibility and Repair Program

Maine State Housing Authority Home Accessibility and Repair

Age 62+
General Maine resident, homeowner, low-income.
Income Limits (2025) ~$34,000/year individual, 80% AMI, varies by county
Asset Limits Not specified; focus on income.
ME

Includes Elderly Hardship Grants for urgent repairs.

Benefits
Wheelchair ramps Grab bars Roof repairs (up to $20,000/project)

Program of All-Inclusive Care for the Elderly (PACE)

Maine PACE (not widely available yet)

Age 55+
General Maine resident, Medicare/Medicaid-eligible, nursing home-level care need, community-safe.
Income Limits (2025) No strict limit; Medicaid portion $2,901/month max.
Asset Limits $2,000 (individual) for Medicaid portion.
ME

Pilot phase; check availability with DHHS.

Benefits
Medical care Personal care Day center Transportation Respite (tailored to need)

Veterans Aid and Attendance (A&A) Benefit

Maine VA Aid and Attendance

Age
General Wartime veteran/spouse, age 65+ or disabled, needs ADL help, Maine resident.
Income Limits (2025) Net income minus medical expenses < $1,984/month individual with A&A
Asset Limits $155,356 net worth limit
ME

High veteran population in rural areas.

Benefits
Cash benefit ($1,478-$2,471/month, varies by status) for care costs

Medicare Savings Programs (MSP)

Maine Medicare Savings Programs

Age 65+
General Maine resident, Medicare Part A/B enrollee.
Income Limits (2025) $2,014/month (individual, QMB), $2,706/month (SLMB/QI).
Asset Limits $9,090 (individual), $13,630 (couple).
ME

Includes Qualified Medicare Beneficiary (QMB), Specified Low-Income Medicare Beneficiary (SLMB), and Qualified Individual (QI).

Benefits
Covers Medicare premiums (up to $174.70/month Part B) Co-pays Deductibles

Frequently Asked Questions about Marshwood Center

Is Marshwood Center in a walkable area?

Marshwood Center has a walk score of 21. Car-dependent. Most errands require a car, with limited nearby walkable options.

What is the occupancy rate at Marshwood Center?

Marshwood Center's occupancy is 89.0%.

Does Marshwood Center operate as a for-profit or non-profit?

Marshwood Center is registered as a for-profit in ME.

Are there photos of Marshwood Center?

Yes — there are 9 photos of Marshwood Center in the photo gallery on this page.

What is the address of Marshwood Center?

Marshwood Center is located at 33 Roger St, Lewiston, ME 04240.

What is the phone number of Marshwood Center?

(207) 784-0108 will put you in contact with the team at Marshwood Center.

Is Marshwood Center Medicare or Medicaid certified?

Yes — Marshwood Center is a CMS-certified provider of Medicare and Medicaid.

Guides for Better Senior Living

Care Cost Calculator: See Prices in Your Area

Nursing Home Data Explorer

Don’t Wait Too Long: 7 Red Flag Signs Your Parent Needs Assisted Living Now

The True Cost of Assisted Living in 2025 – And How Families Are Paying For It

Understanding Senior Living Costs: Pricing Models, Discounts & Financial Assistance