


Total staff
219
Employees
214
Contractors
5
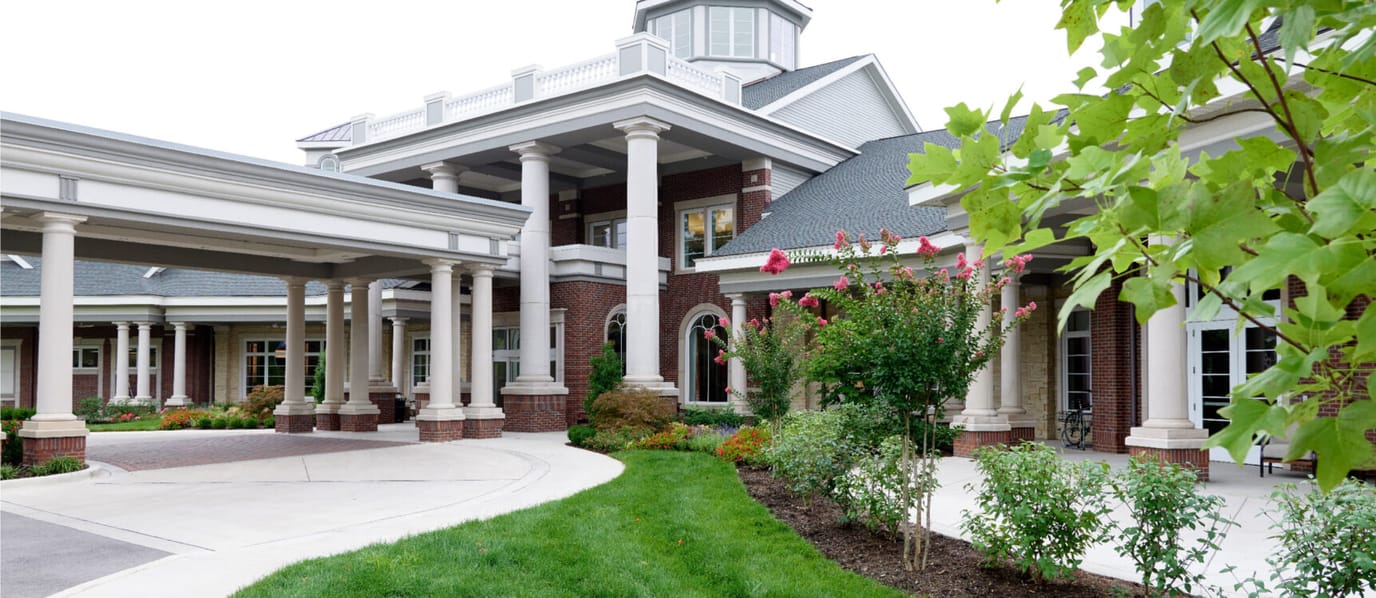
Masonic Homes Kentucky is a 136-bed nursing home in Louisville, tucked into a very walkable pocket of the city. Walk Score puts it at 72, so a lot of daily errands are doable on foot. University of Louisville Medical Center sits close by too, which matters when extra healthcare access comes up.
Occupancy runs around 71.5%, and the average stay lands at 84 days. That number tells its own story: this is a place built for both short recovery stays and longer-term nursing care, not just one or the other. Someone bouncing back from surgery and someone settling in for months could both be down the same hallway.
Nursing hours land at about 5 hours and 12 minutes per resident each day, split across RNs, LPNs, and nurse aides. Rehab services run alongside that daily care, which matters most for residents working to rebuild strength or mobility after a hospital stay, an injury, or surgery.
Paying for care has a few routes here: Medicare, Medicaid, and private pay are all accepted, so families are not boxed into one option.
The facts point toward a facility built for range; there is enough daily nursing support and rehab access to serve someone who needs a short recovery window, and enough structure to support someone settling in for a longer stay. Either way, the staffing and rehab combination gives residents a real shot at recovery or steady, ongoing care.
| Staff type | Hours / Day / Resident | vs state avg |
|---|---|---|
|
Registered Nurse (RN)
| 39m per day | ▼ 15% State avg: 46m per day · National avg: 41m per day |
|
LPN / LVN
| 1h 22m per day | ▲ 70% State avg: 48m per day · National avg: 52m per day |
|
Nurse Aide
| 3h 1m per day | ▲ 26% State avg: 2h 24m per day · National avg: 2h 20m per day |
|
Weekend Total Nursing
| 4h 32m per day | ▲ 28% State avg: 3h 32m per day · National avg: 3h 27m per day |
|
Physical Therapist
| 7m per day | ▲ 72% State avg: 4m per day · National avg: 4m per day |
|
Weekend RN
| 31m per day | ■ Avg State avg: 31m per day · National avg: 29m per day |
Reporting period: October 1 – December 31, 2025 (Q4 2025). Source: CMS Payroll-Based Journal report.
Manages medical care and health needs.
Assists with medical care and medications.
Helps with daily care and mobility.
Total hours from contractors
1,023 contractor hours this quarter
| Certified Nursing Assistant | 101 | 0 | 101 | 36,113 | 92 | 100% | 9.5 |
| Licensed Practical Nurse | 37 | 0 | 37 | 12,337 | 92 | 100% | 9.7 |
| Registered Nurse | 26 | 0 | 26 | 6,883 | 92 | 100% | 9.2 |
| RN Director of Nursing | 8 | 0 | 8 | 4,000 | 75 | 82% | 8.3 |
| Other Dietary Services Staff | 4 | 0 | 4 | 1,747 | 80 | 87% | 6.8 |
| Respiratory Therapy Technician | 7 | 0 | 7 | 1,324 | 79 | 86% | 6.4 |
| Speech Language Pathologist | 8 | 0 | 8 | 1,316 | 80 | 87% | 6.5 |
| Dental Services Staff | 2 | 0 | 2 | 992 | 65 | 71% | 8 |
| Physical Therapy Assistant | 5 | 0 | 5 | 933 | 71 | 77% | 7.1 |
| Feeding Assistant | 0 | 2 | 2 | 811 | 63 | 68% | 7.6 |
| Qualified Social Worker | 3 | 0 | 3 | 732 | 67 | 73% | 5.9 |
| Physical Therapy Aide | 5 | 0 | 5 | 727 | 70 | 76% | 7.2 |
| Occupational Therapy Aide | 2 | 0 | 2 | 617 | 62 | 67% | 7 |
| Administrator | 1 | 0 | 1 | 528 | 66 | 72% | 8 |
| Nurse Practitioner | 1 | 0 | 1 | 528 | 66 | 72% | 8 |
| Dietitian | 1 | 0 | 1 | 488 | 61 | 66% | 8 |
| Mental Health Service Worker | 1 | 0 | 1 | 480 | 60 | 65% | 8 |
| Clinical Nurse Specialist | 2 | 0 | 2 | 360 | 46 | 50% | 7.8 |
| Medical Director | 0 | 1 | 1 | 93 | 26 | 28% | 3.6 |
| Occupational Therapy Assistant | 0 | 1 | 1 | 65 | 60 | 65% | 1.1 |
| Other Physician | 0 | 1 | 1 | 54 | 31 | 34% | 1.7 |
Includes penalties issued in 2024
Federal penalties imposed by CMS for regulatory violations, including civil money penalties (fines) and denials of payment for new Medicare/Medicaid admissions.
Source: CMS Penalties Database (Data as of Jan 2026)
Kentucky average: $63K
Kentucky average: 2.3
Kentucky average: 0.3
Penalties are imposed by CMS for violations of federal nursing home regulations.
2 penalties in the past 3 years
Multiple penalties were reported in the last 3 years.
Last updated: Jan 2026
These measures show how residents usually do over time at this home, based on health outcomes and preventive care.
Kentucky average: 10.5
Kentucky average: 18.9
Kentucky average: 16.8%
Kentucky average: 19.6%
Kentucky average: 20.5%
Kentucky average: 3.8%
Kentucky average: 5.8%
Kentucky average: 1.9%
Kentucky average: 6.8%
Kentucky average: 14.3%
Kentucky average: 15.6%
Kentucky average: 93.9%
Kentucky average: 96.2%
Kentucky average: 83.7%
Kentucky average: 1.9%
Kentucky average: 83.6%
Quality measures are calculated from Minimum Data Set (MDS) assessments. For most measures, lower percentages indicate better care quality.
58% of new residents, usually for short-term rehab.
41% of new residents, often for short stays.
1% of new residents, often for long-term daily care.
Source: CMS Long-Term Care Facility Characteristics (Data as of Jan 2026)
Residents meet regularly to discuss policies, care quality, and activities
Part of a Continuing Care Retirement Community offering multiple care levels
Organized group of residents that meets regularly to discuss facility policies, quality of life, and activities.
Data sourced from CMS Long-Term Care Facility Characteristics quarterly report. Payer mix reflects the current resident census by primary payment source.
Historical financial and operational data for Masonic Homes Kentucky from 2011–2023, based on CMS SNF Cost Reports.
Key figures below are for fiscal year ending in 12/2023.
Based on CMS SNF Cost Report for fiscal year ending in 12/2023.
Pets Allowed
Building Type: Two-story
Most residents typically stay for a few weeks or months before returning home or moving on.
Most new residents arrive under Medicare (58% of admissions), and a typical Medicare stay runs around 23 days.
Coverage residents most often arrive under.
Coverage residents most often leave under.
What do you like most about living here?
Mira Lea
Are there enough caregivers to handle the residents' needs, especially during emergencies?
No
Are the common areas pleasant and comfortable for socializing or relaxing?
Yes
How do you feel about the level of social interaction available with other residents?
How was the units offered in this community?
Do you feel safe living in this community?
How well do you think the community handles emergencies or unexpected events?
Are there any hidden fees or unexpected charges?
Would you recommend this community to others looking for senior living options?
My mother went into Mira Lea the "active lifestyle " community in appx 2013. Mom passed in 2023. Just now can I address a review
Food was great for the first 5 years 2013 -2018, then went very downhill to a ditch.
How would you rate the quality and variety of the meals? (1-5)
2
Are special diets handled well?
No
Is the dining schedule flexible enough to meet your preferences?
No
Supposedly the apartment would generate some income after her death. But as of now 3 YEARS LATER January 2026 THIS APARTMENT STILL HASN'T SOLD
I've emailed and even got a realtor and lawyer involved.
The Masonic Home sells. "Contract of care" NOT REAL ESTATE. SO NO RECOURSE IS AVAILABLE
BE VERY WARY OF MASONIC HOMES and all associated "real estate"
Their promises DO NOT MATCH REALITY
At present am trying to get media involved to spread the word.
Is there anything you wish you knew before moving in?
![]() 5.6 miles from city center
5.6 miles from city center
![]() Estimated distance in miles from Louisville's city center to Masonic Homes Kentucky's address, calculated via Google Maps.
Estimated distance in miles from Louisville's city center to Masonic Homes Kentucky's address, calculated via Google Maps.
Add your location
The information below is reported by the Kentucky Cabinet for Health and Family Services, Office of Inspector General.
| Westport Place Health Campus | NH AL RC SNF | Louisville | 22
Facility
22
KY AVG
82
Rank
#325 / 341 | - | - | 3.44
Facility
3.44
KY AVG
3.75
Rank
#76 / 191 | +46% | -8% | $0
Facility
$0
KY AVG
$65.4k
Rank
#1 / 197 | 5
Facility
5
KY AVG
13.5
Rank
#20 / 193 | 2.5
Facility
2.5
KY AVG
4.4
Rank
#31 / 193 | - | 55 | - |
47
Facility
47
KY AVG
41
Rank
#183 / 423 | Lauren Powers | $11.5MFiscal year ending 12/2023
Facility
$11.5MFiscal year ending 12/2023
KY AVG
$10.5M
Rank
#51 / 194 | $5.9MFiscal year ending 12/2023
Facility
$5.9MFiscal year ending 12/2023
KY AVG
$4.0M
Rank
#46 / 194 | 50.9%Fiscal year ending 12/2023
Facility
50.9%Fiscal year ending 12/2023
KY AVG
40.7%
Rank
#85 / 194 | 185466 | ||||
| Signature HealthCARE at Rockford Rehab & Wellness Center | NH PC RC SNF | Louisville | 110
Facility
110
KY AVG
82
Rank
#70 / 341 |
90.0%
Facility
90.0%
KY AVG
84.3
Rank
#72 / 168 | +7% | 3.29
Facility
3.29
KY AVG
3.75
Rank
#93 / 191 | +22% | -12% | $0
Facility
$0
KY AVG
$65.4k
Rank
#1 / 197 | 11
Facility
11
KY AVG
13.5
Rank
#89 / 193 | 3.7
Facility
3.7
KY AVG
4.4
Rank
#81 / 193 | 3 | 99 | - |
38
Facility
38
KY AVG
41
Rank
#231 / 423 | LP Louisville Quinn Drive, LLC | $10.2MFiscal year ending 12/2023
Facility
$10.2MFiscal year ending 12/2023
KY AVG
$10.5M
Rank
#74 / 194 | $4.3MFiscal year ending 12/2023
Facility
$4.3MFiscal year ending 12/2023
KY AVG
$4.0M
Rank
#80 / 194 | 42.5%Fiscal year ending 12/2023
Facility
42.5%Fiscal year ending 12/2023
KY AVG
40.7%
Rank
#113 / 194 | 185311 | ||||
| The Springs at Stony Brook | NH ADC AL IL MC SNF | Louisville | 106
Facility
106
KY AVG
82
Rank
#79 / 341 | - | - | 3.30
Facility
3.30
KY AVG
3.75
Rank
#93 / 191 | -27% | -12% | $0
Facility
$0
KY AVG
$65.4k
Rank
#1 / 197 | 3
Facility
3
KY AVG
13.5
Rank
#7 / 193 | 3.0
Facility
3.0
KY AVG
4.4
Rank
#48 / 193 | - | 66 | - |
28
Facility
28
KY AVG
41
Rank
#292 / 423 | Hurstbourne Healthcare, LLC | $11.1MFiscal year ending 12/2023
Facility
$11.1MFiscal year ending 12/2023
KY AVG
$10.5M
Rank
#71 / 194 | $6.4MFiscal year ending 12/2023
Facility
$6.4MFiscal year ending 12/2023
KY AVG
$4.0M
Rank
#44 / 194 | 57.2%Fiscal year ending 12/2023
Facility
57.2%Fiscal year ending 12/2023
KY AVG
40.7%
Rank
#46 / 194 | 185485 | ||||
| Nazareth Home Clifton | NH IL MC SNF | Louisville (Clifton Heights) | 144
Facility
144
KY AVG
82
Rank
#24 / 341 | - | - | 4.23
Facility
4.23
KY AVG
3.75
Rank
#26 / 191 | +1% | +13% | $0
Facility
$0
KY AVG
$65.4k
Rank
#1 / 197 | 17
Facility
17
KY AVG
13.5
Rank
#134 / 193 | 5.7
Facility
5.7
KY AVG
4.4
Rank
#146 / 193 | - | 105 | A+ |
36
Facility
36
KY AVG
41
Rank
#244 / 423 | Greg Cobb | $13.3MFiscal year ending 08/2024
Facility
$13.3MFiscal year ending 08/2024
KY AVG
$10.5M
Rank
#25 / 194 | $8.0MFiscal year ending 08/2024
Facility
$8.0MFiscal year ending 08/2024
KY AVG
$4.0M
Rank
#29 / 194 | 59.8%Fiscal year ending 08/2024
Facility
59.8%Fiscal year ending 08/2024
KY AVG
40.7%
Rank
#88 / 194 | 185442 | ||||
| Masonic Homes Kentucky | NH AL HC IL MC SNF | Louisville (Crescent Hill) | 136
Facility
136
KY AVG
82
Rank
#33 / 341 |
95.4%
Facility
95.4%
KY AVG
84.3
Rank
#26 / 168 | +13% | 5.19
Facility
5.19
KY AVG
3.75
Rank
#12 / 191 | +11% | +38% | $14.9k
Facility
$14.9k
KY AVG
$65.4k
Rank
#159 / 197 | 19
Facility
19
KY AVG
13.5
Rank
#151 / 193 | 6.3
Facility
6.3
KY AVG
4.4
Rank
#157 / 193 | 4 | 130 | - |
72
Facility
72
KY AVG
41
Rank
#42 / 423 | Harold Armstrong | $23.8MFiscal year ending 12/2023
Facility
$23.8MFiscal year ending 12/2023
KY AVG
$10.5M
Rank
#5 / 194 | $13.8MFiscal year ending 12/2023
Facility
$13.8MFiscal year ending 12/2023
KY AVG
$4.0M
Rank
#3 / 194 | 58.1%Fiscal year ending 12/2023
Facility
58.1%Fiscal year ending 12/2023
KY AVG
40.7%
Rank
#70 / 194 | 185388 |
Masonic Homes Kentucky is located in Louisville, Kentucky.
Here are the financial assistance programs available to residents in Kentucky.
Masonic Homes Kentucky is in the Crescent Hill neighborhood.
Masonic Homes Kentucky has a walk score of 72. Very walkable. Most errands can be accomplished on foot, and many essentials are within a short walk.
Masonic Homes Kentucky's occupancy is 71.5%.
Yes, Masonic Homes Kentucky allows residents to bring their pets.
Masonic Homes Kentucky is registered as a non-profit.
Yes — there are 4 photos of Masonic Homes Kentucky in the photo gallery on this page.
Masonic Homes Kentucky is located at 3701 Frankfort Ave, Louisville, KY 40207.
Care Cost Calculator: See Prices in Your Area
Nursing Home Data Explorer
Don’t Wait Too Long: 7 Red Flag Signs Your Parent Needs Assisted Living Now
The True Cost of Assisted Living in 2025 – And How Families Are Paying For It
Understanding Senior Living Costs: Pricing Models, Discounts & Financial Assistance


