McCrite Plaza Topeka
Nursing Home, Assisted Living, Home Care, Independent Living & Memory Care · Topeka, KS
CMS overall rating Info CMS (the Centers for Medicare & Medicaid Services) is the federal agency that rates nursing home quality. Its Overall Rating runs from 1 to 5 stars, combining health inspections, staffing, and quality measures, with inspections weighted most heavily.

McCrite Plaza Topeka

Nursing Home, Assisted Living, Home Care, Independent Living & Memory Care · Topeka, KS
CMS overall rating Info CMS (the Centers for Medicare & Medicaid Services) is the federal agency that rates nursing home quality. Its Overall Rating runs from 1 to 5 stars, combining health inspections, staffing, and quality measures, with inspections weighted most heavily.
Calculator: See prices in your area
McCrite Plaza Topeka accepts Medicare, Medicaid, and private pay.

Overview of Mccrite Plaza Topeka

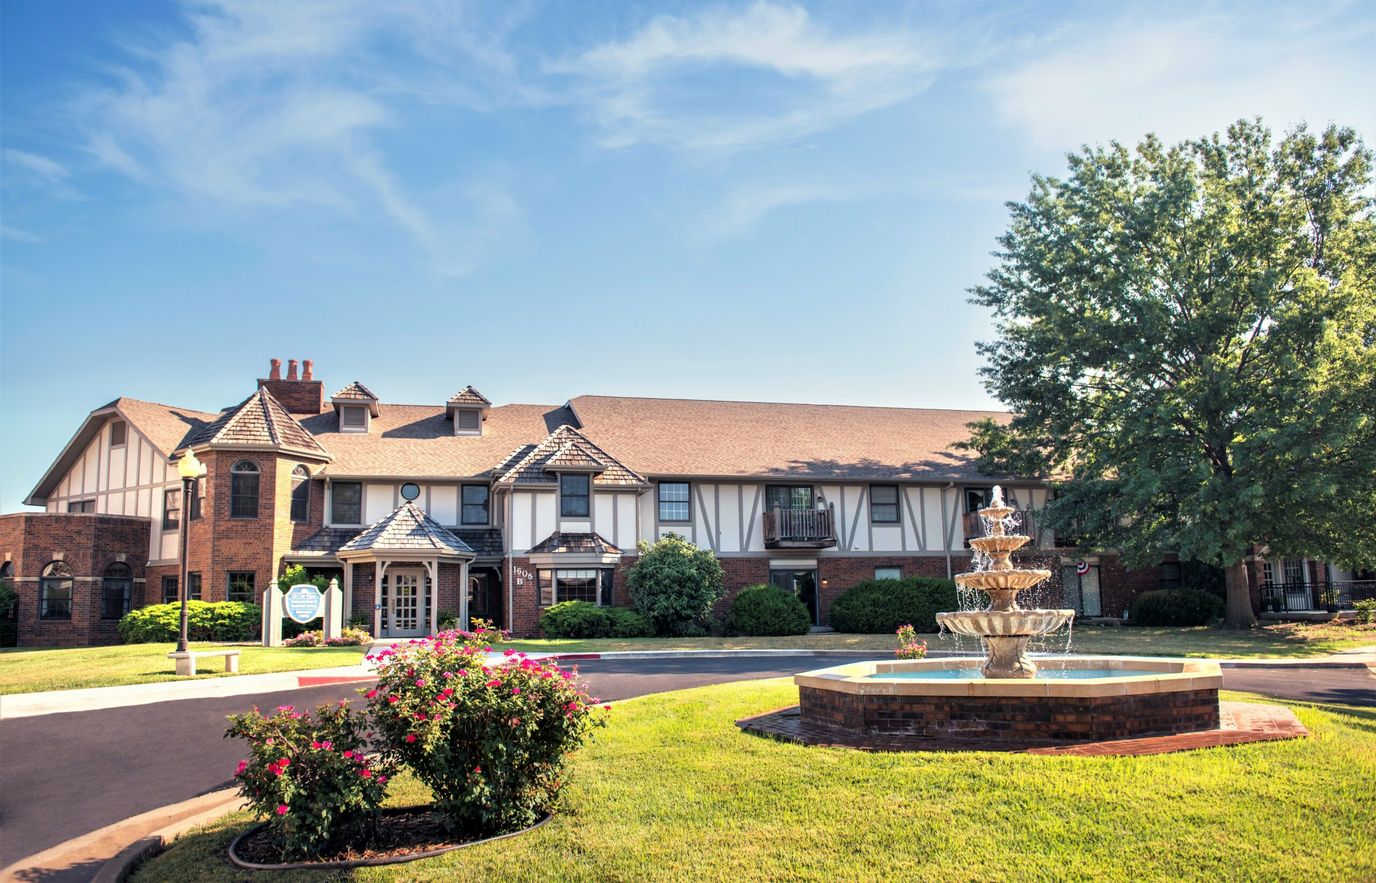
McCrite Plaza dedicates itself to ensuring the best quality of service to the seniors while equally gaining their independence. The senior living community offers independent living, assisted living, and memory care living options. Residents of all housing types have access to personal care that aims to enhance their quality of life.
McCrite ensures that its residents thrive in an environment that puts them first.
Specializing in independent living, assisted living, memory care, skilled nursing, and rehabilitation– offered an array of comprehensive services that cater to different levels of care. Residents of short-term rehabilitation and long-term care facilities are eligible for a list of stimulating and results-driven activities that focus on recovery.

Quality ratings

Measured by Centers for Medicare & Medicaid Services (CMS)

Overall rating Info The Overall CMS Rating combines results from health inspections, staffing levels and quality measures. Health inspections carry the most weight. Staffing and quality scores can increase or decrease the final rating based on performance compared to state and national standards.
▲ 72.9% Above KS avg. ▲ 72.9% Above KS avg.KS average: 2.9Click the badge to see the full State ranking.Click here to see the full State ranking.
Health Inspection Info Based on the results of the facility's three most recent standard inspections and any complaint investigations. CMS reviews the number, scope, and severity of deficiencies, with more recent findings weighted more heavily.
▲ 44.8% Above KS avg. ▲ 44.8% Above KS avg.KS average: 2.8Click the badge to see the full State ranking.Click here to see the full State ranking.
Staffing Info Measures average nursing staff hours per resident per day, including Registered Nurses (RNs) and total nursing staff. Ratings are adjusted based on the level of care residents require and are compared to state and national benchmarks.
▲ 15.7% Above KS avg. ▲ 15.7% Above KS avg.KS average: 3.5Click the badge to see the full State ranking.Click here to see the full State ranking.
Quality Measures Info Based on clinical and physical health indicators reported to CMS, such as hospital readmissions, falls, pressure ulcers, and improvements in mobility. These measures reflect how well residents' health needs are being managed.
▲ 61.7% Above KS avg. ▲ 61.7% Above KS avg.KS average: 3.1Click the badge to see the full State ranking.Click here to see the full State ranking.

Staffing hours breakdown

Info Daily nursing hours per resident by staff type, reported to CMS. Higher is generally better — compare this facility to state and national averages to see where staffing stands.

Hours per resident per day — compared to Kansas state averages

Total nursing care / resident Info Total adjusted nursing hours per resident per day, combining RN, LPN, and aide time. CMS adjusts this for case-mix so facilities can be fairly compared.
4h 52m per day
This facility Kansas avg (4h 38m per day)
vs Kansas avg
+5%

1 of 6 metrics below state avg

Standout metric LPN / LVN is +35% above state avg
Staff typeHours / Day / Residentvs state avg
Registered Nurse (RN) Info RNs hold the highest nursing license and can assess residents, interpret test results, and direct care plans. More RN hours per day often signals stronger clinical oversight and faster response to health changes. 43m per day ■ Avg State avg: 42m per day · National avg: 41m per day
LPN / LVN Info Licensed Practical Nurses (LPNs) or Licensed Vocational Nurses (LVNs) deliver routine hands-on care — medication administration, wound dressing, and monitoring vital signs. They work under RN supervision and make up a large share of daily bedside care. 54m per day ▲ 35% State avg: 40m per day · National avg: 52m per day
Nurse Aide Info Certified Nurse Aides (CNAs) provide the most direct day-to-day assistance: bathing, dressing, feeding, and mobility. Nurse aide hours are typically the largest staffing category and directly affect residents' quality of life. 3h 19m per day ▲ 23% State avg: 2h 41m per day · National avg: 2h 20m per day
Weekend Total Nursing Info Combined nursing hours (RN + LPN + Nurse Aide) per resident per day on weekends. Staffing often drops on weekends — this figure reveals whether the facility maintains adequate coverage outside of weekday hours. 4h 32m per day ▲ 25% State avg: 3h 38m per day · National avg: 3h 27m per day
Physical Therapist Info Hours per resident per day provided by licensed Physical Therapists (PTs) or PT Assistants. PT services help residents recover mobility after injury or illness and are especially important for post-acute (short-stay) rehabilitation. 3m per day ▲ 9% State avg: 2m per day · National avg: 4m per day
Weekend RN Info Registered nurse hours specifically on weekends. Facilities sometimes reduce RN presence on Saturdays and Sundays — a low weekend RN figure compared to weekday hours can indicate reduced clinical oversight when most administrative staff are absent. 25m per day ▼ 15% State avg: 29m per day · National avg: 29m per day

Capacity and availability

This home usually has availability

Lower occupancy than the Kansas average: 79.5%
Occupancy rate
73.7%
Avg. Length of Stay
92 days
Bed community size
80-bed community Rank #59 / 224Bed count — State benchmarkedThis home is ranked 59th out of 224 homes in Kansas. Shows this facility's certified or reported bed count compared to other Kansas facilities. Larger communities may offer more amenities, programs, and on-site services for residents and families.Rankings are based only on facilities in Kansas that report data for that category. Facilities without available data are excluded from the ranking.Click the rank badge to see the full State ranking.Click here to see the full State ranking.
A larger shared setting that may offer more common spaces and organized community services.
Walk Score
Walk Score: 40 / 100 Rank #220 / 363Walk Score — State benchmarkedThis home is ranked 220th out of 363 homes in Kansas. Shows how walkable this facility's neighborhood is compared to the average Walk Score across Kansas facilities. Higher scores benefit residents, families, and staff.Rankings are based only on facilities in Kansas that report data for that category. Facilities without available data are excluded from the ranking.Click the rank badge to see the full State ranking.Click here to see the full State ranking.
Somewhat walkable. A few nearby services may be reachable on foot, but most trips require transportation.

Therapy & Rehabilitation

1 service
Rehabilitation Services

Additional Policies & Features

Minimum Age55

Amenities & Lifestyle

Activities
Specific ProgramsAssisted Living Plus, McCrite Plaza Social Club

Contact McCrite Plaza Topeka

Staffing Data

Reporting period: October 1 – December 31, 2025 (Q4 2025). Source: CMS Payroll-Based Journal report.

Total staff 249
Employees 83
Contractors 166
Staff to resident ratio 4.37 : 1
95% more staff per resident than Kansas average
Kansas average ratio: 2.24 : 1 Kansas average ratio: 2.24 : 1See full Kansas ranking
Avg staff/day 50
Average shift 7.4 hours
0% compared with Kansas average
Kansas average: 7.7 hours Kansas average shift: 7.7 hoursSee full Kansas ranking
Total staff hours (quarter) 34,131

Nursing staff breakdown

Q4 2025 · Oct 1 – Dec 31 More info This data comes from the CMS Payroll-Based Journal report covering October 1 – December 31, 2025.
Registered Nurse

Manages medical care and health needs.

RN Staff Info 27 total: 8 full-time employees and 19 contractors. 27
Average shift length Info Average shift length. Calculated as total hours divided by days worked and average staff per day. 8.3 hours
Licensed Practical Nurse

Assists with medical care and medications.

LPN Staff Info 45 total: 8 full-time employees and 37 contractors. 45
Average shift length Info Average shift length. Calculated as total hours divided by days worked and average staff per day. 7.8 hours
Certified Nursing Assistant

Helps with daily care and mobility.

CNA Staff Info 124 total: 41 full-time employees and 83 contractors. 124
Average shift length Info Average shift length. Calculated as total hours divided by days worked and average staff per day. 7.6 hours

Contractor staffing

Q4 2025 · Oct 1 – Dec 31 More info This data comes from the CMS Payroll-Based Journal report covering October 1 – December 31, 2025.

Total hours from contractors

21.4%

7,315 contractor hours this quarter

Certified Nursing Assistant: 83 Licensed Practical Nurse: 37 Registered Nurse: 19 Speech Language Pathologist: 5 Respiratory Therapy Technician: 5 Physical Therapy Aide: 4 Physical Therapy Assistant: 4 Medication Aide/Technician: 2 Qualified Social Worker: 2 Medical Director: 2 Occupational Therapy Assistant: 1 Occupational Therapy Aide: 1 Nurse Aide in Training: 1

Staff by category

Q4 2025 · Oct 1 – Dec 31 More info This data comes from the CMS Payroll-Based Journal report covering October 1 – December 31, 2025.
Certified Nursing Assistant418312413,30992100%7.6
Medication Aide/Technician142165,40792100%7.7
Licensed Practical Nurse837454,71592100%7.8
Registered Nurse819272,65092100%8.3
Dental Services Staff3031,1597885%7.2
Speech Language Pathologist0551,0746874%5.9
Clinical Nurse Specialist2029526470%7.7
Physical Therapy Aide0447566368%6.5
Other Dietary Services Staff2027067379%8.1
Nurse Practitioner1014966267%8
Dietitian1014966267%8
Administrator1014565863%7.9
Mental Health Service Worker1014485661%8
Qualified Social Worker0223835863%6.4
Physical Therapy Assistant0443377278%4.7
RN Director of Nursing1013284145%8
Respiratory Therapy Technician0552556672%3.6
Occupational Therapy Aide0111031213%8.5
Medical Director022543235%1.5
Occupational Therapy Assistant0114189%5.1
Nurse Aide in Training011811%7.5
124 Certified Nursing Assistant
% of Days 100%
16 Medication Aide/Technician
% of Days 100%
45 Licensed Practical Nurse
% of Days 100%
27 Registered Nurse
% of Days 100%
3 Dental Services Staff
% of Days 85%
5 Speech Language Pathologist
% of Days 74%
2 Clinical Nurse Specialist
% of Days 70%
4 Physical Therapy Aide
% of Days 68%
2 Other Dietary Services Staff
% of Days 79%
1 Nurse Practitioner
% of Days 67%
1 Dietitian
% of Days 67%
1 Administrator
% of Days 63%
1 Mental Health Service Worker
% of Days 61%
2 Qualified Social Worker
% of Days 63%
4 Physical Therapy Assistant
% of Days 78%
1 RN Director of Nursing
% of Days 45%
5 Respiratory Therapy Technician
% of Days 72%
1 Occupational Therapy Aide
% of Days 13%
2 Medical Director
% of Days 35%
1 Occupational Therapy Assistant
% of Days 9%
1 Nurse Aide in Training
% of Days 1%

Penalties and fines

Includes penalties issued in 2025

Federal penalties imposed by CMS for regulatory violations, including civil money penalties (fines) and denials of payment for new Medicare/Medicaid admissions.

Source: CMS Penalties Database (Data as of Jan 2026)

Total fines amount $9K
79% lower than Kansas average

Kansas average: $44K

Number of fines 1
59% fewer fines than Kansas average

Kansas average: 2.4

Payment Denials Info Serious action where Medicare and/or Medicaid temporarily stops payments for new residents until issues are fixed. 0
100% fewer payment denials than Kansas average

Kansas average: 0.3

Fines amount comparison
This facility $9K
Kansas average $44K
Penalty History

Penalties are imposed by CMS for violations of federal nursing home regulations.

1 penalty in the past 3 years

Jan 29, 2025 · $9K

Civil Money Penalty Info Fines imposed for noncompliance, which can be assessed per day or per instance of violation. Jan 29, 2025
$9K

Last updated: Jan 2026

Quality of care over time

These measures show how residents usually do over time at this home, based on health outcomes and preventive care.

High-risk clinical events score Info A composite score based on pressure ulcers, falls with injury, weight loss, walking ability decline, and activities of daily living decline. 6.8
36% better than Kansas average

Kansas average: 10.5

Functional decline score Info A composite score based on activities of daily living decline, walking ability decline, and incontinence. 21.4
In line with Kansas average

Kansas average: 20.7

Long-stay resident measures
Need for Help with Daily Activities Increased Info Percent of long-stay residents whose need for help with daily activities has increased 9.8%
49% better than Kansas average

Kansas average: 19.0%

Walking Ability Worsened Info Percent of long-stay residents whose ability to move independently worsened 17.1%
12% better than Kansas average

Kansas average: 19.4%

Low Risk Residents with Bowel/Bladder Incontinence Info Percent of low risk long-stay residents who lose control of their bowels or bladder 37.2%
57% worse than Kansas average

Kansas average: 23.8%

Falls with Major Injury Info Percent of long-stay residents experiencing one or more falls with major injury 2.4%
45% better than Kansas average

Kansas average: 4.4%

High Risk Residents with Pressure Ulcers Info Percent of long-stay high risk residents with pressure ulcers 2.5%
47% better than Kansas average

Kansas average: 4.6%

Urinary Tract Infection Info Percent of long-stay residents with a urinary tract infection 4.4%
39% worse than Kansas average

Kansas average: 3.1%

Lost Too Much Weight Info Percent of long-stay residents who lose too much weight 2.1%
60% better than Kansas average

Kansas average: 5.1%

Depressive Symptoms Info Percent of long-stay residents who have depressive symptoms 5.1%
In line with Kansas average

Kansas average: 5.2%

Antipsychotic Use Info Percent of long-stay residents who received an antipsychotic medication 6.2%
64% better than Kansas average

Kansas average: 16.9%

Pneumococcal Vaccine Info Percent of long-stay residents assessed and appropriately given the pneumococcal vaccine 100.0%
9% better than Kansas average

Kansas average: 91.9%

Influenza Vaccine Info Percent of long-stay residents assessed and appropriately given the seasonal influenza vaccine 97.6%
In line with Kansas average

Kansas average: 95.5%

Short-stay resident measures
Pneumococcal Vaccine Info Percent of short-stay residents assessed and appropriately given the pneumococcal vaccine 88.1%
16% better than Kansas average

Kansas average: 75.6%

Antipsychotic medication increase Info Percent of short-stay residents who newly received an antipsychotic medication 0.0%
100% better than Kansas average

Kansas average: 2.2%

Influenza Vaccine Info Percent of short-stay residents assessed and appropriately given the seasonal influenza vaccine 77.6%
6% better than Kansas average

Kansas average: 73.5%

Breakdown by payment type

Medicare

62% of new residents, usually for short-term rehab.

Typical stay 1 - 2 months

Private pay

35% of new residents, often for short stays.

Typical stay 4 months

Medicaid

3% of new residents, often for long-term daily care.

Typical stay 1 years

Facility Characteristics

Source: CMS Long-Term Care Facility Characteristics (Data as of Jan 2026)

Total residents 57
Medicare
20
35.1% of residents
Medicaid
7
12.3% of residents
Private pay or other
30
52.6% of residents
Programs & Services
Residents Group

Residents meet regularly to discuss policies, care quality, and activities

Nurse Aide Training

State-approved Nurse Aide Training and Competency Evaluation Program on-site

CCRC

Part of a Continuing Care Retirement Community offering multiple care levels

Active Resident Council

Organized group of residents that meets regularly to discuss facility policies, quality of life, and activities.

Finances and operations

Based on CMS SNF Cost Report for fiscal year ending in 12/2023.

For-profit
Corporation
Net patient revenue Info Net patient revenue — what the home actually collects for resident care, after contractual allowances, bad debt and discounts are subtracted from its gross charges (CMS cost report, Worksheet G-3). It covers resident care only; money the home earns from other sources is shown separately as "Other income."
$9.0M
Net patient income Info Net patient income: net patient revenue minus the home's total operating expenses. A positive figure means it earns more from resident care than it spends to deliver it; a negative figure means the opposite. It excludes non-operating "other income."
$393.3K
For-profit Corporation
Net patient revenue Info Net patient revenue — what the home actually collects for resident care, after contractual allowances, bad debt and discounts are subtracted from its gross charges (CMS cost report, Worksheet G-3). It covers resident care only; money the home earns from other sources is shown separately as "Other income."
$9.0M
Net patient income Info Net patient income: net patient revenue minus the home's total operating expenses. A positive figure means it earns more from resident care than it spends to deliver it; a negative figure means the opposite. It excludes non-operating "other income."
$393.3K
Other income Info Money the home earns outside of resident care — such as investments, grants, rentals and other non-operating sources (CMS cost report, Worksheet G-3). It is tracked separately from net patient revenue: it is not part of that figure, and it is not included in net patient income.
$20.3K
Payroll costs Info Staff salaries plus wage-related costs — benefits such as payroll taxes, health insurance and retirement — from the home's own accounting records (CMS cost report, Worksheet A). Contract or agency labor is counted separately, under other operating costs.
$4.5M 49.7% of net patient revenue Info Payroll as a share of revenue: staff salaries and wage-related benefits divided by net patient revenue. A higher figure means more of each revenue dollar goes to staff pay.
Other operating costs Info Everything it costs to run the home apart from payroll — food, utilities, supplies, maintenance, contract labor and administration. Calculated as total operating expense minus payroll (staff salaries and wage-related benefits).
$4.1M
Total costs Info The home's total operating expense for the year — all the costs of running it, salaries included (CMS cost report, Worksheet G-3).
$8.6M

Who this home usually serves

TYPE OF STAY

Mostly short-term rehab stays

Most residents typically stay for a few weeks or months before returning home or moving on.

Most new residents arrive under Medicare (62% of admissions), and a typical Medicare stay runs around 1 - 2 months.

Admissions
278 total

Coverage residents most often arrive under.

Medicare 62%
Private pay 35%
Medicaid 3%
Discharges
233 total

Coverage residents most often leave under.

Medicare 65%
Private pay 32%
Medicaid 3%

Places of interest near McCrite Plaza Topeka

Address 4.0 miles from city center Info Estimated distance in miles from Topeka's city center to McCrite Plaza Topeka's address, calculated via Google Maps. — 2.22 miles to nearest hospital (Colmery-O'Neil Veterans' Administration Medical Center)

Calculate Travel Distance to McCrite Plaza Topeka

Add your location

Address

Compare Nursing Homes around Topeka

The information below is reported by the Kansas Department for Aging and Disability Services.

5 facilities compared · CMS & KS Dept. of Health data

Lexington Park Assisted Living
NH
AL
IL
Topeka (West Southwest 2)
60
Facility 60
KS AVG 69
Rank #94 / 224
83.9% +6%4.49 -50%-3%$082.7-80A+
60
Facility 60
KS AVG 46
Rank #99 / 363
Floyd Eaton$8.4M$4.3M51.3%175154
Brewster Place
NH
AL
IL
MC
RC
Topeka (South/Southeast 1)
141
Facility 141
KS AVG 69
Rank #10 / 224
74.3% -7%6.62 -64%+43%$0196.3-76A+
56
Facility 56
KS AVG 46
Rank #124 / 363
Melissa Reynolds$20.7M$13.6M65.8%175044
McCrite Plaza Topeka
NH
AL
HC
IL
MC
Topeka (South/Southeast 1)
80
Facility 80
KS AVG 69
Rank #59 / 224
73.7% -7%4.87 +6%+5%$9.1k184.5361-
40
Facility 40
KS AVG 46
Rank #220 / 363
Mccrite Real Estate Inc$9.0M$4.5M49.7%175171
Protected: Rolling Hills Retirement Community
NH
AL
RC
Topeka (Southwest Topeka)
70
Facility 70
KS AVG 69
Rank #83 / 224
60.9% -23%3.87 -30%-17%$14.2k448.8143-
33
Facility 33
KS AVG 46
Rank #248 / 363
Floyd C Eaton III Trust 2012$4.6M$2.3M51.1%175165
The Gardens at Aldersgate LLC
NH
HC
MC
PC
RC
Topeka (Downtown)
175
Facility 175
KS AVG 69
Rank #4 / 224
65.1% -18%3.72 +32%-20%$56.6k404.44114B-
78
Facility 78
KS AVG 46
Rank #25 / 363
-$19.2M$7.8M40.5%175340

Financial Assistance for
Nursing Home in Kansas

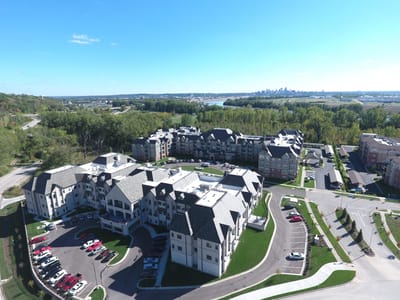
McCrite Plaza Topeka is located in Topeka, Kansas.
Here are the financial assistance programs available to residents in Kansas.

Get Financial aid guidance

Frail Elderly Waiver

Kansas Medicaid FE Waiver

Age 65+
General Kansas resident, Medicaid-eligible, nursing home- level care need.
Income Limits (2025) ~$2,829/month 300% FBR, individual
Asset Limits $2,000 (individual), $3,000 (couple).
KS

Requires care level assessment.

Benefits
Personal care (5-7 hours/day) Respite (240 hours/year) Adult day care (~$60/day) Home aides

Senior Care Act

Kansas SCA

Age 60+
General Kansas resident, at risk of nursing home.
Income Limits ~$1,800/month individual, varies
Asset Limits $2,000 individual
KS

Limited funding; waitlists common.

Benefits
In-home care (3-5 hours/week) Respite (up to 10 days/year) Homemaker services

Medicare Savings Program (MSP)

Kansas Medicare Savings Program

Age 65+ or disabled
General Kansas resident, Medicare Part A/B.
Income Limits (2025) ~$2,510/month (QMB), ~$3,380/month (SLMB), ~$3,598/month (QI)—individual.
Asset Limits $9,430 (individual), $14,130 (couple).
KS

Three tiers; no waitlist.

Benefits
Covers Part B premiums ($174.70/month) Deductibles ($240/year) Copays (~20%)

National Family Caregiver Support Program (NFCSP) Respite

Kansas NFCSP Respite Care

Age
General Caregivers of 60+ needing care or 55+ caregivers of others; Kansas resident; functional needs (2+ ADLs).
Income Limits (2025) Prioritizes ~$24,980/year (individual); no strict cap.
Asset Limits Not assessed; need-based.
KS

11 AAAs; prioritizes low-income, rural caregivers.

Benefits
Respite (4-6 hours/week or 5 days/year) Adult day care ($60/day) Caregiver training

VA Aid and Attendance (A&A) and Housebound Benefits

Kansas VA Aid and Attendance/Housebound

Age 65+ or disabled veteran/spouse
General Kansas resident, wartime service, need for ADL help (A&A) or homebound.
Income Limits (2025) Net income < ~$1,984/month (veteran with dependent, A&A); pension offsets income.
Asset Limits ~$155,356 net worth limit
KS

High veteran demand in rural/urban areas.

Benefits
Cash (~$1,433-$2,642/month veteran, ~$951-$1,318 spouse) for care costs (e.g., in-home, assisted living)

Frequently Asked Questions about McCrite Plaza Topeka

What neighborhood is McCrite Plaza Topeka in?

McCrite Plaza Topeka is in the South/Southeast 1 neighborhood.

Is McCrite Plaza Topeka in a walkable area?

McCrite Plaza Topeka has a walk score of 40. Somewhat walkable. A few nearby services may be reachable on foot, but most trips require transportation.

What is the occupancy rate at McCrite Plaza Topeka?

McCrite Plaza Topeka's occupancy is 73.7%.

Does McCrite Plaza Topeka operate as a for-profit or non-profit?

McCrite Plaza Topeka is registered as a for-profit.

Are there photos of McCrite Plaza Topeka?

Yes — there are 11 photos of McCrite Plaza Topeka in the photo gallery on this page.

What is the address of McCrite Plaza Topeka?

McCrite Plaza Topeka is located at 1608-1610 Sw 37Th St, Topeka, KS 66611.

What is the phone number of McCrite Plaza Topeka?

(785) 267-2960 will put you in contact with the team at McCrite Plaza Topeka.

Guides for Better Senior Living

Care Cost Calculator: See Prices in Your Area

Nursing Home Data Explorer

Don’t Wait Too Long: 7 Red Flag Signs Your Parent Needs Assisted Living Now

The True Cost of Assisted Living in 2025 – And How Families Are Paying For It

Understanding Senior Living Costs: Pricing Models, Discounts & Financial Assistance