


Morningside House of Friendship
Assisted Living, Hospice Care, Memory Care & Respite Care · Hanover, MD
Morningside House of Friendship
Assisted Living, Hospice Care, Memory Care & Respite Care · Hanover, MD
Overview of Morningside House of Friendship
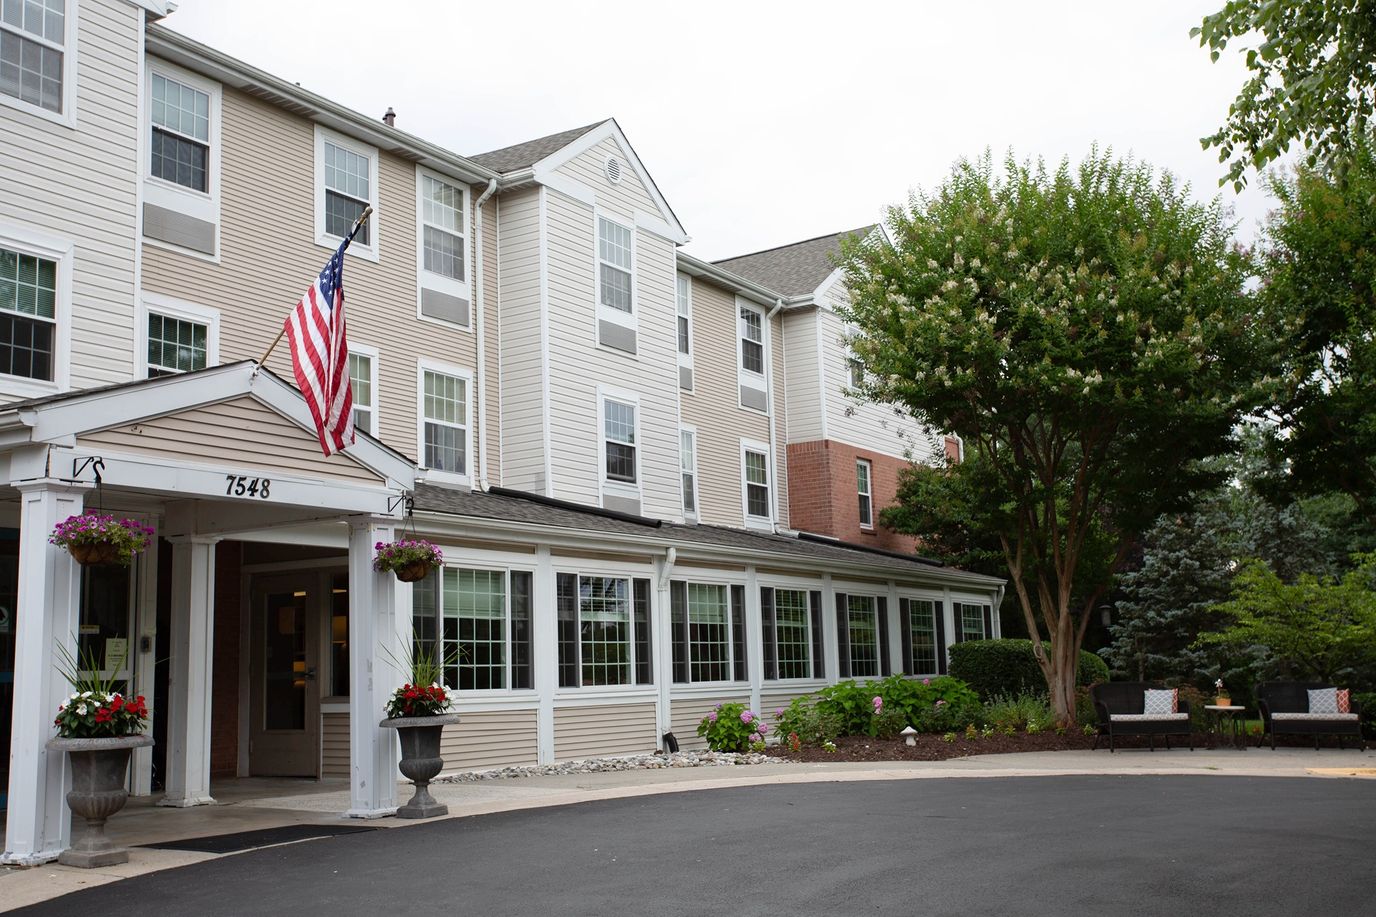
Delivering exceptional care for over 25 years, Morningside House of Friendship is a close-knit senior living community in Hanover, MD, that offers assisted living, memory care, short-term stays, and hospice coordination. Purposefully small and intimate, Morningside House of Friendship offers companion style, studio, one-bedroom, and a two bedroom residences that include housekeeping, meals, a full calendar of activities, and personalized physical care.
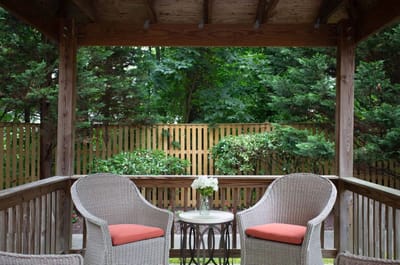
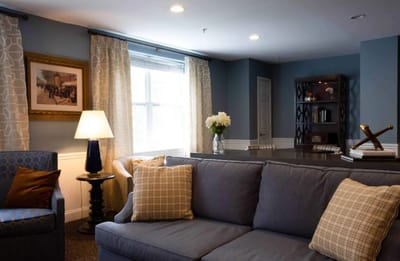
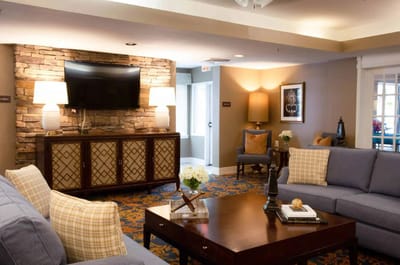
Above all, Morningside House of Friendship invites residents to become family. With engaged, long-serving caregivers, opportunities for resident involvement in committee and councils, a wide variety of amenities like free transportation, activity spaces, and 24/7 access to care staff, residents can live an engaged, active life of purpose and enjoyment. Sign up for a free tour and experience the Morningside difference for yourself.
103-bed community Rank #103 / 685Bed count — State benchmarkedThis home is ranked 103rd out of 685 homes in Maryland for bed count. Shows this facility's certified or reported bed count compared to other Maryland facilities. Larger communities may offer more amenities, programs, and on-site services for residents and families.Facilities with the same value for a metric share the same rank. Rankings are based only on facilities in Maryland that report data for that category. Facilities without available data are excluded from the ranking.Click the rank badge to see the full State ranking.Click here to see the full State ranking.
A larger shared setting that may offer more common spaces and organized community services.
33 years in operation Rank #23 / 210Years in operation — State benchmarkedThis home is ranked 23rd out of 210 homes in Maryland for years in operation. Shows how long this facility has been in operation compared to other Maryland facilities. Longer operating histories may benefit residents, families, and staff.Facilities with the same value for a metric share the same rank. Rankings are based only on facilities in Maryland that report data for that category. Facilities without available data are excluded from the ranking.Click the rank badge to see the full State ranking.Click here to see the full State ranking.
A longer operating history, which may indicate experience navigating regulations and delivering ongoing care.
Walk Score: 36 / 100 Rank #563 / 985Walk Score — State benchmarkedThis home is ranked 563rd out of 985 homes in Maryland for walk score. Shows how walkable this facility's neighborhood is compared to the average walk score across Maryland facilities. Higher scores benefit residents, families, and staff.Facilities with the same value for a metric share the same rank. Rankings are based only on facilities in Maryland that report data for that category. Facilities without available data are excluded from the ranking.Click the rank badge to see the full State ranking.Click here to see the full State ranking.
Somewhat walkable. A few nearby services may be reachable on foot, but most trips require transportation.
About this community
Facility TypeAssisted Living
CountyAnne Arundel
Private Room
$190 - $250 per day
Semi-Private Room
$145 - $185 per day
Apartment
$225 - $285 per day
Hospice Affiliations
Staffing
Key information about the people who lead and staff this community.
ContactMs. Heidi Thomas, Marketing Director (per BBB, record updated Jul 2026)
No Alzheimer's certification
Dedicated Alzheimer's Unit
Mild Alzheimer's Level
Moderate Alzheimer's Level
Severe Alzheimer's Level
Demographics
Resident demographic information for this facility.
Gender
- Female 77.2%
- Male 22.8%
Age Distribution
- 85-94 40.5%
- 75-84 35.4%
- 95+ 16.5%
- 65-74 7.6%
Ethnicity
- White 86.1%
- African American 12.7%
- Asian 1.3%
What does this home offer?
Pets Allowed
Housing Options: Studio / 1 Bed / 2 Bed
Building Type: 3-story
Transportation Services
Fitness and Recreation
25 years of experience
Lisa Kemper, the Executive Director of Morningside House of Friendship, has worked with Morningside Senior Living for more than 25 years in a number of positions from employee relations to human resources. She has led Morningside House of Friendship for more than 16 years. A Certified National Administrator, Lisa focuses on treating residents like family, ensuring compassionate and personalized care.
Places of interest near Morningside House of Friendship
![]() 3.3 miles from city center
3.3 miles from city center
![]() Estimated distance in miles from Hanover's city center to Morningside House of Friendship's address, calculated via Google Maps.
— 7.84 miles to nearest hospital (Ascension Saint Agnes Hospital)
Estimated distance in miles from Hanover's city center to Morningside House of Friendship's address, calculated via Google Maps.
— 7.84 miles to nearest hospital (Ascension Saint Agnes Hospital)
Calculate Travel Distance to Morningside House of Friendship
Add your location
Compare Assisted Living around Baltimore
The information below is reported by the Maryland Department of Health, Office of Health Care Quality.
| Springwell Senior Living Community | AL IL MC | Baltimore (West Rogers Avenue) | 151
Facility
151
MD AVG
42
Rank
#42 / 685 | No |
30
Facility
30
MD AVG
43
Rank
#627 / 985 | Studio / 1 Bed / 2 Bed | - | A+ |
20% Male Residents — State Benchmarked 20% of residents are male, compared to the Maryland average of 31%. This facility caters to a majority female resident pool (80% female), consistent with the broader assisted living trend where women significantly outnumber men. |
80% Female Residents — State Benchmarked 80% of residents are female, compared to the Maryland average of 69%. Women comprise the large majority, consistent with national assisted living demographics where women live longer and enter care facilities at higher rates. |
91% White Residents — State Benchmarked 91% of residents are reported as White, compared to the Maryland average of 81%. A higher White share than is typical for assisted living in Maryland in this dataset — compare with peer facilities for local context. |
6% African American Residents — State Benchmarked 6% of residents are reported as African American or Black, compared to the Maryland average of 13%. In line with the Maryland average for African American residents among facilities reporting this breakdown. |
3% Other Ethnicity Residents — State Benchmarked 3% of residents fall into categories other than White or African American (combined), compared to the Maryland average of 6%. This column aggregates Hispanic, Asian, multiracial, and any other labeled groups that are not classified as White or African American. Reported subgroups in this total: Hispanic (2%), Asian (1%). |
8% Residents Age 65–74 — State Benchmarked 8% of residents are 65–74, compared to the Maryland average of 13%. Fewer younger seniors suggests the resident population skews older, likely requiring higher acuity care and more hands-on support. |
30% Residents Age 75–84 — State Benchmarked 30% of residents are 75–84, compared to the Maryland average of 31%. This is the second most common age bracket in assisted living, representing residents with moderate care needs. |
45% Residents Age 85–94 — State Benchmarked 45% of residents are 85–94, compared to the Maryland average of 44%. This is typically the most common age bracket in assisted living — this facility is in line with the statewide norm. |
15% Residents Age 95+ — State Benchmarked 15% of residents are 95 or older, compared to the Maryland average of 16%. In line with the statewide profile for the oldest resident bracket. |
| Pickersgill Retirement Community | AL IL NH SNF | Baltimore (Chestnut Hill) | 138
Facility
138
MD AVG
42
Rank
#55 / 685 | No |
45
Facility
45
MD AVG
43
Rank
#475 / 985 | - | - | A+ |
24% Male Residents — State Benchmarked 24% of residents are male, compared to the Maryland average of 31%. This facility caters to a majority female resident pool (76% female), consistent with the broader assisted living trend where women significantly outnumber men. |
76% Female Residents — State Benchmarked 76% of residents are female, compared to the Maryland average of 69%. Women comprise the large majority, consistent with national assisted living demographics where women live longer and enter care facilities at higher rates. |
95% White Residents — State Benchmarked 95% of residents are reported as White, compared to the Maryland average of 81%. A higher White share than is typical for assisted living in Maryland in this dataset — compare with peer facilities for local context. |
1% African American Residents — State Benchmarked 1% of residents are reported as African American or Black, compared to the Maryland average of 13%. A lower African American share than is typical in Maryland; local markets still vary widely. |
4% Other Ethnicity Residents — State Benchmarked 4% of residents fall into categories other than White or African American (combined), compared to the Maryland average of 6%. This column aggregates Hispanic, Asian, multiracial, and any other labeled groups that are not classified as White or African American. Reported subgroups in this total: Asian (4%). |
3% Residents Age 65–74 — State Benchmarked 3% of residents are 65–74, compared to the Maryland average of 13%. Fewer younger seniors suggests the resident population skews older, likely requiring higher acuity care and more hands-on support. |
27% Residents Age 75–84 — State Benchmarked 27% of residents are 75–84, compared to the Maryland average of 31%. This is the second most common age bracket in assisted living, representing residents with moderate care needs. |
55% Residents Age 85–94 — State Benchmarked 55% of residents are 85–94, compared to the Maryland average of 44%. A high concentration of very elderly residents signals a higher-acuity facility with experience caring for advanced age-related needs. |
15% Residents Age 95+ — State Benchmarked 15% of residents are 95 or older, compared to the Maryland average of 16%. In line with the statewide profile for the oldest resident bracket. |
| Morningside House At Satyr Hill | AL HOS MC RC | Parkville (Woodcroft) | 125
Facility
125
MD AVG
42
Rank
#68 / 685 | Yes |
72
Facility
72
MD AVG
43
Rank
#160 / 985 | Private Rooms / Semi-Private Rooms | 28
Facility
28
MD AVG
20
Rank
#51 / 210 | A+ |
34% Male Residents — State Benchmarked 34% of residents are male, compared to the Maryland average of 31%. This facility caters to a majority female resident pool (66% female), consistent with the broader assisted living trend where women significantly outnumber men. |
66% Female Residents — State Benchmarked 66% of residents are female, compared to the Maryland average of 69%. Women comprise the large majority, consistent with national assisted living demographics where women live longer and enter care facilities at higher rates. |
98% White Residents — State Benchmarked 98% of residents are reported as White, compared to the Maryland average of 81%. A higher White share than is typical for assisted living in Maryland in this dataset — compare with peer facilities for local context. |
2% African American Residents — State Benchmarked 2% of residents are reported as African American or Black, compared to the Maryland average of 13%. A lower African American share than is typical in Maryland; local markets still vary widely. |
0% Other Ethnicity Residents — State Benchmarked 0% of residents fall into categories other than White or African American (combined), compared to the Maryland average of 6%. This column aggregates Hispanic, Asian, multiracial, and any other labeled groups that are not classified as White or African American. |
13% Residents Age 65–74 — State Benchmarked 13% of residents are 65–74, compared to the Maryland average of 13%. In line with the statewide profile for this youngest senior bracket in assisted living. |
40% Residents Age 75–84 — State Benchmarked 40% of residents are 75–84, compared to the Maryland average of 31%. A high concentration in this mid-range bracket, where residents typically need moderate support with daily activities. |
29% Residents Age 85–94 — State Benchmarked 29% of residents are 85–94, compared to the Maryland average of 44%. The population here skews younger than the statewide norm, which may indicate a more active, lower-acuity community. |
16% Residents Age 95+ — State Benchmarked 16% of residents are 95 or older, compared to the Maryland average of 16%. In line with the statewide profile for the oldest resident bracket. |
| Morningside House of Friendship | AL HOS MC RC | Hanover | 103
Facility
103
MD AVG
42
Rank
#103 / 685 | Yes |
36
Facility
36
MD AVG
43
Rank
#563 / 985 | Studio / 1 Bed / 2 Bed | 33
Facility
33
MD AVG
20
Rank
#23 / 210 | - |
23% Male Residents — State Benchmarked 23% of residents are male, compared to the Maryland average of 31%. This facility caters to a majority female resident pool (77% female), consistent with the broader assisted living trend where women significantly outnumber men. |
77% Female Residents — State Benchmarked 77% of residents are female, compared to the Maryland average of 69%. Women comprise the large majority, consistent with national assisted living demographics where women live longer and enter care facilities at higher rates. |
86% White Residents — State Benchmarked 86% of residents are reported as White, compared to the Maryland average of 81%. Close to the average for this category among assisted living facilities in Maryland with reported race/ethnicity data. |
13% African American Residents — State Benchmarked 13% of residents are reported as African American or Black, compared to the Maryland average of 13%. In line with the Maryland average for African American residents among facilities reporting this breakdown. |
1% Other Ethnicity Residents — State Benchmarked 1% of residents fall into categories other than White or African American (combined), compared to the Maryland average of 6%. This column aggregates Hispanic, Asian, multiracial, and any other labeled groups that are not classified as White or African American. Reported subgroups in this total: Asian (1%). |
8% Residents Age 65–74 — State Benchmarked 8% of residents are 65–74, compared to the Maryland average of 13%. Fewer younger seniors suggests the resident population skews older, likely requiring higher acuity care and more hands-on support. |
35% Residents Age 75–84 — State Benchmarked 35% of residents are 75–84, compared to the Maryland average of 31%. This is the second most common age bracket in assisted living, representing residents with moderate care needs. |
41% Residents Age 85–94 — State Benchmarked 41% of residents are 85–94, compared to the Maryland average of 44%. This is typically the most common age bracket in assisted living — this facility is in line with the statewide norm. |
16% Residents Age 95+ — State Benchmarked 16% of residents are 95 or older, compared to the Maryland average of 16%. In line with the statewide profile for the oldest resident bracket. |
| Brightview Mays Chapel Ridge | AL IL MC | Timonium (Dixon Hill) | 89
Facility
89
MD AVG
42
Rank
#150 / 685 | Yes |
52
Facility
52
MD AVG
43
Rank
#402 / 985 | Studio / 1 Bed / 2 Bed | 50
Facility
50
MD AVG
20
Rank
#1 / 210 | A+ |
13% Male Residents — State Benchmarked 13% of residents are male, compared to the Maryland average of 31%. This facility caters to a majority female resident pool (87% female), consistent with the broader assisted living trend where women significantly outnumber men. |
87% Female Residents — State Benchmarked 87% of residents are female, compared to the Maryland average of 69%. Women comprise the large majority, consistent with national assisted living demographics where women live longer and enter care facilities at higher rates. |
99% White Residents — State Benchmarked 99% of residents are reported as White, compared to the Maryland average of 81%. A higher White share than is typical for assisted living in Maryland in this dataset — compare with peer facilities for local context. |
0% African American Residents — State Benchmarked 0% of residents are reported as African American or Black, compared to the Maryland average of 13%. A lower African American share than is typical in Maryland; local markets still vary widely. |
1% Other Ethnicity Residents — State Benchmarked 1% of residents fall into categories other than White or African American (combined), compared to the Maryland average of 6%. This column aggregates Hispanic, Asian, multiracial, and any other labeled groups that are not classified as White or African American. Reported subgroups in this total: Asian (1%). |
3% Residents Age 65–74 — State Benchmarked 3% of residents are 65–74, compared to the Maryland average of 13%. Fewer younger seniors suggests the resident population skews older, likely requiring higher acuity care and more hands-on support. |
30% Residents Age 75–84 — State Benchmarked 30% of residents are 75–84, compared to the Maryland average of 31%. This is the second most common age bracket in assisted living, representing residents with moderate care needs. |
48% Residents Age 85–94 — State Benchmarked 48% of residents are 85–94, compared to the Maryland average of 44%. This is typically the most common age bracket in assisted living — this facility is in line with the statewide norm. |
18% Residents Age 95+ — State Benchmarked 18% of residents are 95 or older, compared to the Maryland average of 16%. In line with the statewide profile for the oldest resident bracket. |
Financial Assistance for
Assisted Living in Maryland
Morningside House of Friendship is located in Hanover, Maryland.
Here are the financial assistance programs available to residents in Maryland.
Frequently Asked Questions about Morningside House of Friendship
Is Morningside House of Friendship in a walkable area?
Morningside House of Friendship has a walk score of 36. Somewhat walkable. A few nearby services may be reachable on foot, but most trips require transportation.
How long has Morningside House of Friendship been in business?
Morningside House of Friendship has been operating for approximately 33 years, based on available licensing and registration records.
Are pets allowed at Morningside House of Friendship?
Yes, Morningside House of Friendship allows residents to bring their pets.
How many beds does Morningside House of Friendship have?
Morningside House of Friendship has 103 beds.
Are there photos of Morningside House of Friendship?
Yes — there are 4 photos of Morningside House of Friendship in the photo gallery on this page.
What is the address of Morningside House of Friendship?
Morningside House of Friendship is located at 7548 Old Telegraph Rd, Hanover, MD 21076.
What is the phone number of Morningside House of Friendship?
(410) 936-5528 will put you in contact with the team at Morningside House of Friendship.
Guides for Better Senior Living
Care Cost Calculator: See Prices in Your Area
Assisted Living Explorer
Don’t Wait Too Long: 7 Red Flag Signs Your Parent Needs Assisted Living Now
The True Cost of Assisted Living in 2025 – And How Families Are Paying For It
Understanding Senior Living Costs: Pricing Models, Discounts & Financial Assistance
Updated on
