Mountain View Health & Rehab
CMS overall rating Info CMS (the Centers for Medicare & Medicaid Services) is the federal agency that rates nursing home quality. Its Overall Rating runs from 1 to 5 stars, combining health inspections, staffing, and quality measures, with inspections weighted most heavily.

Mountain View Health & Rehab

CMS overall rating Info CMS (the Centers for Medicare & Medicaid Services) is the federal agency that rates nursing home quality. Its Overall Rating runs from 1 to 5 stars, combining health inspections, staffing, and quality measures, with inspections weighted most heavily.
Calculator: See prices in your area
Mountain View Health & Rehab accepts Medicare and private pay.

Overview of Mountain View Health & Rehab

Clinical outcomes at Mountain View Health & Rehab paint a portrait of a facility in deep distress.

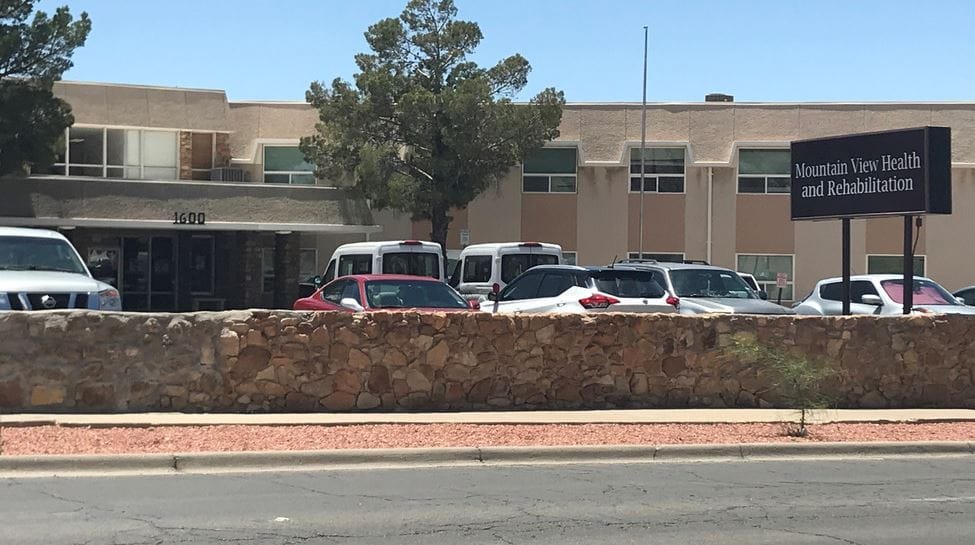
The 117-bed nursing home in Carson City, Nevada (1-star CMS rating across all measures) reports that 55.3% of long-stay residents display depressive symptoms; 532% worse than Nevada’s state average of 8.7%.

Antipsychotic medication use reaches 32.8% of residents, 71% above the state benchmark.

+Functional decline score measures 32.4, 87% worse than Nevada’s average.

Falls with major injury occurred in 9.6% of residents, more than three times the state rate.

Walking ability worsened in 41.2% of residents, 112% above the state average.

High-risk clinical events composite score reached 21.4, 108% worse than Nevada’s benchmark.

Mountain View ranks 186th out of 190 Nevada nursing homes in total nursing care hours per resident per day (2 hours 19 minutes), 43% below the Nevada average of 4 hours 2 minutes. Total nursing hours fall 34% below the national average of 3.5 hours. Staff-to-resident ratio measures 1.01:1, 34% worse than Nevada’s average of 1.54:1.

Registered nurses total just two employees.

Weekend registered nurse coverage drops to 12 minutes per resident per day, 43% below the state average and likely insufficient for crisis response.

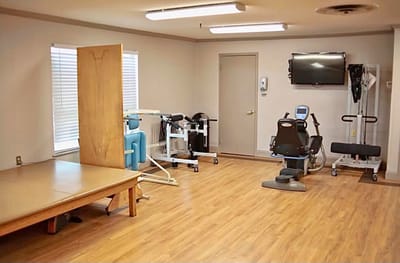
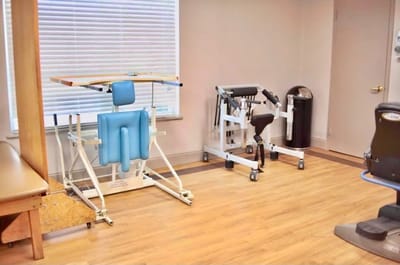
Mountain View provides skilled nursing, memory care, post-acute and long-term care, with additional programs addressing stroke, cardiac conditions, diabetes management, and wound care. Services include physical, occupational, and speech therapy; podiatry, optometry, and dental services; hospice and nutritional support. Two positive CMS quality indicators include pneumococcal (100%) and influenza (100%) vaccination rates, both exceeding state benchmarks.

Occupancy declined to 59.6%, 24% below Nevada’s average, with an average length of stay of 234 days.Admissions favor short-stay rehabilitation: Medicare comprises 66% of new admissions.

Resident census comprises Medicare 15.6%, Medicaid 68.8%, private pay 15.6%.

Financial performance deteriorated: operating loss of $380,400 in 2024 followed a $980,600 loss in 2023. Payroll represents 52.9% of $7.5 million in annual revenue. Owner Shari Jordan operates the facility as a privately-owned business corporation.

Walk score of 46 reflects somewhat walkable neighborhood access.

No civil money penalties or payment denials were imposed in the past three years.

Mountain View displays systematic clinical failure correlating with severe understaffing, resulting in high-acuity resident decline, depressive symptomatology at crisis levels, and pervasive safety deficits across a 1-star rated facility.

Quality ratings

Measured by Centers for Medicare & Medicaid Services (CMS)

Overall rating Info The Overall CMS Rating combines results from health inspections, staffing levels and quality measures. Health inspections carry the most weight. Staffing and quality scores can increase or decrease the final rating based on performance compared to state and national standards.
▼ 66.8% Below NV avg. ▼ 66.8% Below NV avg.Click the badge to see the full State ranking.Click here to see the full State ranking.
Health Inspection Info Based on the results of the facility's three most recent standard inspections and any complaint investigations. CMS reviews the number, scope, and severity of deficiencies, with more recent findings weighted more heavily.
▼ 64.9% Below NV avg. ▼ 64.9% Below NV avg.Click the badge to see the full State ranking.Click here to see the full State ranking.
Staffing Info Measures average nursing staff hours per resident per day, including Registered Nurses (RNs) and total nursing staff. Ratings are adjusted based on the level of care residents require and are compared to state and national benchmarks.
▼ 67.8% Below NV avg. ▼ 67.8% Below NV avg.Click the badge to see the full State ranking.Click here to see the full State ranking.
Quality Measures Info Based on clinical and physical health indicators reported to CMS, such as hospital readmissions, falls, pressure ulcers, and improvements in mobility. These measures reflect how well residents' health needs are being managed.
▼ 72.4% Below NV avg. ▼ 72.4% Below NV avg.Click the badge to see the full State ranking.Click here to see the full State ranking.

Staffing hours breakdown

Info Daily nursing hours per resident by staff type, reported to CMS. Higher is generally better — compare this facility to state and national averages to see where staffing stands.

Hours per resident per day — compared to Nevada state averages

Total nursing care / resident Info This home is ranked 186th out of 190 homes in Nevada for nurse hours. Total adjusted nursing hours per resident per day, combining RN, LPN, and aide time. CMS adjusts this for case-mix so facilities can be fairly compared.
2h 19m per day
Rank #186 / 190Nurse hours — State benchmarkedThis home is ranked 186th out of 190 homes in Georgia. Shows adjusted nurse hours per resident per day benchmarked to the Georgia average, with a ranking across 190 Georgia facilities. More hours mean more direct care. The national average is about 3.5 hrs; below 3.0 is a red flag.Click the rank badge to see the full State ranking.Click here to see the full State ranking.
This facility Nevada avg (4h 2m per day)
vs Nevada avg
-43%

6 of 6 metrics below state avg

Staff typeHours / Day / Residentvs state avg
Registered Nurse (RN) Info RNs hold the highest nursing license and can assess residents, interpret test results, and direct care plans. More RN hours per day often signals stronger clinical oversight and faster response to health changes. 13m per day ▼ 48% State avg: 26m per day · National avg: 41m per day
LPN / LVN Info Licensed Practical Nurses (LPNs) or Licensed Vocational Nurses (LVNs) deliver routine hands-on care — medication administration, wound dressing, and monitoring vital signs. They work under RN supervision and make up a large share of daily bedside care. 51m per day ▼ 11% State avg: 57m per day · National avg: 52m per day
Nurse Aide Info Certified Nurse Aides (CNAs) provide the most direct day-to-day assistance: bathing, dressing, feeding, and mobility. Nurse aide hours are typically the largest staffing category and directly affect residents' quality of life. 1h 43m per day ▼ 15% State avg: 2h 1m per day · National avg: 2h 21m per day
Weekend Total Nursing Info Combined nursing hours (RN + LPN + Nurse Aide) per resident per day on weekends. Staffing often drops on weekends — this figure reveals whether the facility maintains adequate coverage outside of weekday hours. 2h 20m per day ▼ 22% State avg: 2h 59m per day · National avg: 3h 26m per day
Physical Therapist Info Hours per resident per day provided by licensed Physical Therapists (PTs) or PT Assistants. PT services help residents recover mobility after injury or illness and are especially important for post-acute (short-stay) rehabilitation. 2m per day ▼ 56% State avg: 4m per day · National avg: 4m per day
Weekend RN Info Registered nurse hours specifically on weekends. Facilities sometimes reduce RN presence on Saturdays and Sundays — a low weekend RN figure compared to weekday hours can indicate reduced clinical oversight when most administrative staff are absent. 10m per day ▼ 55% State avg: 21m per day · National avg: 29m per day

Capacity and availability

This home usually has availability

Lower occupancy than the Nevada average: 81.5%
Occupancy rate
59.6% Rank #212 / 316Occupancy rate — State benchmarkedThis home is ranked 212th out of 316 homes in Georgia. Shows this facility's occupancy rate versus the Georgia average, with its Statewide rank out of 316. Higher occupancy signals strong local demand and financial stability.Click the rank badge to see the full State ranking.Click here to see the full State ranking.
Avg. Length of Stay
234 days
Walk Score
Walk Score: 46 / 100 Rank #219 / 414Walk Score — State benchmarkedThis home is ranked 219th out of 414 homes in Nevada. Shows how walkable this facility's neighborhood is compared to the average Walk Score across Nevada facilities. Higher scores benefit residents, families, and staff.Click the rank badge to see the full State ranking.Click here to see the full State ranking.
Somewhat walkable. A few nearby services may be reachable on foot, but most trips require transportation.

About this community

Therapy & Rehabilitation

3 services
Rehabilitation Services
Respite Care
Short-Term Rehab

Amenities & Lifestyle

Specific ProgramsRehab-to-Home, Nursing Restorative Programs, Physical, Occupational, and Speech Therapy, Surgery Recovery, Stroke and Neurological Conditions, Cardiac Related Illnesses, Diabetes Management, Podiatry, Dentistry, Optometry, Nutritional Services, Beauty & Barber Services, Laundry & Housekeeping, Religious Services
Religious ServicesYes

Dining & Nutrition

Food DescriptionHealthy, nutritious, and delicious meals prepared for residents daily.

Contact Mountain View Health & Rehab

Staffing Data

Reporting period: October 1 – December 31, 2025 (Q4 2025). Source: CMS Payroll-Based Journal report.

Total staff 78
Employees 65
Contractors 13
Staff to resident ratio 1.01 : 1
34% fewer staff per resident than Nevada average
Nevada average ratio: 1.54 : 1 Nevada average ratio: 1.54 : 1See full Nevada ranking
Avg staff/day 31
Average shift 8.4 hours
5% worse than Nevada average
Nevada average: 8.8 hours Nevada average shift: 8.8 hoursSee full Nevada ranking
Total staff hours (quarter) 24,053

Nursing staff breakdown

Q4 2025 · Oct 1 – Dec 31 More info This data comes from the CMS Payroll-Based Journal report covering October 1 – December 31, 2025.
Registered Nurse

Manages medical care and health needs.

RN Staff Info All 2 RN Staff are full-time employees. No contractors work on this role. 2
Average shift length Info Average shift length. Calculated as total hours divided by days worked and average staff per day. 8.4 hours
Licensed Practical Nurse

Assists with medical care and medications.

LPN Staff Info All 13 LPN Staff are full-time employees. No contractors work on this role. 13
Average shift length Info Average shift length. Calculated as total hours divided by days worked and average staff per day. 9.1 hours
Certified Nursing Assistant

Helps with daily care and mobility.

CNA Staff Info All 40 CNA Staff are full-time employees. No contractors work on this role. 40
Average shift length Info Average shift length. Calculated as total hours divided by days worked and average staff per day. 8.9 hours

Contractor staffing

Q4 2025 · Oct 1 – Dec 31 More info This data comes from the CMS Payroll-Based Journal report covering October 1 – December 31, 2025.

Total hours from contractors

6.8%

1,631 contractor hours this quarter

Speech Language Pathologist: 3 Physical Therapy Assistant: 3 Respiratory Therapy Technician: 2 Medical Director: 1 Qualified Social Worker: 1 Physical Therapy Aide: 1 Occupational Therapy Assistant: 1 Occupational Therapy Aide: 1

Staff by category

Q4 2025 · Oct 1 – Dec 31 More info This data comes from the CMS Payroll-Based Journal report covering October 1 – December 31, 2025.
Certified Nursing Assistant4004012,51292100%8.9
Licensed Practical Nurse130134,88792100%9.1
RN Director of Nursing2021,3037379%10.4
Other Dietary Services Staff2021,0538087%8
Registered Nurse2029518087%8.4
Dental Services Staff1015366874%7.9
Nurse Practitioner1015286672%8
Speech Language Pathologist0334926368%7.8
Administrator1014886267%7.9
Physical Therapy Aide0114476470%7
Qualified Social Worker0112666773%4
Respiratory Therapy Technician0222154246%5
Clinical Nurse Specialist3031652426%6.6
Physical Therapy Assistant0331373134%4.3
Occupational Therapy Assistant0114233%14
Occupational Therapy Aide0112433%8
Medical Director01171415%0.5
40 Certified Nursing Assistant
% of Days 100%
13 Licensed Practical Nurse
% of Days 100%
2 RN Director of Nursing
% of Days 79%
2 Other Dietary Services Staff
% of Days 87%
2 Registered Nurse
% of Days 87%
1 Dental Services Staff
% of Days 74%
1 Nurse Practitioner
% of Days 72%
3 Speech Language Pathologist
% of Days 68%
1 Administrator
% of Days 67%
1 Physical Therapy Aide
% of Days 70%
1 Qualified Social Worker
% of Days 73%
2 Respiratory Therapy Technician
% of Days 46%
3 Clinical Nurse Specialist
% of Days 26%
3 Physical Therapy Assistant
% of Days 34%
1 Occupational Therapy Assistant
% of Days 3%
1 Occupational Therapy Aide
% of Days 3%
1 Medical Director
% of Days 15%

Penalties and fines

Federal penalties imposed by CMS for regulatory violations, including civil money penalties (fines) and denials of payment for new Medicare/Medicaid admissions.

Source: CMS Penalties Database

No penalties in the past 3 years

No civil money penalties or payment denials were reported in the last 3 years.

Quality of care over time

These measures show how residents usually do over time at this home, based on health outcomes and preventive care.

High-risk clinical events score Info A composite score based on pressure ulcers, falls with injury, weight loss, walking ability decline, and activities of daily living decline. 21.4
108% worse than Nevada average

Nevada average: 10.3

Functional decline score Info A composite score based on activities of daily living decline, walking ability decline, and incontinence. 32.4
87% worse than Nevada average

Nevada average: 17.4

Long-stay resident measures
Significantly above average Info CMS star rating based on long-stay quality measure performance. 5 stars = significantly above average, 1 star = significantly below average.
Need for Help with Daily Activities Increased Info Percent of long-stay residents whose need for help with daily activities has increased 39.7%
136% worse than Nevada average

Nevada average: 16.8%

Walking Ability Worsened Info Percent of long-stay residents whose ability to move independently worsened 41.2%
112% worse than Nevada average

Nevada average: 19.4%

Low Risk Residents with Bowel/Bladder Incontinence Info Percent of low risk long-stay residents who lose control of their bowels or bladder 16.3%
In line with Nevada average

Nevada average: 16.1%

Falls with Major Injury Info Percent of long-stay residents experiencing one or more falls with major injury 9.6%
201% worse than Nevada average

Nevada average: 3.2%

High Risk Residents with Pressure Ulcers Info Percent of long-stay high risk residents with pressure ulcers 8.1%
29% worse than Nevada average

Nevada average: 6.3%

Urinary Tract Infection Info Percent of long-stay residents with a urinary tract infection 4.3%
71% worse than Nevada average

Nevada average: 2.5%

Lost Too Much Weight Info Percent of long-stay residents who lose too much weight 8.3%
38% worse than Nevada average

Nevada average: 6.0%

Depressive Symptoms Info Percent of long-stay residents who have depressive symptoms 55.3%
532% worse than Nevada average

Nevada average: 8.7%

Antipsychotic Use Info Percent of long-stay residents who received an antipsychotic medication 32.8%
71% worse than Nevada average

Nevada average: 19.1%

Pneumococcal Vaccine Info Percent of long-stay residents assessed and appropriately given the pneumococcal vaccine 100.0%
9% better than Nevada average

Nevada average: 91.5%

Influenza Vaccine Info Percent of long-stay residents assessed and appropriately given the seasonal influenza vaccine 100.0%
5% better than Nevada average

Nevada average: 95.0%

Hospitalizations per 1,000 days Info Number of hospitalizations per 1,000 long-stay resident days. 1.10
48% better than Nevada average

Nevada average: 2.13

ED visits per 1,000 days Info Number of outpatient emergency department visits per 1,000 long-stay resident days. 0.25
88% better than Nevada average

Nevada average: 2.07

Short-stay resident measures
Below average Info CMS star rating based on short-stay quality measure performance. 5 stars = much above average, 1 star = much below average.
Pneumococcal Vaccine Info Percent of short-stay residents assessed and appropriately given the pneumococcal vaccine 100.0%
24% better than Nevada average

Nevada average: 80.6%

Antipsychotic medication increase Info Percent of short-stay residents who newly received an antipsychotic medication 6.4%
189% worse than Nevada average

Nevada average: 2.2%

Influenza Vaccine Info Percent of short-stay residents assessed and appropriately given the seasonal influenza vaccine 96.7%
24% better than Nevada average

Nevada average: 78.2%

Re-hospitalized after SNF stay Info Percentage of short-stay residents who were re-hospitalized after their nursing home admission. 16.3%
37% better than Nevada average

Nevada average: 25.9%

Emergency department visits Info Percentage of short-stay residents who had an outpatient emergency department visit. 10.1%
16% better than Nevada average

Nevada average: 12.0%

Falls with major injury Info Percentage of SNF residents who experience falls with major injury during their stay. 0.0%
100% better than Nevada average

Nevada average: 0.8%

Ability to care for self at discharge Info Percentage of residents at or above expected ability to care for themselves at discharge. 63.4%
18% better than Nevada average

Nevada average: 53.7%

Successful return to home or community Info Rate of successful return to home or community from a skilled nursing facility. 37.9%
25% worse than Nevada average

Nevada average: 50.6%

Breakdown by payment type

Medicare

66% of new residents, usually for short-term rehab.

Typical stay 1 - 2 months

Private pay

34% of new residents, often for short stays.

Typical stay 1 - 2 years

Facility Characteristics

Source: CMS Long-Term Care Facility Characteristics (Data as of Jan 2026)

Total residents 77
Medicare
12
15.6% of residents
Medicaid
53
68.8% of residents
Private pay or other
12
15.6% of residents
Programs & Services
Residents Group

Residents meet regularly to discuss policies, care quality, and activities

Nurse Aide Training

State-approved Nurse Aide Training and Competency Evaluation Program on-site

Active Resident Council

Organized group of residents that meets regularly to discuss facility policies, quality of life, and activities.

Finances and operations

Voluntary non-profit community
Operated by a church.
Home revenue
$7.5M
Operating deficit
-$380.4K
Voluntary non-profit community Operated by a church.
Home revenue
$7.5M Rank #152 / 185Revenue — State benchmarkedThis home is ranked 152nd out of 185 homes in Georgia. Shows this facility's annual revenue compared to the Georgia average. Higher revenue generally means more resources for staffing and capital — read alongside Payroll %.Click the rank badge to see the full State ranking.Click here to see the full State ranking.
Operating deficit
-$380.4K
Payroll costs Info The portion of the home's budget spent on staff, including nurses, caregivers, and other employees who support care and operations. Rank #132 / 185Payroll — State benchmarkedThis home is ranked 132nd out of 185 homes in Georgia. Shows total annual staff payroll benchmarked to the Georgia average. Higher payroll investment relative to peers often signals better staffing and less reliance on cheaper contract labor.Click the rank badge to see the full State ranking.Click here to see the full State ranking.
$3.9M
52.9% of revenue Rank #47 / 185Payroll % — State benchmarkedThis home is ranked 47th out of 185 homes in Georgia. Shows payroll as a percentage of revenue versus the Georgia average. Well-run Georgia facilities typically land around 51–61% — the top third Statewide. Below 25% may signal understaffing or heavy agency use — read with Staffing ratings.Click the rank badge to see the full State ranking.Click here to see the full State ranking.
Other operating costs Info All remaining costs needed to run the home, such as food, utilities, building maintenance, supplies and administrative expenses.
$3.9M
Total costs $7.8M

Who this home usually serves

TYPE OF STAY

Mostly short-term rehab stays

Most residents typically stay for a few weeks or months before returning home or moving on.

Financial Assistance for
Nursing Home in Nevada

Mountain View Health & Rehab is located in Carson City, Nevada.
Here are the financial assistance programs available to residents in Nevada.

Get Financial aid guidance

Home and Community Based Waiver

Nevada Medicaid HCBW

Age 65+ or disabled
General Nevada resident, Medicaid-eligible, nursing home-level care need.
Income Limits (2025) ~$2,829/month 300% FBR, individual
Asset Limits $2,000 (individual), $3,000 (couple).
NV

High urban demand (e.g., Las Vegas); rural challenges.

Benefits
Personal care (5-7 hours/day) Respite (240 hours/year) Home modifications ($1,500 avg.) Meals ($6/meal)

Nevada Senior Services Program

NV SSP

Age 60+
General Nevada resident, at risk of decline.
Income Limits ~$1,800/month individual, varies
Asset Limits $5,000 individual
NV

Limited funding; rural focus.

Benefits
In-home care (3-5 hours/week) Respite (up to 10 days/year) Transportation (~5 trips/month)

Personal Care Services (PCS)

Nevada Personal Care Services

Age 19+ (65+ for seniors focus)
General Nevada resident, Medicaid-eligible, needs help with 1+ ADL.
Income Limits (2025) ~$967/month (individual); spenddown allowed.
Asset Limits $2,000 (individual), $3,000 (couple).
NV

Self-directed (family can be paid); statewide via DHHS.

Benefits
Personal care (4-6 hours/day) Limited homemaker services Respite (~200 hours/year)

Senior Rx Program

Nevada Senior Rx Program

Age 65+
General Nevada resident, enrolled in Medicare Part D, income below limit.
Income Limits (2025) ~$2,510/month (individual), ~$3,380/month (couple).
Asset Limits Not assessed.
NV

Covers up to $38.75/month premium; funded by tobacco settlement.

Benefits
Prescription drug premium assistance (~$465/year) Reducing out-of-pocket costs

Medicare Savings Program (MSP)

Nevada Medicare Savings Program

Age 65+ or disabled
General Nevada resident, Medicare Part A/B.
Income Limits (2025) ~$2,510/month (QMB), ~$3,380/month (SLMB), ~$3,598/month (QI)—individual.
Asset Limits $9,430 (individual), $14,130 (couple).
NV

Three tiers; no waitlist; includes Extra Help for Part D.

Benefits
Covers Part B premiums ($174.70/month) Deductibles ($240/year) Copays (~20%)

Nevada Caregiver Support Program (via NFCSP)

Nevada Caregiver Support Program

Age
General Caregivers of 60+ needing care or 55+ caregivers of others; Nevada resident; functional needs (2+ ADLs).
Income Limits (2025) Prioritizes ~$24,980/year (individual); no strict cap.
Asset Limits Not assessed; need-based.
NV

5 AAAs; prioritizes rural, low-income caregivers.

Benefits
Respite (4-6 hours/week or 5 days/year) Adult day care ($60/day) Training Supplies (~$500/year)

VA Aid and Attendance (A&A) and Housebound Benefits

Nevada VA Aid and Attendance/Housebound

Age 65+ or disabled veteran/spouse
General Nevada resident, wartime service, need for ADL help (A&A) or homebound.
Income Limits (2025) Net income < ~$1,984/month (veteran with dependent, A&A); pension offsets income.
Asset Limits ~$155,356 net worth limit
NV

High veteran demand in urban/rural areas.

Benefits
Cash (~$1,433-$2,642/month veteran, ~$951-$1,318 spouse) for care costs (e.g., in-home, assisted living)

Compare Nursing Home around Carson City

The information below is reported by the Nevada Department of Health and Human Services, Bureau of Health Care Quality and Compliance.

2 facilities compared · CMS & NV Dept. of Health data

Ormsby Post Acute Rehab
NH

Nursing Home Licensed facility providing 24/7 skilled nursing care for residents with complex, ongoing medical needs. Staffed by RNs, LPNs, and CNAs. Inspected and star-rated annually by CMS. Accepts Medicare (short-term rehab) and Medicaid (long-term care).

AL

Assisted Living A licensed, long-term care setting for seniors or individuals with disabilities who need help with daily activities — like bathing, dressing, and medication management — but not 24-hour skilled nursing. Offers housing, meals, and around-the-clock support while aiming to maximize resident independence.

Carson City
120
Facility 120
NV AVG 42
Rank #42 / 321
68.2%
Facility 68.2%
NV AVG 81.5%
Rank #204 / 264
-16%
3.93
Facility 3.93
NV AVG 4.03
Rank #9 / 43
+9%-3%
$60.5k
Facility $60.5k
NV AVG $34.1k
Rank #41 / 45
100
Facility 100
NV AVG 36.2
Rank #45 / 45
12.5
Facility 12.5
NV AVG 7.1
Rank #44 / 45
189
46
Facility 46
NV AVG 45
Rank #219 / 414
Pacific Northwest Snf Operations Holdings (Nv) LLC
$5.0M
Facility $5.0M
NV AVG $18.7M
Rank #43 / 44
$2.3M
Facility $2.3M
NV AVG $6.3M
Rank #43 / 44
47%
Facility 47%
NV AVG 34.9%
Rank #15 / 44
295067
Mountain View Health & Rehab
NH

Nursing Home Licensed facility providing 24/7 skilled nursing care for residents with complex, ongoing medical needs. Staffed by RNs, LPNs, and CNAs. Inspected and star-rated annually by CMS. Accepts Medicare (short-term rehab) and Medicaid (long-term care).

AL

Assisted Living A licensed, long-term care setting for seniors or individuals with disabilities who need help with daily activities — like bathing, dressing, and medication management — but not 24-hour skilled nursing. Offers housing, meals, and around-the-clock support while aiming to maximize resident independence.

Carson City
117
Facility 117
NV AVG 42
Rank #48 / 321
--2.31 -70%-35%$0248.0380
46
Facility 46
NV AVG 45
Rank #219 / 414
Shari Jordan$7.5M$3.9M52.9%115688

Frequently Asked Questions about Mountain View Health & Rehab

Is Mountain View Health & Rehab in a walkable area?

Mountain View Health & Rehab has a walk score of 46. Somewhat walkable. A few nearby services may be reachable on foot, but most trips require transportation.

Are there photos of Mountain View Health & Rehab?

Yes — there are 10 photos of Mountain View Health & Rehab in the photo gallery on this page.

What is the phone number of Mountain View Health & Rehab?

(915) 544-2002 will put you in contact with the team at Mountain View Health & Rehab.

Is Mountain View Health & Rehab Medicare or Medicaid certified?

Yes — Mountain View Health & Rehab is a CMS-certified provider of Medicare and Medicaid.

Guides for Better Senior Living

Care Cost Calculator: See Prices in Your Area

Nursing Home Data Explorer

Don’t Wait Too Long: 7 Red Flag Signs Your Parent Needs Assisted Living Now

The True Cost of Assisted Living in 2025 – And How Families Are Paying For It

Understanding Senior Living Costs: Pricing Models, Discounts & Financial Assistance

Explore Open Rooms
1 Contact details
2 What type of senior care service are you looking for?
3 What budget do you have in mind for senior care?
4 How soon do you need to find care?
5 Additional details

Thank you for your interest!

Our team will be in touch shortly to help with next steps.