


Total staff
134
Employees
107
Contractors
27
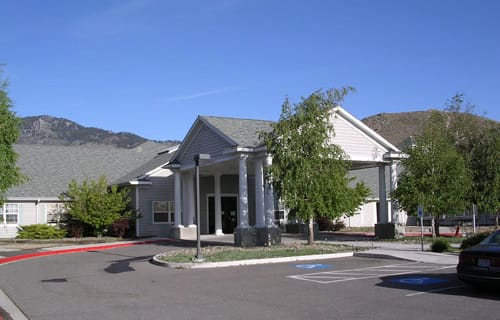


Ormsby Post Acute Rehab stands as a 120-bed skilled nursing facility in Carson City, Nevada, managed by Pacific Northwest SNF Operations Holdings (NV) LLC and licensed for Medicare and Medicaid. The facility blends short-term post-acute rehabilitation with long-term residential care.
Clinical services encompass wound management, IV therapy, diabetes control, and podiatric care delivered by a nursing staff of registered nurses, licensed practical nurses, and certified nursing assistants, supported by physical therapists. Food service customizes meals to residents’ dietary requirements. Positioned in a moderately walkable neighborhood (Walk Score 46), the facility sits near regional amenities including a golf course, city park, and Western Nevada College.
Resident demographics skew heavily toward Medicaid: 72% of the current 82-resident census rely on state coverage, while Medicare accounts for 18.3% and private pay 9.8%. The facility operates at 68.2% occupancy; 16% below Nevada’s 81.5% average, with typical stays averaging 73 days. Staffing stands at 134 personnel (107 on payroll, 27 contractors representing 8% of total hours).
Performance metrics reveal significant clinical challenges. The overall CMS rating is 1 star (66.8% below Nevada average), with health inspections rated 1 star (64.9% below state average) and quality measures 1 star (17.2% below average). Long-stay hospitalization frequency reaches 2.67 per 1,000 resident days; 47% above Nevada’s 1.82 benchmark. In May 2024, CMS imposed a $60,000 civil money penalty plus a 6-day payment denial for violations, marking the facility’s only recorded federal enforcement action.
Financially, the facility reported 2023 revenue of $5.0M against an operating deficit of $869.4K (profit margin -17.5%). It ranked 43rd of 44 Nevada SNFs on both gross revenue and payroll dollars, though payroll consumed 47% of revenue; placing it in Nevada’s top third for staff-cost investment relative to income.
| Staff type | Hours / Day / Resident | vs state avg |
|---|---|---|
|
Registered Nurse (RN)
| 49m per day | ▼ 23% State avg: 1h 4m per day · National avg: 41m per day |
|
LPN / LVN
| 48m per day | ▼ 11% State avg: 54m per day · National avg: 52m per day |
|
Nurse Aide
| 1h 55m per day | ▼ 20% State avg: 2h 23m per day · National avg: 2h 21m per day |
|
Weekend Total Nursing
| 3h 1m per day | ▼ 22% State avg: 3h 51m per day · National avg: 3h 26m per day |
|
Physical Therapist
| 0m per day | ▼ 100% State avg: 5m per day · National avg: 4m per day |
|
Weekend RN
| 36m per day | ▼ 29% State avg: 51m per day · National avg: 29m per day |
Reporting period: October 1 – December 31, 2025 (Q4 2025). Source: CMS Payroll-Based Journal report.
Manages medical care and health needs.
Assists with medical care and medications.
Helps with daily care and mobility.
Total hours from contractors
3,110 contractor hours this quarter
| Certified Nursing Assistant | 35 | 13 | 48 | 15,054 | 92 | 100% | 9.9 |
| Physical Therapist | 18 | 0 | 18 | 6,034 | 92 | 100% | 7.3 |
| Registered Nurse | 14 | 8 | 22 | 4,947 | 92 | 100% | 10.2 |
| Licensed Practical Nurse | 16 | 6 | 22 | 4,922 | 92 | 100% | 9.2 |
| RN Director of Nursing | 3 | 0 | 3 | 1,617 | 84 | 91% | 8.2 |
| Other Dietary Services Staff | 4 | 0 | 4 | 1,555 | 88 | 96% | 7.6 |
| Clinical Nurse Specialist | 4 | 0 | 4 | 1,276 | 76 | 83% | 7.7 |
| Mental Health Service Worker | 3 | 0 | 3 | 780 | 62 | 67% | 7.5 |
| Nurse Aide in Training | 5 | 0 | 5 | 632 | 40 | 43% | 9.9 |
| Occupational Therapy Aide | 1 | 0 | 1 | 520 | 63 | 68% | 8.2 |
| Nurse Practitioner | 2 | 0 | 2 | 504 | 60 | 65% | 8 |
| Dietitian | 1 | 0 | 1 | 487 | 66 | 72% | 7.4 |
| Administrator | 1 | 0 | 1 | 464 | 58 | 63% | 8 |
Includes penalties issued in 2024
Federal penalties imposed by CMS for regulatory violations, including civil money penalties (fines) and denials of payment for new Medicare/Medicaid admissions.
Source: CMS Penalties Database (Data as of Jan 2026)
Nevada average: $34K
Nevada average: 1.4
Nevada average: 0.1
Penalties are imposed by CMS for violations of federal nursing home regulations.
2 penalties in the past 3 years
Multiple penalties were reported in the last 3 years.
Last updated: Jan 2026
These measures show how residents usually do over time at this home, based on health outcomes and preventive care.
Nevada average: 9.7
Nevada average: 17.5
Nevada average: 15.6%
Nevada average: 20.8%
Nevada average: 16.9%
Nevada average: 2.5%
Nevada average: 5.5%
Nevada average: 1.4%
Nevada average: 5.4%
Nevada average: 4.2%
Nevada average: 14.1%
Nevada average: 91.0%
Nevada average: 89.6%
Nevada average: 1.82
Nevada average: 1.50
Nevada average: 83.9%
Nevada average: 2.0%
Nevada average: 80.7%
Nevada average: 23.4%
Nevada average: 9.8%
Nevada average: 0.8%
Nevada average: 53.7%
Nevada average: 50.6%
Quality measures are calculated from Minimum Data Set (MDS) assessments. For most measures, lower percentages indicate better care quality.
37% of new residents, usually for short-term rehab.
56% of new residents, often for short stays.
8% of new residents, often for long-term daily care.
Source: CMS Long-Term Care Facility Characteristics (Data as of Jan 2026)
Residents meet regularly to discuss policies, care quality, and activities
Organized group of residents that meets regularly to discuss facility policies, quality of life, and activities.
Data sourced from CMS Long-Term Care Facility Characteristics quarterly report. Payer mix reflects the current resident census by primary payment source.
Historical financial and operational data for Ormsby Post Acute Rehab from 2011–2022, based on CMS SNF Cost Reports.
Key figures below are for fiscal year ending in 12/2022 — the home's most recent complete cost report, an older period than most facilities report.
Based on the home's most recent complete CMS SNF Cost Report — fiscal year ending in 12/2022. This is an older period than most facilities report, so compare with that in mind.
This home supports both short-term rehab and long-term care, with residents staying for a wide range of durations.
Most new residents arrive under private pay (56% of admissions), and a typical private pay stay runs around 1 - 2 months.
Coverage residents most often arrive under.
Coverage residents most often leave under.
Ormsby Post Acute Rehab is located in Carson City, Nevada.
Here are the financial assistance programs available to residents in Nevada.
Ormsby Post Acute Rehab has a walk score of 46. Somewhat walkable. A few nearby services may be reachable on foot, but most trips require transportation.
Ormsby Post Acute Rehab's occupancy is 68.2%.
No, Ormsby Post Acute Rehab has a no-pet policy.
Ormsby Post Acute Rehab is registered as a for-profit.
Yes — there are 3 photos of Ormsby Post Acute Rehab in the photo gallery on this page.
(775) 841-4646 will put you in contact with the team at Ormsby Post Acute Rehab.
Yes — Ormsby Post Acute Rehab is a CMS-certified provider of Medicare and Medicaid.
Care Cost Calculator: See Prices in Your Area
Nursing Home Data Explorer
Don’t Wait Too Long: 7 Red Flag Signs Your Parent Needs Assisted Living Now
The True Cost of Assisted Living in 2025 – And How Families Are Paying For It
Understanding Senior Living Costs: Pricing Models, Discounts & Financial Assistance


