Neville Center at Fresh Pond

Nursing Home in Cambridge

CMS overall rating Info The Overall CMS Rating is scored from 1 to 5 stars and combines results from health inspections, staffing levels, and quality measures. Health inspections carry the most weight. Staffing and quality scores can increase or decrease the final rating based on performance compared to state and national standards.
Calculator: See prices in your area
Neville Center at Fresh Pond accepts Medicare, Medicaid, and private pay.

Overview of Neville Center at Fresh Pond

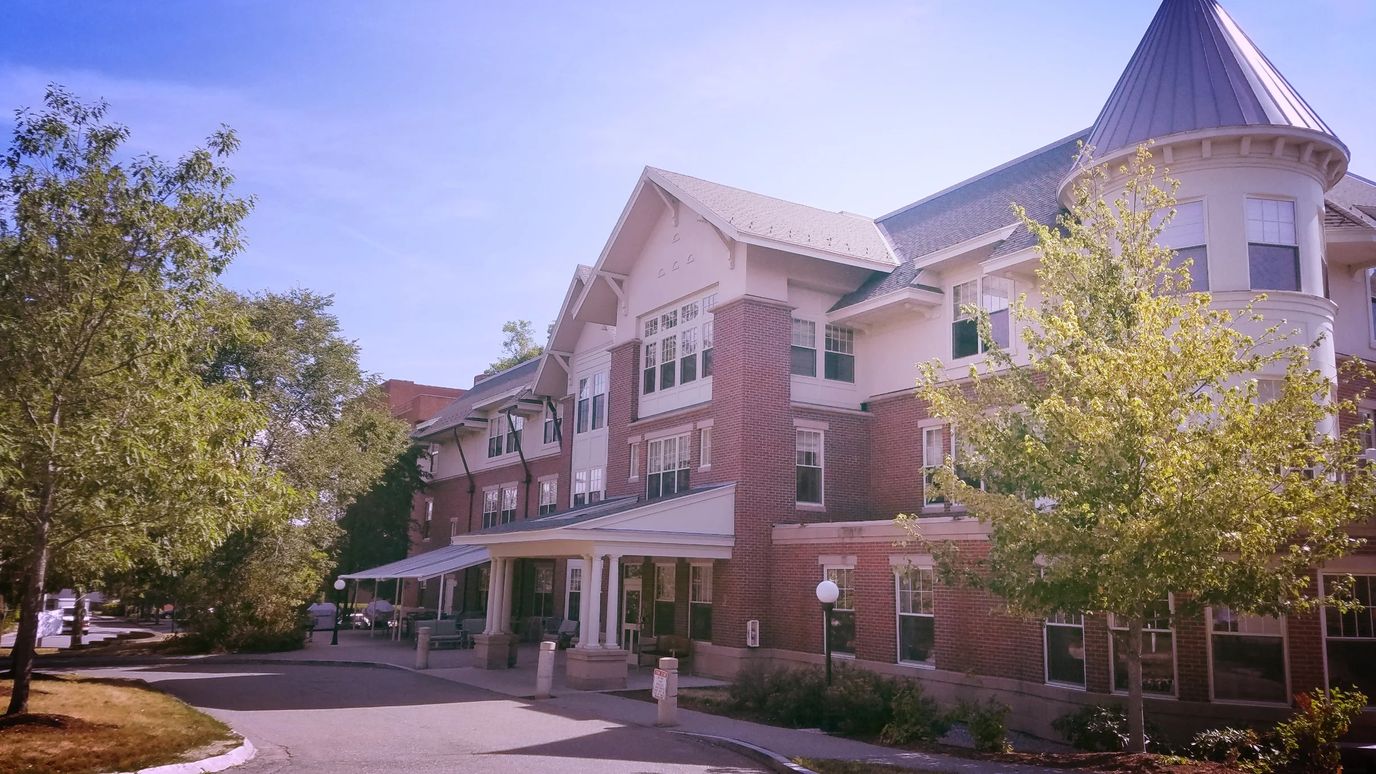
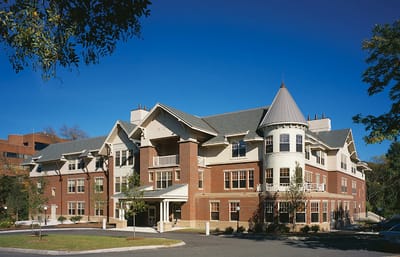
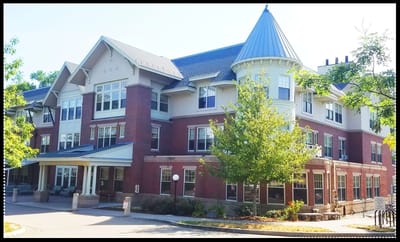
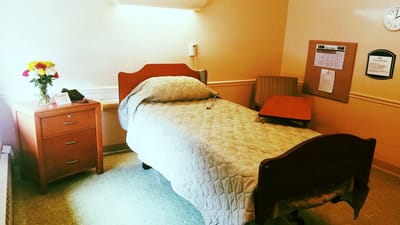
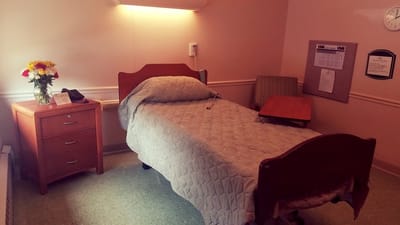
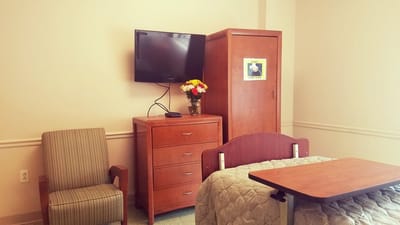
Located in the heart of Cambridge, Massachusetts, the Neville Center at Fresh Pond is renowned for its exceptional care services. With a track record of achievements, this facility offers a range of options including short-term rehabilitation, long-term care, and various recreational activities. Spacious rooms await residents, and the dining experience is of top-notch quality, complete with amenities that enhance the senior living experience.

Their guiding principle is a strong commitment to comfort and joy. Taking a holistic approach, they emphasize a pulmonary program and even have an in-house beauty salon. At the core of their offerings is the Ageless Grace program, designed to empower mature adults in their pursuit of health and happiness. Through this initiative, cognitive decline is addressed, and individuals experience renewed vitality, promoting the concept of neuroplasticity. The Neville Center is a place where comprehensive care, comfort, and well-being come together to enrich the lives of residents.

(617) 497-0600

Quality ratings

Measured by Centers for Medicare & Medicaid Services (CMS)

Overall rating Info The Overall CMS Rating combines results from health inspections, staffing levels and quality measures. Health inspections carry the most weight. Staffing and quality scores can increase or decrease the final rating based on performance compared to state and national standards.
4/5 ▲ 1.1 Massachusetts average: 2.9/5
Health Inspection Info Based on the results of the facility's three most recent standard inspections and any complaint investigations. CMS reviews the number, scope, and severity of deficiencies, with more recent findings weighted more heavily.
4/5 ▲ 1.2 Massachusetts average: 2.8/5
Staffing Info Measures average nursing staff hours per resident per day, including Registered Nurses (RNs) and total nursing staff. Ratings are adjusted based on the level of care residents require and are compared to state and national benchmarks.
3/5 ■ Avg Massachusetts average: 3.0/5
Quality Measures Info Based on clinical and physical health indicators reported to CMS, such as hospital readmissions, falls, pressure ulcers, and improvements in mobility. These measures reflect how well residents' health needs are being managed.
4/5 ▲ 0.8 Massachusetts average: 3.2/5

Staffing hours breakdown

Info Daily nursing hours per resident by staff type, reported to CMS. Higher is generally better — compare this facility to state and national averages to see where staffing stands.

Hours per resident per day — compared to Massachusetts state averages

Total nursing care / resident Info This home is ranked 18th out of 58 homes in Massachusetts.

Total adjusted nursing hours per resident per day, combining RN, LPN, and aide time. CMS adjusts this for case-mix so facilities can be fairly compared.
4h 12m per day
Rank #18 / 58Nurse hours — state benchmarkedThis home is ranked 18th out of 58 homes in Massachusetts.Shows adjusted nurse hours per resident per day benchmarked to the Massachusetts average, with a ranking across 58 Massachusetts SNFs. More hours mean more direct care. The national average is about 3.5 hrs; below 3.0 is a red flag.
This facility Massachusetts avg (3h 56m per day)
vs Massachusetts avg
+7%

1 of 6 metrics below state avg

Standout metric Physical Therapist is +200% above state avg
Staff typeHours / dayvs state avg
Registered Nurse (RN) Info RNs hold the highest nursing license and can assess residents, interpret test results, and direct care plans. More RN hours per day often signals stronger clinical oversight and faster response to health changes. 56m per day ▲ 44% State avg: 39m per day · National avg: 41m per day
LPN / LVN Info Licensed Practical Nurses (LPNs) or Licensed Vocational Nurses (LVNs) deliver routine hands-on care — medication administration, wound dressing, and monitoring vital signs. They work under RN supervision and make up a large share of daily bedside care. 1h 11m per day ▲ 22% State avg: 58m per day · National avg: 52m per day
Nurse Aide Info Certified Nurse Aides (CNAs) provide the most direct day-to-day assistance: bathing, dressing, feeding, and mobility. Nurse aide hours are typically the largest staffing category and directly affect residents' quality of life. 2h 7m per day ▼ 7% State avg: 2h 16m per day · National avg: 2h 21m per day
Total Nursing (Weekend) Info Combined nursing hours (RN + LPN + Nurse Aide) per resident per day on weekends. Staffing often drops on weekends — this figure reveals whether the facility maintains adequate coverage outside of weekday hours. 3h 44m per day ▲ 8% State avg: 3h 27m per day · National avg: 3h 26m per day
Physical Therapist Info Hours per resident per day provided by licensed Physical Therapists (PTs) or PT Assistants. PT services help residents recover mobility after injury or illness and are especially important for post-acute (short-stay) rehabilitation. 12m per day ▲ 200% State avg: 4m per day · National avg: 4m per day
RN (Weekend) Info Registered nurse hours specifically on weekends. Facilities sometimes reduce RN presence on Saturdays and Sundays — a low weekend RN figure compared to weekday hours can indicate reduced clinical oversight when most administrative staff are absent. 29m per day ▲ 4% State avg: 28m per day · National avg: 29m per day

Capacity and availability

This home usually has limited availability

Occupancy between 85% and 95% suggests balanced demand.

Higher occupancy than the Massachusetts average: 82%
Occupancy rate 92.1% Rank #13 / 59Occupancy rate — state benchmarkedThis home is ranked 13th out of 59 homes in Massachusetts.Shows this facility's occupancy rate versus the Massachusetts average, with its statewide rank out of 59. Higher occupancy signals strong local demand and financial stability.
Avg. Length of Stay 75 days
Occupancy rate
92.1% Rank #13 / 59Occupancy rate — state benchmarkedThis home is ranked 13th out of 59 homes in Massachusetts.Shows this facility's occupancy rate versus the Massachusetts average, with its statewide rank out of 59. Higher occupancy signals strong local demand and financial stability.
Avg. Length of Stay
75 days

Who this home usually serves

TYPE OF STAY

Mostly short-term rehab stays

Most residents typically stay for a few weeks or months before returning home or moving on.

Breakdown by payment type

Medicare

71% of new residents, usually for short-term rehab.

Typical stay 25 days

Private pay

28% of new residents, often for short stays.

Typical stay 1 - 2 months

Medicaid

1% of new residents, often for long-term daily care.

Typical stay 11 years

Finances and operations

Voluntary non-profit community
Home revenue
$23.6M
Operating deficit
-$1.2M
Voluntary non-profit community
Home revenue
$23.6M Rank #18 / 60Revenue — state benchmarkedThis home is ranked 18th out of 60 homes in Massachusetts.Shows this facility's annual revenue compared to the Massachusetts SNF average. Higher revenue generally means more resources for staffing and capital — read alongside Payroll %.
Operating deficit
-$1.2M
Payroll costs Info The portion of the home's budget spent on staff, including nurses, caregivers, and other employees who support care and operations. Rank #15 / 60Payroll — state benchmarkedThis home is ranked 15th out of 60 homes in Massachusetts.Shows total annual staff payroll benchmarked to the Massachusetts average. Higher payroll investment relative to peers often signals better staffing and less reliance on cheaper contract labor.
$10.3M
43.7% of revenue Rank #24 / 60Payroll % — state benchmarkedThis home is ranked 24th out of 60 homes in Massachusetts.Shows payroll as a percentage of revenue versus the Massachusetts average. Well-run SNFs often land around 55–65%. Below 25% may signal understaffing or heavy agency use — read with Staffing ratings.
Other operating costs Info All remaining costs needed to run the home, such as food, utilities, building maintenance, supplies and administrative expenses.
$14.5M
Total costs $24.8M
Walk Score
Walk Score: 63 / 100 Rank #24 / 55Walk Score — state benchmarkedThis home is ranked 24th out of 55 homes in Massachusetts.Shows how walkable this facility's neighborhood is compared to the average Walk Score across Massachusetts SNFs. Higher scores benefit residents, families, and staff.
Moderately walkable. Some errands can be accomplished on foot, with a mix of nearby amenities.

About this community

Payment & Insurance

1 service
Accept Medicaid

Therapy & Rehabilitation

3 services
Rehabilitation Services
Respite Care
Short-Term Rehab

Additional Services

2 services
Hospice
Palliative Care

Additional Policies & Features

Pets Allowed

Amenities & Lifestyle

Dining
Recreational Facilities
Spacious Rooms
Specific ProgramsAgeless Grace, Holistic Rehabilitation, Long Term Care, Pulmonary Program, Recreation, Short Term Rehabilitation

Dining & Nutrition

Food DescriptionTasty and nutritious meals

Types of Care at Neville Center at Fresh Pond

Assisted Living Memory Care Skilled Nursing

Contact Neville Center at Fresh Pond

Health Inspection History

Inspections
Total health inspections 4

Massachusetts average 4.5


Last Health inspection on May 2025

Total health citations
20 Rank #17 / 57Health citations — state benchmarkedThis home is ranked 17th out of 57 homes in Massachusetts.Shows this facility's total health deficiency citations benchmarked to the Massachusetts state average, with a ranking across all 57 MA SNFs. Lower citation counts earn a better rank.

Massachusetts average 32.7

Citations per inspection
5 Rank #18 / 57Citations per inspection — state benchmarkedThis home is ranked 18th out of 57 homes in Massachusetts.Shows average deficiency citations per CMS inspection for this facility versus the Massachusetts mean across 57 SNFs with citation data. Lower is better.

Massachusetts average 7.24


Health citations are formal notices following inspections when they fail to comply with safety and care standards.

19 of 20 citations resulted from standard inspections; and 1 of 20 resulted from complaint investigations.

Breakdown of citation severity (last 3 years)
Critical Health citations More info
0
100% better than Massachusetts average

Massachusetts average: 0.3


Serious Health citations More info 0
100% better than Massachusetts average

Massachusetts average: 1.5

0 critical citations More info Massachusetts average: 0.3

0 serious citations More info Massachusetts average: 1.5

20 moderate citations More info Massachusetts average: 29.7

0 minor citations More info Massachusetts average: 1.3
Citations history (last 3 years)
Pharmacy moderate citation Info Issues related to medication management, including how drugs are stored, administered, and monitored. May 28, 2025
Corrected

Pharmacy moderate citation Info Issues related to medication management, including how drugs are stored, administered, and monitored. May 28, 2025
Corrected

Quality of Care moderate citation Info Issues related to how well residents receive appropriate treatment and support for their medical and daily care needs. May 28, 2025
Corrected

Quality of Care moderate citation Info Issues related to how well residents receive appropriate treatment and support for their medical and daily care needs. May 28, 2025
Corrected

Financial Assistance for
Nursing Home in Massachusetts

Neville Center at Fresh Pond is located in Cambridge, Massachusetts.
Here are the financial assistance programs available to residents in Massachusetts.

Get Financial aid guidance

Home Care Program

MassHealth Home Care

Age 60+
General Massachusetts resident, at risk of nursing home placement.
Income Limits (2025) ~$1,500/month individual, varies by region
Asset Limits $2,000 individual, excludes home, car
MA

Coordinated through Aging Services Access Points (ASAPs); high demand in urban areas.

Benefits
In-home care (3-5 hours/day) Homemaker services Respite care (up to 14 days/year) Adult day care (~$75/day)

Frail Elder Waiver

Massachusetts Medicaid FE Waiver

Age 65+
General Massachusetts resident, Medicaid-eligible, nursing home-level care need.
Income Limits (2025) ~$2,829/month 300% FBR, individual
Asset Limits $2,000 (individual), $3,000 (couple).
MA

Requires clinical eligibility determination.

Benefits
Personal care (5-7 hours/day) Respite care (240 hours/year) Adult day care (~$75/day) Home health services

Senior Care Options (SCO)

Massachusetts Senior Care Options

Age 65+
General Massachusetts resident, eligible for MassHealth (Medicare optional), nursing home-level care need.
Income Limits (2025) ~$2,829/month (300% FBR, individual); QIT allowed.
Asset Limits $2,000 (individual), $3,000 (couple) (excludes home up to $713,000, car).
MA

Not available in Dukes/Nantucket Counties; multiple SCO providers (e.g., CCA, Tufts).

Benefits
Personal care (5-7 hours/day) Medical care Respite (240 hours/year) Adult

Medicare Savings Program (MSP)

Massachusetts Medicare Savings Program (MassHealth Buy-In)

Age 65+ or disabled
General Massachusetts resident, Medicare Part A/B.
Income Limits (2025) ~$2,510/month (QMB), ~$3,380/month (SLMB), ~$3,598/month (QI)—individual.
Asset Limits $9,430 (individual), $14,130 (couple).
MA

Three tiers; no waitlist; includes Extra Help for Part D.

Benefits
Covers Part B premiums ($174.70/month) Deductibles ($240/year) Copays (~20%)

National Family Caregiver Support Program (NFCSP) Respite

Massachusetts NFCSP Respite Care

Age
General Caregivers of 60+ needing care or 55+ caregivers of others; Massachusetts resident; functional needs (2+ ADLs).
Income Limits (2025) Prioritizes ~$24,980/year (individual); no strict cap.
Asset Limits Not assessed; need-based.
MA

27 ASAPs; prioritizes low-income, rural caregivers.

Benefits
Respite (4-6 hours/week or 5 days/year) Adult day care ($60/day) Caregiver training Supplies (~$500/year)

Prescription Advantage

Massachusetts Prescription Advantage

Age 65+ or disabled
General Massachusetts resident, enrolled in Medicare Part D (or ineligible for Medicare).
Income Limits (2025) No strict limit; copays vary by income ~$24,980-$75,000/year individual
Asset Limits Not assessed.
MA

Supplements Medicare Part D; no enrollment fee for low-income.

Benefits
Covers prescription copays ($5-$40/drug) Fills coverage gaps Catastrophic cost protection ($4,000+ covered)

Senior Community Service Employment Program (SCSEP)

Massachusetts SCSEP

Age 55+
General unemployed, low-income, Massachusetts resident.
Income Limits (2025) ~$1,983/month 125% FPL
Asset Limits Not specified; income-focused.
MA

Priority for veterans, rural residents; AARP partnership.

Benefits
Paid training (~20 hours/week at ~$15/hour) Job placement

VA Aid and Attendance (A&A) and Housebound Benefits

Massachusetts VA Aid and Attendance/Housebound

Age 65+ or disabled veteran/spouse
General Massachusetts resident, wartime service, need for ADL help (A&A) or homebound.
Income Limits (2025) Net income < ~$1,984/month (veteran with dependent, A&A); pension offsets income.
Asset Limits ~$155,356 net worth limit
MA

High veteran demand statewide.

Benefits
Cash (~$1,433-$2,642/month veteran, ~$951-$1,318 spouse) for care costs (e.g., in-home, assisted living)

Places of interest near Neville Center at Fresh Pond

Address 2.6 miles from city center Info Estimated distance in miles from Cambridge's city center to Neville Center at Fresh Pond's address, calculated via Google Maps. — 2.2 miles to nearest hospital (McLean Hospital)

Calculate Travel Distance to Neville Center at Fresh Pond

Add your location

Address

Staffing Data (Q2 2025)

This data corresponds to Q2 2025 and is based on CMS Payroll-Based Journal.

Total staff 176
Employees 152
Contractors 24
Staff to resident ratio 1.89:1
11% better than Massachusetts average

Massachusetts average ratio: 1.70:1

Avg staff/day 60
Average shift 8.6 hours
9% better than Massachusetts average

Massachusetts average: 7.9 hours

Total staff hours (quarter) 47,060
Nursing staff breakdown
Registered Nurse

Manages medical care and health needs.

Total count 21
Average shift length Info Average shift length. Calculated as total hours divided by days worked and average staff per day. 9.5 hours

No contractors work on this role.

Licensed Practical Nurse

Assists with medical care and medications.

Total count 24
Average shift length Info Average shift length. Calculated as total hours divided by days worked and average staff per day. 10.7 hours

No contractors work on this role.

Certified Nursing Assistant

Helps with daily care and mobility.

Total count 60
Average shift length Info Average shift length. Calculated as total hours divided by days worked and average staff per day. 8.8 hours

No contractors work on this role.

Contractor staffing

Total hours from contractors

1.7%

823 contractor hours this quarter

Mental Health Service Worker: 6 Other Physician: 5 Medical Director: 4 Qualified Activities Professional: 4 Occupational Therapy Assistant: 3 Other Dietary Services Staff: 2
Staff by category
Certified Nursing Assistant6006018,32991100%8.8
Licensed Practical Nurse240249,37091100%10.7
Registered Nurse210216,65691100%9.5
Respiratory Therapy Technician100102,1948290%7.7
Physical Therapy Assistant8081,8959099%7.5
Clinical Nurse Specialist5051,6166470%8.3
Mental Health Service Worker46101,2797380%6
Speech Language Pathologist5051,2417178%7.8
Qualified Social Worker5058327178%6.9
Other Dietary Services Staff2248228391%7
Administrator2025126470%8
Occupational Therapy Aide2024916268%7.9
Physical Therapy Aide1014265662%7.6
Dietitian1013684651%8
Therapeutic Recreation Specialist1013284246%7.8
Medical Director0443064246%6.1
Nurse Practitioner1011602022%8
Qualified Activities Professional044913033%2.9
Other Physician055881516%3.7
Occupational Therapy Assistant033575055%1
60 Certified Nursing Assistant
% of Days 100%
24 Licensed Practical Nurse
% of Days 100%
21 Registered Nurse
% of Days 100%
10 Respiratory Therapy Technician
% of Days 90%
8 Physical Therapy Assistant
% of Days 99%
5 Clinical Nurse Specialist
% of Days 70%
10 Mental Health Service Worker
% of Days 80%
5 Speech Language Pathologist
% of Days 78%
5 Qualified Social Worker
% of Days 78%
4 Other Dietary Services Staff
% of Days 91%
2 Administrator
% of Days 70%
2 Occupational Therapy Aide
% of Days 68%
1 Physical Therapy Aide
% of Days 62%
1 Dietitian
% of Days 51%
1 Therapeutic Recreation Specialist
% of Days 46%
4 Medical Director
% of Days 46%
1 Nurse Practitioner
% of Days 22%
4 Qualified Activities Professional
% of Days 33%
5 Other Physician
% of Days 16%
3 Occupational Therapy Assistant
% of Days 55%

Facility Characteristics

Source: CMS Long-Term Care Facility Characteristics (Data as of Jan 2026)

Total residents 93
Medicare
28
30.1% of residents
Medicaid
42
45.2% of residents
Private pay or other
23
24.7% of residents
Programs & Services
Residents Group

Residents meet regularly to discuss policies, care quality, and activities

Active Resident Council

Organized group of residents that meets regularly to discuss facility policies, quality of life, and activities.

Quality of care over time

These measures show how residents usually do over time at this home, based on health outcomes and preventive care.

High-risk clinical events score Info A composite score based on pressure ulcers, falls with injury, weight loss, walking ability decline, and activities of daily living decline. 6.3
39% better than Massachusetts average

Massachusetts average: 10.2

Functional decline score Info A composite score based on activities of daily living decline, walking ability decline, and incontinence. 10.6
47% better than Massachusetts average

Massachusetts average: 20.0

Long-stay resident measures
Above average Massachusetts avg: 3.6 Info CMS star rating based on long-stay quality measure performance. 5 stars = significantly above average, 1 star = significantly below average.
Need for Help with Daily Activities Increased Info Percent of long-stay residents whose need for help with daily activities has increased 9.6%
49% better than Massachusetts average

Massachusetts average: 18.7%

Walking Ability Worsened Info Percent of long-stay residents whose ability to move independently worsened 8.6%
56% better than Massachusetts average

Massachusetts average: 19.3%

Low Risk Residents with Bowel/Bladder Incontinence Info Percent of low risk long-stay residents who lose control of their bowels or bladder 13.5%
39% better than Massachusetts average

Massachusetts average: 22.1%

Falls with Major Injury Info Percent of long-stay residents experiencing one or more falls with major injury 1.6%
56% better than Massachusetts average

Massachusetts average: 3.6%

High Risk Residents with Pressure Ulcers Info Percent of long-stay high risk residents with pressure ulcers 5.8%
24% worse than Massachusetts average

Massachusetts average: 4.7%

Urinary Tract Infection Info Percent of long-stay residents with a urinary tract infection 4.1%
96% worse than Massachusetts average

Massachusetts average: 2.1%

Lost Too Much Weight Info Percent of long-stay residents who lose too much weight 5.8%
12% worse than Massachusetts average

Massachusetts average: 5.2%

Depressive Symptoms Info Percent of long-stay residents who have depressive symptoms 2.7%
74% better than Massachusetts average

Massachusetts average: 10.7%

Antipsychotic Use Info Percent of long-stay residents who received an antipsychotic medication 17.6%
13% better than Massachusetts average

Massachusetts average: 20.3%

Pneumococcal Vaccine Info Percent of long-stay residents assessed and appropriately given the pneumococcal vaccine 96.5%
5% better than Massachusetts average

Massachusetts average: 91.9%

Influenza Vaccine Info Percent of long-stay residents assessed and appropriately given the seasonal influenza vaccine 100.0%
5% better than Massachusetts average

Massachusetts average: 94.8%

Hospitalizations per 1,000 days Info Number of hospitalizations per 1,000 long-stay resident days. 2.08
12% worse than Massachusetts average

Massachusetts average: 1.86

ED visits per 1,000 days Info Number of outpatient emergency department visits per 1,000 long-stay resident days. 1.39
10% better than Massachusetts average

Massachusetts average: 1.54

Short-stay resident measures
Above average Massachusetts avg: 3.2 Info CMS star rating based on short-stay quality measure performance. 5 stars = much above average, 1 star = much below average.
Pneumococcal Vaccine Info Percent of short-stay residents assessed and appropriately given the pneumococcal vaccine 91.8%
20% better than Massachusetts average

Massachusetts average: 76.7%

Antipsychotic medication increase Info Percent of short-stay residents who newly received an antipsychotic medication 0.6%
53% better than Massachusetts average

Massachusetts average: 1.3%

Influenza Vaccine Info Percent of short-stay residents assessed and appropriately given the seasonal influenza vaccine 93.3%
20% better than Massachusetts average

Massachusetts average: 77.7%

Re-hospitalized after SNF stay Info Percentage of short-stay residents who were re-hospitalized after their nursing home admission. 27.2%
5% worse than Massachusetts average

Massachusetts average: 25.8%

Emergency department visits Info Percentage of short-stay residents who had an outpatient emergency department visit. 5.5%
53% better than Massachusetts average

Massachusetts average: 11.8%

Falls with major injury Info Percentage of SNF residents who experience falls with major injury during their stay. 0.3%
65% better than Massachusetts average

Massachusetts average: 0.8%

Ability to care for self at discharge Info Percentage of residents at or above expected ability to care for themselves at discharge. 40.9%
24% worse than Massachusetts average

Massachusetts average: 53.7%

Successful return to home or community Info Rate of successful return to home or community from a skilled nursing facility. 61.8%
22% better than Massachusetts average

Massachusetts average: 50.6%

Penalties and fines

Federal penalties imposed by CMS for regulatory violations, including civil money penalties (fines) and denials of payment for new Medicare/Medicaid admissions.

Source: CMS Penalties Database

Penalty History

Penalties are imposed by CMS for violations of federal nursing home regulations.

No penalties in the past 3 years

No civil money penalties or payment denials were reported in the last 3 years.

Compare Nursing Homes around Cambridge The information below is reported by the Massachusetts Executive Office of Elder Affairs and Department of Public Health.

5 facilities compared · CMS & MA Dept. of Health data · Updated Apr 2026

Filter by care type
Spaulding Nursing and Therapy Center in Brighton
NH

Nursing Home Licensed facility providing 24/7 skilled nursing care for residents with complex, ongoing medical needs. Staffed by RNs, LPNs, and CNAs. Inspected and star-rated annually by CMS. Accepts Medicare (short-term rehab) and Medicaid (long-term care).

AL

Assisted Living A licensed, long-term care setting for seniors or individuals with disabilities who need help with daily activities — like bathing, dressing, and medication management — but not 24-hour skilled nursing. Offers housing, meals, and around-the-clock support while aiming to maximize resident independence.

N

Nursing

Allston (Brighton)123 61.9% -24%8.86 +96%+125%172.3190 91 Mass General Brigham Incorporated$52.0M$18.8M36.2%225014
Cambridge Rehabilitation & Nursing Center
NH

Nursing Home Licensed facility providing 24/7 skilled nursing care for residents with complex, ongoing medical needs. Staffed by RNs, LPNs, and CNAs. Inspected and star-rated annually by CMS. Accepts Medicare (short-term rehab) and Medicaid (long-term care).

AL

Assisted Living A licensed, long-term care setting for seniors or individuals with disabilities who need help with daily activities — like bathing, dressing, and medication management — but not 24-hour skilled nursing. Offers housing, meals, and around-the-clock support while aiming to maximize resident independence.

HC

Home Care Professional care delivered in the person's own home — from companionship and errands to skilled nursing and therapy. Allows seniors to age in place. Medicare covers skilled home health when medically necessary.

N

Nursing

Cambridge (Mid-Cambridge)83 89.3% +9%4.07 +31%+4%0227.3076 95 Cambridge Center Holdings Llc$18.6M$5.1M27.6%225520
Neville Center at Fresh Pond
NH

Nursing Home Licensed facility providing 24/7 skilled nursing care for residents with complex, ongoing medical needs. Staffed by RNs, LPNs, and CNAs. Inspected and star-rated annually by CMS. Accepts Medicare (short-term rehab) and Medicaid (long-term care).

AL

Assisted Living A licensed, long-term care setting for seniors or individuals with disabilities who need help with daily activities — like bathing, dressing, and medication management — but not 24-hour skilled nursing. Offers housing, meals, and around-the-clock support while aiming to maximize resident independence.

MC

Memory Care Secured, specialized care for people living with Alzheimer's or dementia. Staff trained in cognitive impairment, with higher staff-to-resident ratios and an environment designed to reduce confusion and wandering risk.

N

Nursing

Cambridge (Cambridge Highlands)112 92.1% +12%4.21 -8%+7%0205.0092 63 Neville Communities Home Inc$23.6M$10.3M43.7%225378
Sancta Maria
NH

Nursing Home Licensed facility providing 24/7 skilled nursing care for residents with complex, ongoing medical needs. Staffed by RNs, LPNs, and CNAs. Inspected and star-rated annually by CMS. Accepts Medicare (short-term rehab) and Medicaid (long-term care).

AL

Assisted Living A licensed, long-term care setting for seniors or individuals with disabilities who need help with daily activities — like bathing, dressing, and medication management — but not 24-hour skilled nursing. Offers housing, meals, and around-the-clock support while aiming to maximize resident independence.

N

Nursing

Cambridge (Cambridge Highlands)136 93.8% +14%4.08 -2%+4%13812.70127 68 Dubois, Amber$28.8M$11.7M40.6%225573
Watertown Rehabilitation and Nursing Center
NH

Nursing Home Licensed facility providing 24/7 skilled nursing care for residents with complex, ongoing medical needs. Staffed by RNs, LPNs, and CNAs. Inspected and star-rated annually by CMS. Accepts Medicare (short-term rehab) and Medicaid (long-term care).

HC

Home Care Professional care delivered in the person's own home — from companionship and errands to skilled nursing and therapy. Allows seniors to age in place. Medicare covers skilled home health when medically necessary.

N

Nursing

Watertown (East Watertown)158 66.2% -19%2.81 +82%-29%2606.71124 78 Watertown Rehab Holdco Llc$19.7M$6.0M30.6%225425

Guides for Better Senior Living

Care Cost Calculator: See Prices in Your Area

Nursing Home Data Explorer

Don’t Wait Too Long: 7 Red Flag Signs Your Parent Needs Assisted Living Now

The True Cost of Assisted Living in 2025 – And How Families Are Paying For It

Understanding Senior Living Costs: Pricing Models, Discounts & Financial Assistance

Explore Open Rooms
1 Contact details
2 What type of senior care service are you looking for?
3 What budget do you have in mind for senior care?
4 How soon do you need to find care?
5 Additional details

Thank you for your interest!

Our team will be in touch shortly to help with next steps.