New Orange Hills
CMS overall rating Info CMS (the Centers for Medicare & Medicaid Services) is the federal agency that rates nursing home quality. Its Overall Rating runs from 1 to 5 stars, combining health inspections, staffing, and quality measures, with inspections weighted most heavily.

New Orange Hills

CMS overall rating Info CMS (the Centers for Medicare & Medicaid Services) is the federal agency that rates nursing home quality. Its Overall Rating runs from 1 to 5 stars, combining health inspections, staffing, and quality measures, with inspections weighted most heavily.
Calculator: See prices in your area
New Orange Hills accepts Medicare, Medicaid, and private pay.

Overview of New Orange Hills

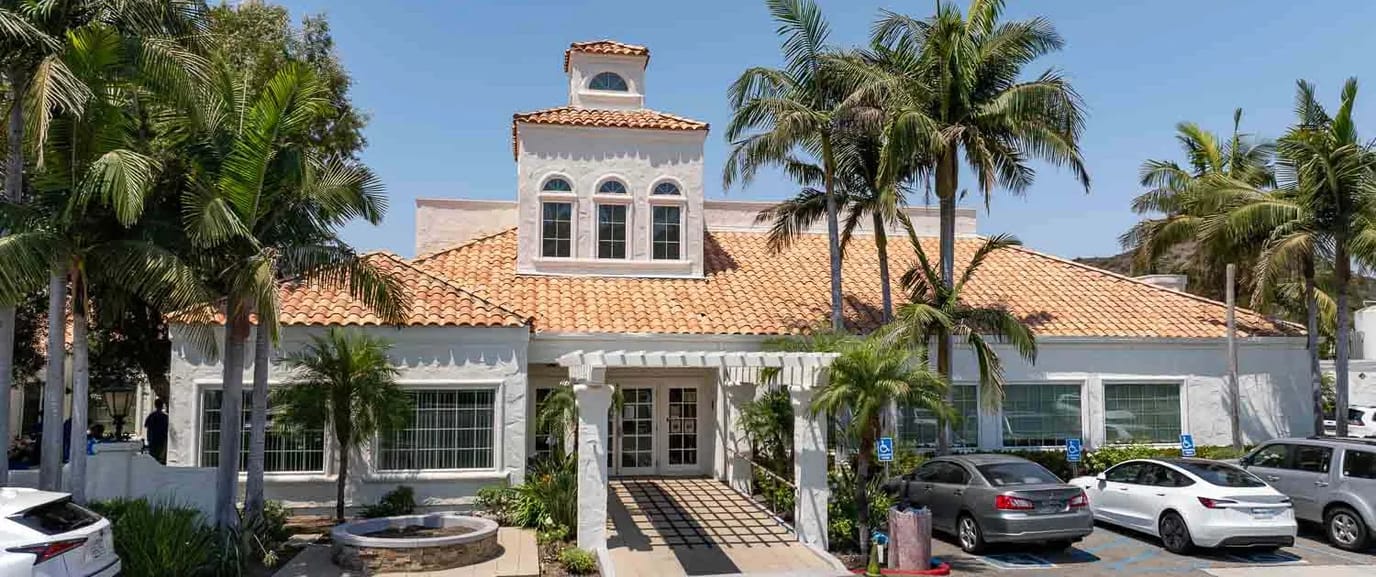
New Orange Hills is a well-recognized nursing home in Orange, CA, offering long-term care, rehabilitation, and skilled nursing. Here, older adults can ease their worries in a nurturing, welcoming environment. Residents also experience worry-free living, with 24-hour care, nutritious meals, and recreational activities. Working closely with residents, their families, and physicians, the community provides top-notch care tailored to their unique needs and preferences.

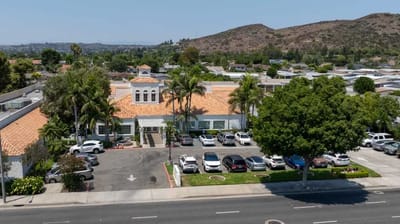
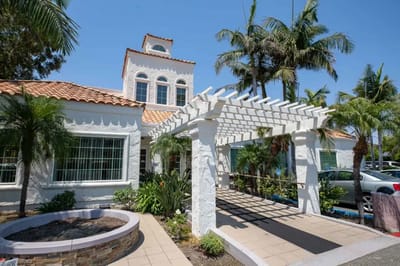
Arts and crafts, lecture series, and ice cream socials provide residents with more opportunities to continue learning and stay active. Well-lit spaces, innovative rehabilitation equipment, and thoughtfully curated amenities also ensure residents can focus on their recovery. Situated in the quiet residential area of Orange, near bus stops, the community guarantees a laid-back lifestyle. This nursing home is a good option for senior living in California, especially with its dedicated services and top-notch amenities.

Quality ratings

Measured by Centers for Medicare & Medicaid Services (CMS)

Overall rating Info The Overall CMS Rating combines results from health inspections, staffing levels and quality measures. Health inspections carry the most weight. Staffing and quality scores can increase or decrease the final rating based on performance compared to state and national standards.
▼ 68.2% Below CA avg. ▼ 68.2% Below CA avg.CA average: 3.1Click the badge to see the full State ranking.Click here to see the full State ranking.
Health Inspection Info Based on the results of the facility's three most recent standard inspections and any complaint investigations. CMS reviews the number, scope, and severity of deficiencies, with more recent findings weighted more heavily.
▼ 28.5% Below CA avg. ▼ 28.5% Below CA avg.CA average: 2.8Click the badge to see the full State ranking.Click here to see the full State ranking.
Staffing Info Measures average nursing staff hours per resident per day, including Registered Nurses (RNs) and total nursing staff. Ratings are adjusted based on the level of care residents require and are compared to state and national benchmarks.
▼ 68.1% Below CA avg. ▼ 68.1% Below CA avg.CA average: 3.1Click the badge to see the full State ranking.Click here to see the full State ranking.
Quality Measures Info Based on clinical and physical health indicators reported to CMS, such as hospital readmissions, falls, pressure ulcers, and improvements in mobility. These measures reflect how well residents' health needs are being managed.
▼ 26.6% Below CA avg. ▼ 26.6% Below CA avg.CA average: 4.1Click the badge to see the full State ranking.Click here to see the full State ranking.

Staffing hours breakdown

Info Daily nursing hours per resident by staff type, reported to CMS. Higher is generally better — compare this facility to state and national averages to see where staffing stands.

Hours per resident per day — compared to California state averages

Total nursing care / resident Info This home is ranked 336th out of 354 homes in California for nurse hours. Total adjusted nursing hours per resident per day, combining RN, LPN, and aide time. CMS adjusts this for case-mix so facilities can be fairly compared.
3h 13m per day
Rank #336 / 354Nurse hours — State benchmarkedThis home is ranked 336th out of 354 homes in California. Shows adjusted nurse hours per resident per day benchmarked to the California average, with a ranking across 354 California facilities. More hours mean more direct care. The national average is about 3.5 hrs; below 3.0 is a red flag.Rankings are based only on facilities in California that report data for that category. Facilities without available data are excluded from the ranking.Click the rank badge to see the full State ranking.Click here to see the full State ranking.
This facility California avg (4h 13m per day)
vs California avg
-24%

3 of 6 metrics below state avg

Standout metric LPN / LVN is +74% above state avg
Staff typeHours / Day / Residentvs state avg
Registered Nurse (RN) Info RNs hold the highest nursing license and can assess residents, interpret test results, and direct care plans. More RN hours per day often signals stronger clinical oversight and faster response to health changes. 30m per day ▼ 23% State avg: 39m per day · National avg: 41m per day
LPN / LVN Info Licensed Practical Nurses (LPNs) or Licensed Vocational Nurses (LVNs) deliver routine hands-on care — medication administration, wound dressing, and monitoring vital signs. They work under RN supervision and make up a large share of daily bedside care. 2h 7m per day ▲ 74% State avg: 1h 13m per day · National avg: 52m per day
Nurse Aide Info Certified Nurse Aides (CNAs) provide the most direct day-to-day assistance: bathing, dressing, feeding, and mobility. Nurse aide hours are typically the largest staffing category and directly affect residents' quality of life. 2h 23m per day ▼ 10% State avg: 2h 39m per day · National avg: 2h 21m per day
Weekend Total Nursing Info Combined nursing hours (RN + LPN + Nurse Aide) per resident per day on weekends. Staffing often drops on weekends — this figure reveals whether the facility maintains adequate coverage outside of weekday hours. 4h 32m per day ▲ 11% State avg: 4h 5m per day · National avg: 3h 26m per day
Physical Therapist Info Hours per resident per day provided by licensed Physical Therapists (PTs) or PT Assistants. PT services help residents recover mobility after injury or illness and are especially important for post-acute (short-stay) rehabilitation. 7m per day ▲ 40% State avg: 5m per day · National avg: 4m per day
Weekend RN Info Registered nurse hours specifically on weekends. Facilities sometimes reduce RN presence on Saturdays and Sundays — a low weekend RN figure compared to weekday hours can indicate reduced clinical oversight when most administrative staff are absent. 22m per day ▼ 27% State avg: 30m per day · National avg: 29m per day

Capacity and availability

This home usually has limited availability

Higher occupancy than the California average: 84.7%
Occupancy rate
92.9% Rank #246 / 1537Occupancy rate — State benchmarkedThis home is ranked 246th out of 1537 homes in California. Shows this facility's occupancy rate versus the California average, with its Statewide rank out of 1537. Higher occupancy signals strong local demand and financial stability.Rankings are based only on facilities in California that report data for that category. Facilities without available data are excluded from the ranking.Click the rank badge to see the full State ranking.Click here to see the full State ranking.
Avg. Length of Stay
111 days
Bed community size
145-bed community Rank #388 / 1657Bed count — State benchmarkedThis home is ranked 388th out of 1657 homes in California. Shows this facility's certified or reported bed count compared to other California facilities. Larger communities may offer more amenities, programs, and on-site services for residents and families.Rankings are based only on facilities in California that report data for that category. Facilities without available data are excluded from the ranking.Click the rank badge to see the full State ranking.Click here to see the full State ranking.
A larger shared setting that may offer more common spaces and organized community services.
Walk Score
Walk Score: 69 / 100 Rank #768 / 2092Walk Score — State benchmarkedThis home is ranked 768th out of 2092 homes in California. Shows how walkable this facility's neighborhood is compared to the average Walk Score across California facilities. Higher scores benefit residents, families, and staff.Rankings are based only on facilities in California that report data for that category. Facilities without available data are excluded from the ranking.Click the rank badge to see the full State ranking.Click here to see the full State ranking.
Moderately walkable. Some errands can be accomplished on foot, with a mix of nearby amenities.

Contact New Orange Hills

Staffing Data

Reporting period: July 1 – September 30, 2025 (Q3 2025). Source: CMS Payroll-Based Journal report.

Total staff 272
Employees 272
Contractors 0
Staff to resident ratio 1.94 : 1
7% more staff per resident than California average
California average ratio: 1.81 : 1 California average ratio: 1.81 : 1See full California ranking
Avg staff/day 99
Average shift 8.5 hours
10% better than California average
California average: 7.7 hours California average shift: 7.7 hoursSee full California ranking
Total staff hours (quarter) 77,394

Nursing staff breakdown

Q3 2025 · Jul 1 – Sep 30 More info This data comes from the CMS Payroll-Based Journal report covering July 1 – September 30, 2025.
Registered Nurse

Manages medical care and health needs.

RN Staff Info All 23 RN Staff are full-time employees. No contractors work on this role. 23
Average shift length Info Average shift length. Calculated as total hours divided by days worked and average staff per day. 9.5 hours
Licensed Practical Nurse

Assists with medical care and medications.

LPN Staff Info All 70 LPN Staff are full-time employees. No contractors work on this role. 70
Average shift length Info Average shift length. Calculated as total hours divided by days worked and average staff per day. 9.5 hours
Certified Nursing Assistant

Helps with daily care and mobility.

CNA Staff Info All 107 CNA Staff are full-time employees. No contractors work on this role. 107
Average shift length Info Average shift length. Calculated as total hours divided by days worked and average staff per day. 7.9 hours

Contractor staffing

Q3 2025 · Jul 1 – Sep 30 More info This data comes from the CMS Payroll-Based Journal report covering July 1 – September 30, 2025.
Total hours from contractors 0% — all staff are direct employees this quarter

Staff by category

Q3 2025 · Jul 1 – Sep 30 More info This data comes from the CMS Payroll-Based Journal report covering July 1 – September 30, 2025.
Certified Nursing Assistant107010729,68592100%7.9
Licensed Practical Nurse7007025,24792100%9.5
Registered Nurse230234,99992100%9.5
Qualified Activities Professional180184,81792100%9
Dental Services Staff8082,6306773%7.9
Respiratory Therapy Technician5051,5308997%7.4
Physical Therapy Assistant5051,2426975%7
Other Dietary Services Staff6061,17892100%6.9
RN Director of Nursing2021,0896672%8.7
Speech Language Pathologist8081,0567480%7.7
Physical Therapy Aide4047506874%6.8
Qualified Social Worker6066196470%6.7
Clinical Nurse Specialist4046186672%8.4
Nurse Practitioner2026106672%9
Administrator1015286672%8
Dietitian2024255964%7.2
Therapeutic Recreation Specialist1013724751%7.9
107 Certified Nursing Assistant
% of Days 100%
70 Licensed Practical Nurse
% of Days 100%
23 Registered Nurse
% of Days 100%
18 Qualified Activities Professional
% of Days 100%
8 Dental Services Staff
% of Days 73%
5 Respiratory Therapy Technician
% of Days 97%
5 Physical Therapy Assistant
% of Days 75%
6 Other Dietary Services Staff
% of Days 100%
2 RN Director of Nursing
% of Days 72%
8 Speech Language Pathologist
% of Days 80%
4 Physical Therapy Aide
% of Days 74%
6 Qualified Social Worker
% of Days 70%
4 Clinical Nurse Specialist
% of Days 72%
2 Nurse Practitioner
% of Days 72%
1 Administrator
% of Days 72%
2 Dietitian
% of Days 64%
1 Therapeutic Recreation Specialist
% of Days 51%

Penalties and fines

Federal penalties imposed by CMS for regulatory violations, including civil money penalties (fines) and denials of payment for new Medicare/Medicaid admissions.

Source: CMS Penalties Database (Data as of Jan 2026)

Total fines amount $15K Rank #253 / 362Federal fines — State benchmarkedThis home is ranked 253rd out of 362 homes in California. Shows this facility's cumulative CMS federal fine dollars versus the California average among facilities with fines, and where it ranks among 362 facilities in the pool. Lower total dollars mean a better rank.Rankings are based only on facilities in California that report data for that category. Facilities without available data are excluded from the ranking.Click the rank badge to see the full State ranking.Click here to see the full State ranking.
72% lower than California average

California average: $55K

Number of fines 1
58% fewer fines than California average

California average: 2.4

Payment Denials Info Serious action where Medicare and/or Medicaid temporarily stops payments for new residents until issues are fixed. 0
100% fewer payment denials than California average

California average: 0.5

Fines amount comparison
This facility $15K
California average $55K

No penalties in the past 3 years

No civil money penalties or payment denials were reported in the last 3 years.

Quality of care over time

These measures show how residents usually do over time at this home, based on health outcomes and preventive care.

High-risk clinical events score Info A composite score based on pressure ulcers, falls with injury, weight loss, walking ability decline, and activities of daily living decline. 5.0
25% better than California average

California average: 6.6

Functional decline score Info A composite score based on activities of daily living decline, walking ability decline, and incontinence. 12.7
12% worse than California average

California average: 11.3

Long-stay resident measures
Significantly above average Info CMS star rating based on long-stay quality measure performance. 5 stars = significantly above average, 1 star = significantly below average.
Need for Help with Daily Activities Increased Info Percent of long-stay residents whose need for help with daily activities has increased 6.7%
39% better than California average

California average: 11.1%

Walking Ability Worsened Info Percent of long-stay residents whose ability to move independently worsened 11.0%
8% better than California average

California average: 12.0%

Low Risk Residents with Bowel/Bladder Incontinence Info Percent of low risk long-stay residents who lose control of their bowels or bladder 20.3%
80% worse than California average

California average: 11.3%

Falls with Major Injury Info Percent of long-stay residents experiencing one or more falls with major injury 0.0%
100% better than California average

California average: 1.7%

High Risk Residents with Pressure Ulcers Info Percent of long-stay high risk residents with pressure ulcers 5.7%
15% worse than California average

California average: 5.0%

Urinary Tract Infection Info Percent of long-stay residents with a urinary tract infection 0.0%
100% better than California average

California average: 1.2%

Lost Too Much Weight Info Percent of long-stay residents who lose too much weight 1.6%
62% better than California average

California average: 4.2%

Depressive Symptoms Info Percent of long-stay residents who have depressive symptoms 29.1%
335% worse than California average

California average: 6.7%

Pneumococcal Vaccine Info Percent of long-stay residents assessed and appropriately given the pneumococcal vaccine 99.8%
In line with California average

California average: 98.5%

Influenza Vaccine Info Percent of long-stay residents assessed and appropriately given the seasonal influenza vaccine 97.6%
In line with California average

California average: 98.2%

Hospitalizations per 1,000 days Info Number of hospitalizations per 1,000 long-stay resident days. 2.13
5% better than California average

California average: 2.25

ED visits per 1,000 days Info Number of outpatient emergency department visits per 1,000 long-stay resident days. 0.99
38% better than California average

California average: 1.59

Short-stay resident measures
Below average Info CMS star rating based on short-stay quality measure performance. 5 stars = much above average, 1 star = much below average.
Pneumococcal Vaccine Info Percent of short-stay residents assessed and appropriately given the pneumococcal vaccine 99.9%
6% better than California average

California average: 94.0%

Antipsychotic medication increase Info Percent of short-stay residents who newly received an antipsychotic medication 0.3%
82% better than California average

California average: 1.5%

Influenza Vaccine Info Percent of short-stay residents assessed and appropriately given the seasonal influenza vaccine 88.1%
6% worse than California average

California average: 93.2%

Re-hospitalized after SNF stay Info Percentage of short-stay residents who were re-hospitalized after their nursing home admission. 24.3%
5% worse than California average

California average: 23.2%

Emergency department visits Info Percentage of short-stay residents who had an outpatient emergency department visit. 10.0%
11% better than California average

California average: 11.2%

Falls with major injury Info Percentage of SNF residents who experience falls with major injury during their stay. 0.0%
100% better than California average

California average: 0.8%

Ability to care for self at discharge Info Percentage of residents at or above expected ability to care for themselves at discharge. 34.0%
37% worse than California average

California average: 53.7%

Successful return to home or community Info Rate of successful return to home or community from a skilled nursing facility. 42.8%
15% worse than California average

California average: 50.6%

Breakdown by payment type

Medicare

20% of new residents, usually for short-term rehab.

Typical stay 1 - 2 months

Private pay

57% of new residents, often for short stays.

Typical stay 25 days

Medicaid

23% of new residents, often for long-term daily care.

Typical stay 11 - 12 months

Facility Characteristics

Source: CMS Long-Term Care Facility Characteristics (Data as of Jan 2026)

Total residents 140
Medicare
15
10.7% of residents
Medicaid
107
76.4% of residents
Private pay or other
18
12.9% of residents
Programs & Services
Residents Group

Residents meet regularly to discuss policies, care quality, and activities

Active Resident Council

Organized group of residents that meets regularly to discuss facility policies, quality of life, and activities.

Finances and operations

Based on CMS SNF Cost Report for fiscal year ending in 12/2023.

For-profit
Corporation
Net patient revenue Info Net patient revenue — what the home actually collects for resident care, after contractual allowances, bad debt and discounts are subtracted from its gross charges (CMS cost report, Worksheet G-3). It covers resident care only; money the home earns from other sources is shown separately as "Other income."
$23.3M
Net patient income Info Net patient income: net patient revenue minus the home's total operating expenses. A positive figure means it earns more from resident care than it spends to deliver it; a negative figure means the opposite. It excludes non-operating "other income."
$1.5M
For-profit Corporation
Net patient revenue Info Net patient revenue — what the home actually collects for resident care, after contractual allowances, bad debt and discounts are subtracted from its gross charges (CMS cost report, Worksheet G-3). It covers resident care only; money the home earns from other sources is shown separately as "Other income."
$23.3M Rank #65 / 355Revenue — State benchmarkedThis home is ranked 65th out of 355 homes in California. Shows this facility's annual revenue compared to the California average. Higher revenue generally means more resources for staffing and capital — read alongside Payroll %.Rankings are based only on facilities in California that report data for that category. Facilities without available data are excluded from the ranking.Click the rank badge to see the full State ranking.Click here to see the full State ranking.
Net patient income Info Net patient income: net patient revenue minus the home's total operating expenses. A positive figure means it earns more from resident care than it spends to deliver it; a negative figure means the opposite. It excludes non-operating "other income."
$1.5M
Other income Info Money the home earns outside of resident care — such as investments, grants, rentals and other non-operating sources (CMS cost report, Worksheet G-3). It is tracked separately from net patient revenue: it is not part of that figure, and it is not included in net patient income.
-$1.4K
Payroll costs Info Staff salaries plus wage-related costs — benefits such as payroll taxes, health insurance and retirement — from the home's own accounting records (CMS cost report, Worksheet A). Contract or agency labor is counted separately, under other operating costs. Rank #39 / 355Payroll — State benchmarkedThis home is ranked 39th out of 355 homes in California. Shows total annual staff payroll benchmarked to the California average. Higher payroll investment relative to peers often signals better staffing and less reliance on cheaper contract labor.Rankings are based only on facilities in California that report data for that category. Facilities without available data are excluded from the ranking.Click the rank badge to see the full State ranking.Click here to see the full State ranking.
$12.2M 52.2% of net patient revenue Info Payroll as a share of revenue: staff salaries and wage-related benefits divided by net patient revenue. A higher figure means more of each revenue dollar goes to staff pay. Rank #202 / 355Payroll % — State benchmarkedThis home is ranked 202nd out of 355 homes in California. Shows payroll as a percentage of revenue versus the California average. Well-run California facilities typically land around 55–67% — the top third Statewide. Below 25% may signal understaffing or heavy agency use — read with Staffing ratings.Rankings are based only on facilities in California that report data for that category. Facilities without available data are excluded from the ranking.Click the rank badge to see the full State ranking.Click here to see the full State ranking.
Other operating costs Info Everything it costs to run the home apart from payroll — food, utilities, supplies, maintenance, contract labor and administration. Calculated as total operating expense minus payroll (staff salaries and wage-related benefits).
$9.6M
Total costs Info The home's total operating expense for the year — all the costs of running it, salaries included (CMS cost report, Worksheet G-3).
$21.8M

What does this home offer?

Building type icon
Building type icon

Building Type: Single-story

Beauty services icon

Beauty Services

Social and recreational activities icon

Social and Recreational Activities

Rehabilitative support icon

Rehabilitative Support

On-site medical care and health services icon

On-site Medical Care and Health Services

Who this home usually serves

TYPE OF STAY

Mix of rehab and long-term care

This home supports both short-term rehab and long-term care, with residents staying for a wide range of durations.

Most new residents arrive under private pay (57% of admissions), and a typical private pay stay runs around 25 days.

Admissions
452 total

Coverage residents most often arrive under.

Medicare 20%
Private pay 57%
Medicaid 23%
Discharges
405 total

Coverage residents most often leave under.

Medicare 22%
Private pay 60%
Medicaid 18%

Places of interest near New Orange Hills

Address 3.3 miles from city center Info Estimated distance in miles from Orange's city center to New Orange Hills's address, calculated via Google Maps.

Calculate Travel Distance to New Orange Hills

Add your location

Address

Compare Nursing Homes around Orange County

The information below is reported by the California Department of Social Services and Department of Public Health.

5 facilities compared · CMS & CA Dept. of Health data

Mission Palms Healthcare Center
NH
HC
RC
Westminster
99
Facility 99
CA AVG 103
Rank #725 / 1657
89.6%
Facility 89.6%
CA AVG 84.7%
Rank #335 / 1537
+6%
3.61
Facility 3.61
CA AVG 4.22
Rank #269 / 354
-48%-15%
$13.9k
Facility $13.9k
CA AVG $56.5k
Rank #258 / 362
-
39
Facility 39
CA AVG 50.2
Rank #164 / 361
6.5
Facility 6.5
CA AVG 4.6
Rank #315 / 361
193A+
63
Facility 63
CA AVG 57
Rank #951 / 2092
-
$15.7M
Facility $15.7M
CA AVG $17.0M
Rank #187 / 355
$8.9M
Facility $8.9M
CA AVG $7.0M
Rank #161 / 355
56.4%
Facility 56.4%
CA AVG 45.2%
Rank #116 / 355
56271
Villa Valencia Healthcare Center
NH
Laguna Hills
59
Facility 59
CA AVG 103
Rank #1092 / 1657
83.3%
Facility 83.3%
CA AVG 84.7%
Rank #504 / 1537
-2%
3.21
Facility 3.21
CA AVG 4.22
Rank #336 / 354
+19%-24%
$0
Facility $0
CA AVG $56.5k
Rank #1 / 362
-
41
Facility 41
CA AVG 50.2
Rank #176 / 361
3.2
Facility 3.2
CA AVG 4.6
Rank #82 / 361
-53-
62
Facility 62
CA AVG 57
Rank #982 / 2092
Alhv LLC
$14.0M
Facility $14.0M
CA AVG $17.0M
Rank #183 / 355
$6.9M
Facility $6.9M
CA AVG $7.0M
Rank #222 / 355
49.5%
Facility 49.5%
CA AVG 45.2%
Rank #241 / 355
555462
Orange Healthcare & Wellness Center, LLC
NH
Orange
112
Facility 112
CA AVG 103
Rank #631 / 1657
93.6%
Facility 93.6%
CA AVG 84.7%
Rank #225 / 1537
+11%
3.72
Facility 3.72
CA AVG 4.22
Rank #245 / 354
-56%-12%
$0
Facility $0
CA AVG $56.5k
Rank #1 / 362
-
83
Facility 83
CA AVG 50.2
Rank #313 / 361
4.9
Facility 4.9
CA AVG 4.6
Rank #240 / 361
193-
58
Facility 58
CA AVG 57
Rank #1128 / 2092
-
$15.5M
Facility $15.5M
CA AVG $17.0M
Rank #67 / 355
$9.7M
Facility $9.7M
CA AVG $7.0M
Rank #105 / 355
62.2%
Facility 62.2%
CA AVG 45.2%
Rank #315 / 355
55252
Anaheim Healthcare Center
NH
Anaheim (Southwest Anaheim)
250
Facility 250
CA AVG 103
Rank #86 / 1657
86.2%
Facility 86.2%
CA AVG 84.7%
Rank #429 / 1537
+2%
4.29
Facility 4.29
CA AVG 4.22
Rank #122 / 354
+18%+2%
$9.3k
Facility $9.3k
CA AVG $56.5k
Rank #238 / 362
-
110
Facility 110
CA AVG 50.2
Rank #348 / 361
5.2
Facility 5.2
CA AVG 4.6
Rank #260 / 361
1219-
69
Facility 69
CA AVG 57
Rank #768 / 2092
Anaheim Healthcare Center LLC
$35.3M
Facility $35.3M
CA AVG $17.0M
Rank #3 / 355
$21.2M
Facility $21.2M
CA AVG $7.0M
Rank #6 / 355
59.9%
Facility 59.9%
CA AVG 45.2%
Rank #343 / 355
55984
New Orange Hills
NH
Orange
145
Facility 145
CA AVG 103
Rank #388 / 1657
92.9%
Facility 92.9%
CA AVG 84.7%
Rank #246 / 1537
+10%
3.21
Facility 3.21
CA AVG 4.22
Rank #336 / 354
-5%-24%
$12.7k
Facility $12.7k
CA AVG $56.5k
Rank #253 / 362
-
93
Facility 93
CA AVG 50.2
Rank #330 / 361
4.0
Facility 4.0
CA AVG 4.6
Rank #169 / 361
1135-
69
Facility 69
CA AVG 57
Rank #768 / 2092
James Villafania
$23.3M
Facility $23.3M
CA AVG $17.0M
Rank #65 / 355
$12.2M
Facility $12.2M
CA AVG $7.0M
Rank #39 / 355
52.2%
Facility 52.2%
CA AVG 45.2%
Rank #202 / 355
555286

Financial Assistance for
Nursing Home in California

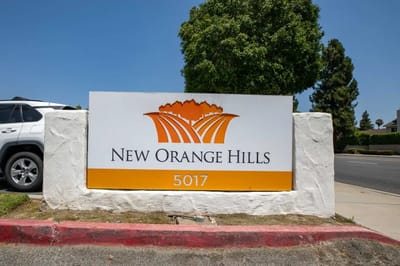
New Orange Hills is located in Orange, California.
Here are the financial assistance programs available to residents in California.

Get Financial aid guidance

Multipurpose Senior Services Program

MSSP (Medi-Cal Waiver)

Age 65+
General California resident, Medi-Cal eligible, nursing home risk.
Income Limits (2025) ~$2,829/month 300% FBR, individual
Asset Limits $2,000 (individual), $3,000 (couple).
CA

County-managed; waitlists possible.

Benefits
In-home support (4-6 hours/day) Respite care (14 days/year) Meals (~$6/meal) Transportation (8 trips/month) Care management

In-Home Supportive Services (IHSS)

California IHSS

Age 65+
General California resident, Medicaid-eligible or low-income.
Income Limits ~$1,732/month individual, Medi-Cal threshold
Asset Limits $2,000 individual
CA

Can hire family as caregivers.

Benefits
Personal care (up to 283 hours/month) Homemaker services Respite (varies)

Multipurpose Senior Services Program (MSSP)

CA MSSP

Age 65+
General California resident, Medi-Cal-eligible, nursing home-eligible but community-capable.
Income Limits ~$2,829/month 300% FBR, individual
Asset Limits $2,000 individual
CA

Available in 38 counties; waitlists common.

Benefits
Case management Respite care (up to 10 days/year) Minor home mods (avg. $500) Adult day care (~$50/day)

Property Tax Postponement Program (PTP)

CA PTP

Age 62+
General California resident, own and live in home, 40% equity.
Income Limits (2025) ~$51,500/year household, adjusted annually
Asset Limits Equity-based; no strict asset cap.
CA

Deferred taxes accrue interest (5% as of 2024); repaid upon sale/death.

Benefits
Property tax deferral (avg. $1,000-$3,000/year, varies by county)

Assisted Living Waiver (ALW)

CA ALW

Age 65+ or disabled
General California resident, Medi-Cal-eligible, nursing home-eligible.
Income Limits ~$2,829/month 300% FBR, individual
Asset Limits $2,000 individual
CA

Available in 15 counties (e.g., LA, Sacramento); waitlists common.

Benefits
Personal care in ALFs (5-7 hours/day) Medication management Social services

California CARES Program

CA CARES

Age
General Caregivers of California residents 60+ needing help with 3+ daily activities; no caregiver age limit.
Income Limits No strict limit; cost-sharing above ~$2,500/month threshold.
Asset Limits Not applicable; need-based.
CA

High demand in urban areas; complements IHSS respite.

Benefits
Respite care (up to 10 days/year) Counseling (4-6 sessions/year) Training (2-3 workshops/year) Supplies (~$200/year)

Frequently Asked Questions about New Orange Hills

What neighborhood is New Orange Hills in?

New Orange Hills is in the Orange neighborhood.

Is New Orange Hills in a walkable area?

New Orange Hills has a walk score of 69. Moderately walkable. Some errands can be accomplished on foot, with a mix of nearby amenities.

What is the occupancy rate at New Orange Hills?

New Orange Hills's occupancy is 92.9%.

What is the best email address for New Orange Hills?

The team at New Orange Hills can be reached at NewOrangeHills@ensignservices.net.

Does New Orange Hills operate as a for-profit or non-profit?

New Orange Hills is registered as a for-profit.

Are there photos of New Orange Hills?

Yes — there are 5 photos of New Orange Hills in the photo gallery on this page.

What is the address of New Orange Hills?

New Orange Hills is located at 5017 E Chapman Ave, Orange, CA 92869.

Guides for Better Senior Living

Care Cost Calculator: See Prices in Your Area

Nursing Home Data Explorer

Don’t Wait Too Long: 7 Red Flag Signs Your Parent Needs Assisted Living Now

The True Cost of Assisted Living in 2025 – And How Families Are Paying For It

Understanding Senior Living Costs: Pricing Models, Discounts & Financial Assistance