


Total staff
241
Employees
100
Contractors
141
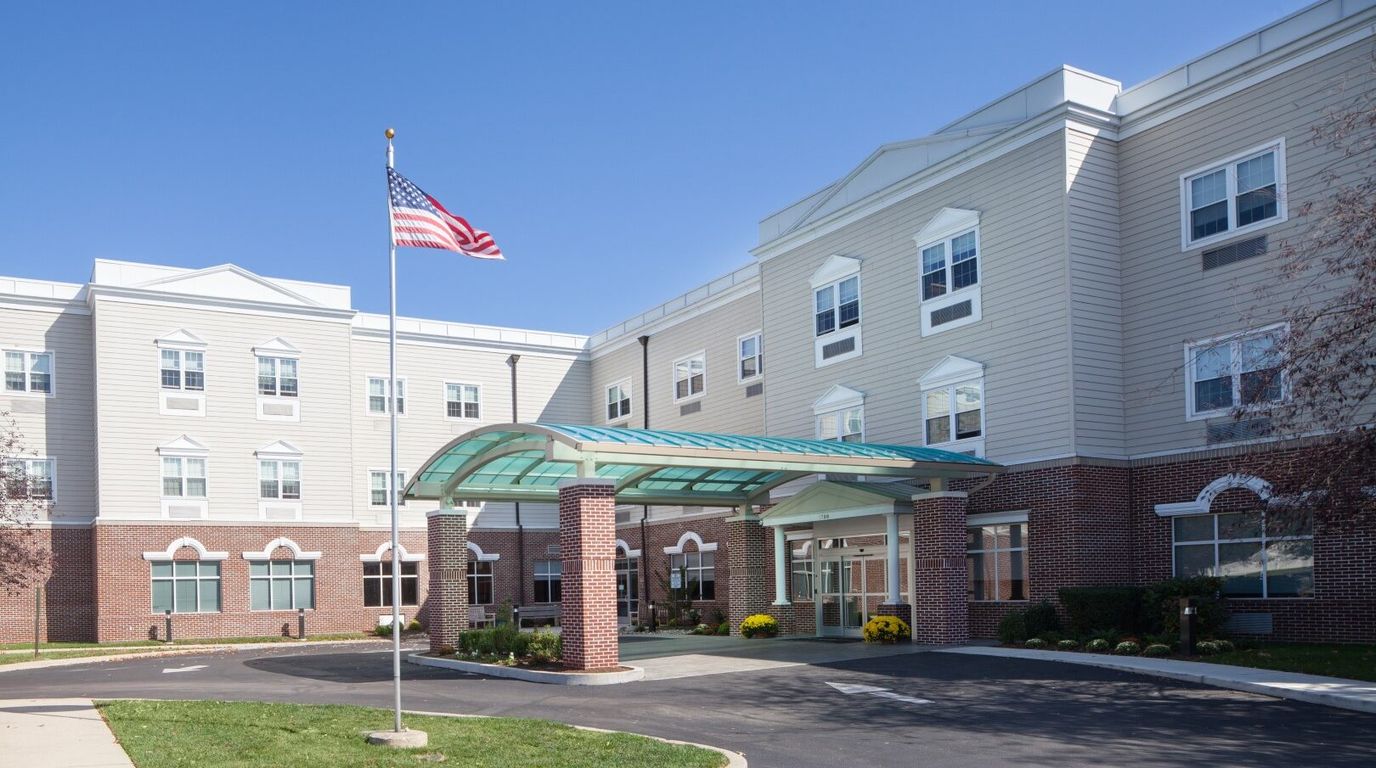
Norriton Square Nursing and Rehabilitation Center is a reliable rehabilitation and skilled nursing community conveniently located in Norristown, PA. Their compassionate team consists of highly qualified care experts who deliver quality and comprehensive services for short-term stays, long-term care, and rehabilitation. Physical, speech, and occupational therapies are available to ensure residents can fully regain their overall functions while having easy access to other healthcare services for a guaranteed higher quality of life.
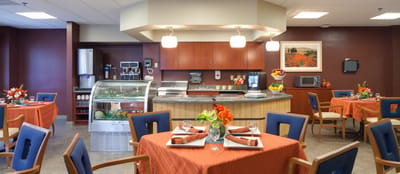
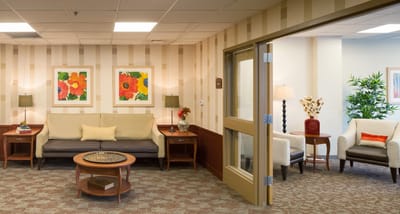
In addition to comprehensive care services, residents enjoy an array of thoughtful amenities like salon services, cozy common areas, and housekeeping services for a more comfortable living experience. There’s also a vibrant activity room where residents can enjoy an array of enriching activities for a lively lifestyle. With fresh and personalized meals, residents here always have the energy and nourishment they need to heal faster and maintain a healthy well-being.
| Staff type | Hours / Day / Resident | vs state avg |
|---|---|---|
|
Registered Nurse (RN)
| 43m per day | ▼ 9% State avg: 47m per day · National avg: 41m per day |
|
LPN / LVN
| 51m per day | ▼ 8% State avg: 55m per day · National avg: 52m per day |
|
Nurse Aide
| 1h 55m per day | ▼ 13% State avg: 2h 12m per day · National avg: 2h 21m per day |
|
Weekend Total Nursing
| 3h 7m per day | ▼ 12% State avg: 3h 31m per day · National avg: 3h 26m per day |
|
Physical Therapist
| 4m per day | ▼ 26% State avg: 6m per day · National avg: 4m per day |
|
Weekend RN
| 23m per day | ▼ 30% State avg: 33m per day · National avg: 29m per day |
Reporting period: October 1 – December 31, 2025 (Q4 2025). Source: CMS Payroll-Based Journal report.
Manages medical care and health needs.
Assists with medical care and medications.
Helps with daily care and mobility.
Total hours from contractors
5,970 contractor hours this quarter
| Certified Nursing Assistant | 44 | 61 | 105 | 16,196 | 92 | 100% | 7.4 |
| Licensed Practical Nurse | 9 | 46 | 55 | 6,662 | 92 | 100% | 7.9 |
| Registered Nurse | 11 | 27 | 38 | 4,384 | 92 | 100% | 7.4 |
| Clinical Nurse Specialist | 3 | 0 | 3 | 1,110 | 64 | 70% | 6.1 |
| Physical Therapy Assistant | 6 | 0 | 6 | 1,037 | 76 | 83% | 7.6 |
| Mental Health Service Worker | 3 | 0 | 3 | 879 | 65 | 71% | 7.8 |
| Other Dietary Services Staff | 4 | 0 | 4 | 700 | 84 | 91% | 6 |
| Respiratory Therapy Technician | 4 | 1 | 5 | 624 | 75 | 82% | 7.2 |
| Other Social Services Staff | 1 | 0 | 1 | 566 | 71 | 77% | 8 |
| Qualified Social Worker | 4 | 0 | 4 | 550 | 67 | 73% | 7.3 |
| Nurse Practitioner | 3 | 0 | 3 | 545 | 58 | 63% | 7.9 |
| RN Director of Nursing | 2 | 0 | 2 | 487 | 59 | 64% | 8.1 |
| Administrator | 1 | 0 | 1 | 447 | 56 | 61% | 8 |
| Speech Language Pathologist | 3 | 0 | 3 | 431 | 56 | 61% | 7.2 |
| Occupational Therapy Aide | 0 | 3 | 3 | 316 | 45 | 49% | 7 |
| Occupational Therapy Assistant | 0 | 2 | 2 | 68 | 22 | 24% | 2.9 |
| Medical Director | 0 | 1 | 1 | 36 | 16 | 17% | 2.3 |
| Physical Therapy Aide | 2 | 0 | 2 | 19 | 3 | 3% | 6.3 |
Federal penalties imposed by CMS for regulatory violations, including civil money penalties (fines) and denials of payment for new Medicare/Medicaid admissions.
Source: CMS Penalties Database
No penalties in the past 3 years
No civil money penalties or payment denials were reported in the last 3 years.
These measures show how residents usually do over time at this home, based on health outcomes and preventive care.
Pennsylvania average: 11.0
Pennsylvania average: 22.2
Pennsylvania average: 19.0%
Pennsylvania average: 21.1%
Pennsylvania average: 26.7%
Pennsylvania average: 3.2%
Pennsylvania average: 5.5%
Pennsylvania average: 1.8%
Pennsylvania average: 6.6%
Pennsylvania average: 5.5%
Pennsylvania average: 17.1%
Pennsylvania average: 86.9%
Pennsylvania average: 93.5%
Pennsylvania average: 68.8%
Pennsylvania average: 1.5%
Pennsylvania average: 68.7%
Pennsylvania average: 23.1%
Pennsylvania average: 9.8%
Pennsylvania average: 0.8%
Pennsylvania average: 53.7%
Pennsylvania average: 50.6%
Quality measures are calculated from Minimum Data Set (MDS) assessments. For most measures, lower percentages indicate better care quality.
26% of new residents, usually for short-term rehab.
73% of new residents, often for short stays.
2% of new residents, often for long-term daily care.
Source: CMS Long-Term Care Facility Characteristics (Data as of Jan 2026)
Residents meet regularly to discuss policies, care quality, and activities
Organized group of residents that meets regularly to discuss facility policies, quality of life, and activities.
Data sourced from CMS Long-Term Care Facility Characteristics quarterly report. Payer mix reflects the current resident census by primary payment source.
Historical financial and operational data for Norriton Square Nursing and Rehabilitation Center from 2012–2024, based on CMS SNF Cost Reports.
Key figures below are for fiscal year ending in 06/2024.
Based on CMS SNF Cost Report for fiscal year ending in 06/2024.
Pets Allowed
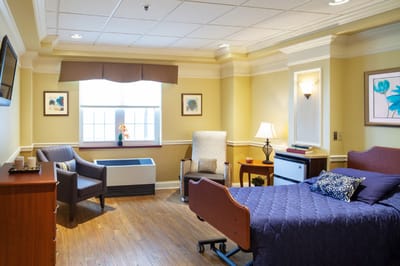
Housing Options: Private / Semi-Private Rooms
Building Type: 3-story
Beauty Services
Housekeeping Services
Recreational Activities
Exercise Programs
Residents typically stay for brief periods, with frequent admissions and discharges throughout the year.
Most new residents arrive under private pay (73% of admissions), and a typical private pay stay runs around 19 days.
Coverage residents most often arrive under.
Coverage residents most often leave under.
![]() 0.8 miles from city center
0.8 miles from city center
![]() Estimated distance in miles from Norristown's city center to Norriton Square Nursing and Rehabilitation Center's address, calculated via Google Maps.
Estimated distance in miles from Norristown's city center to Norriton Square Nursing and Rehabilitation Center's address, calculated via Google Maps.
Add your location
The information below is reported by the Pennsylvania Department of Human Services and Department of Health.
| Gwynedd Healthcare & Rehabilitation Center | NH HOS MC RC SNF | Pike Lansdale (Sumneytown Pike) | 181
Facility
181
PA AVG
94
Rank
#26 / 554 |
95.0%
Facility
95.0%
PA AVG
68.1
Rank
#21 / 508 | +39% | 4.09
Facility
4.09
PA AVG
4.15
Rank
#108 / 198 | -41% | -1% | $24.1k
Facility
$24.1k
PA AVG
$61.2k
Rank
#171 / 201 | - | 17
Facility
17
PA AVG
31.3
Rank
#100 / 196 | 3.4
Facility
3.4
PA AVG
4.4
Rank
#89 / 196 | 1 | 172 | - |
8
Facility
8
PA AVG
46
Rank
#610 / 667 | Michelle Taylor | $22.6MFiscal year ending 12/2023
Facility
$22.6MFiscal year ending 12/2023
PA AVG
$32.8M
Rank
#91 / 200 | $10.1MFiscal year ending 12/2023
Facility
$10.1MFiscal year ending 12/2023
PA AVG
$6.7M
Rank
#76 / 200 | 44.5%Fiscal year ending 12/2023
Facility
44.5%Fiscal year ending 12/2023
PA AVG
40%
Rank
#82 / 200 | 395479 | ||||
| Ambler Extended Care Center | NH HOS MC RC SNF | Pike Ambler (Rose Valley) | 100
Facility
100
PA AVG
94
Rank
#203 / 554 |
93.9%
Facility
93.9%
PA AVG
68.1
Rank
#29 / 508 | +38% | 3.46
Facility
3.46
PA AVG
4.15
Rank
#168 / 198 | -17% | -16% | $0
Facility
$0
PA AVG
$61.2k
Rank
#1 / 201 | - | 11
Facility
11
PA AVG
31.3
Rank
#69 / 196 | 2.8
Facility
2.8
PA AVG
4.4
Rank
#61 / 196 | - | 94 | - |
84
Facility
84
PA AVG
46
Rank
#58 / 667 | Cody Meenan | $11.6MFiscal year ending 12/2023
Facility
$11.6MFiscal year ending 12/2023
PA AVG
$32.8M
Rank
#162 / 200 | $6.7MFiscal year ending 12/2023
Facility
$6.7MFiscal year ending 12/2023
PA AVG
$6.7M
Rank
#148 / 200 | 58%Fiscal year ending 12/2023
Facility
58%Fiscal year ending 12/2023
PA AVG
40%
Rank
#50 / 200 | 395176 | ||||
| Silver Stream Nursing and Rehabilitation Center | NH | Spring House (Penllyn) | 120
Facility
120
PA AVG
94
Rank
#127 / 554 |
73.3%
Facility
73.3%
PA AVG
68.1
Rank
#227 / 508 | +8% | 4.02
Facility
4.02
PA AVG
4.15
Rank
#118 / 198 | -76% | -3% | $0
Facility
$0
PA AVG
$61.2k
Rank
#1 / 201 | - | 53
Facility
53
PA AVG
31.3
Rank
#174 / 196 | 5.9
Facility
5.9
PA AVG
4.4
Rank
#159 / 196 | - | 88 | A+ |
49
Facility
49
PA AVG
46
Rank
#292 / 667 | Aaron Lichtschein | $10.0MFiscal year ending 06/2024
Facility
$10.0MFiscal year ending 06/2024
PA AVG
$32.8M
Rank
#180 / 200 | $4.8MFiscal year ending 06/2024
Facility
$4.8MFiscal year ending 06/2024
PA AVG
$6.7M
Rank
#178 / 200 | 48.3%Fiscal year ending 06/2024
Facility
48.3%Fiscal year ending 06/2024
PA AVG
40%
Rank
#72 / 200 | 395354 | ||||
| Montgomeryville Skilled Nursing and Rehabilitation Center | NH SNF | Pike Montgomeryville (Montgomeryville) | 155
Facility
155
PA AVG
94
Rank
#45 / 554 |
34.8%
Facility
34.8%
PA AVG
68.1
Rank
#485 / 508 | -49% | 7.50
Facility
7.50
PA AVG
4.15
Rank
#3 / 198 | +14% | +81% | $0
Facility
$0
PA AVG
$61.2k
Rank
#1 / 201 | - | 40
Facility
40
PA AVG
31.3
Rank
#148 / 196 | 3.3
Facility
3.3
PA AVG
4.4
Rank
#84 / 196 | - | 54 | - |
27
Facility
27
PA AVG
46
Rank
#488 / 667 | - | $16.1MFiscal year ending 06/2024
Facility
$16.1MFiscal year ending 06/2024
PA AVG
$32.8M
Rank
#116 / 200 | $6.3MFiscal year ending 06/2024
Facility
$6.3MFiscal year ending 06/2024
PA AVG
$6.7M
Rank
#105 / 200 | 39%Fiscal year ending 06/2024
Facility
39%Fiscal year ending 06/2024
PA AVG
40%
Rank
#96 / 200 | 395796 | ||||
| Norriton Square Nursing and Rehabilitation Center | NH | Norristown | 99
Facility
99
PA AVG
94
Rank
#226 / 554 |
92.9%
Facility
92.9%
PA AVG
68.1
Rank
#44 / 508 | +36% | 3.51
Facility
3.51
PA AVG
4.15
Rank
#168 / 198 | +32% | -15% | $0
Facility
$0
PA AVG
$61.2k
Rank
#1 / 201 | - | 29
Facility
29
PA AVG
31.3
Rank
#131 / 196 | 5.8
Facility
5.8
PA AVG
4.4
Rank
#156 / 196 | - | 92 | - |
70
Facility
70
PA AVG
46
Rank
#142 / 667 | - | $12.0MFiscal year ending 06/2024
Facility
$12.0MFiscal year ending 06/2024
PA AVG
$32.8M
Rank
#114 / 200 | $5.2MFiscal year ending 06/2024
Facility
$5.2MFiscal year ending 06/2024
PA AVG
$6.7M
Rank
#188 / 200 | 43.5%Fiscal year ending 06/2024
Facility
43.5%Fiscal year ending 06/2024
PA AVG
40%
Rank
#195 / 200 | 396009 |
Norriton Square Nursing and Rehabilitation Center is located in Norristown, Pennsylvania.
Here are the financial assistance programs available to residents in Pennsylvania.
Norriton Square Nursing and Rehabilitation Center is in the Norristown neighborhood.
Norriton Square Nursing and Rehabilitation Center has a walk score of 70. Very walkable. Most errands can be accomplished on foot, and many essentials are within a short walk.
Norriton Square Nursing and Rehabilitation Center's occupancy is 94.5%.
Norriton Square Nursing and Rehabilitation Center is registered as a for-profit.
Yes — there are 4 photos of Norriton Square Nursing and Rehabilitation Center in the photo gallery on this page.
Norriton Square Nursing and Rehabilitation Center is located at 1700 Pine St, Norristown, PA 19401.
(610) 239-7100 will put you in contact with the team at Norriton Square Nursing and Rehabilitation Center.
Care Cost Calculator: See Prices in Your Area
Nursing Home Data Explorer
Don’t Wait Too Long: 7 Red Flag Signs Your Parent Needs Assisted Living Now
The True Cost of Assisted Living in 2025 – And How Families Are Paying For It
Understanding Senior Living Costs: Pricing Models, Discounts & Financial Assistance


