


Total staff
84
Employees
56
Contractors
28
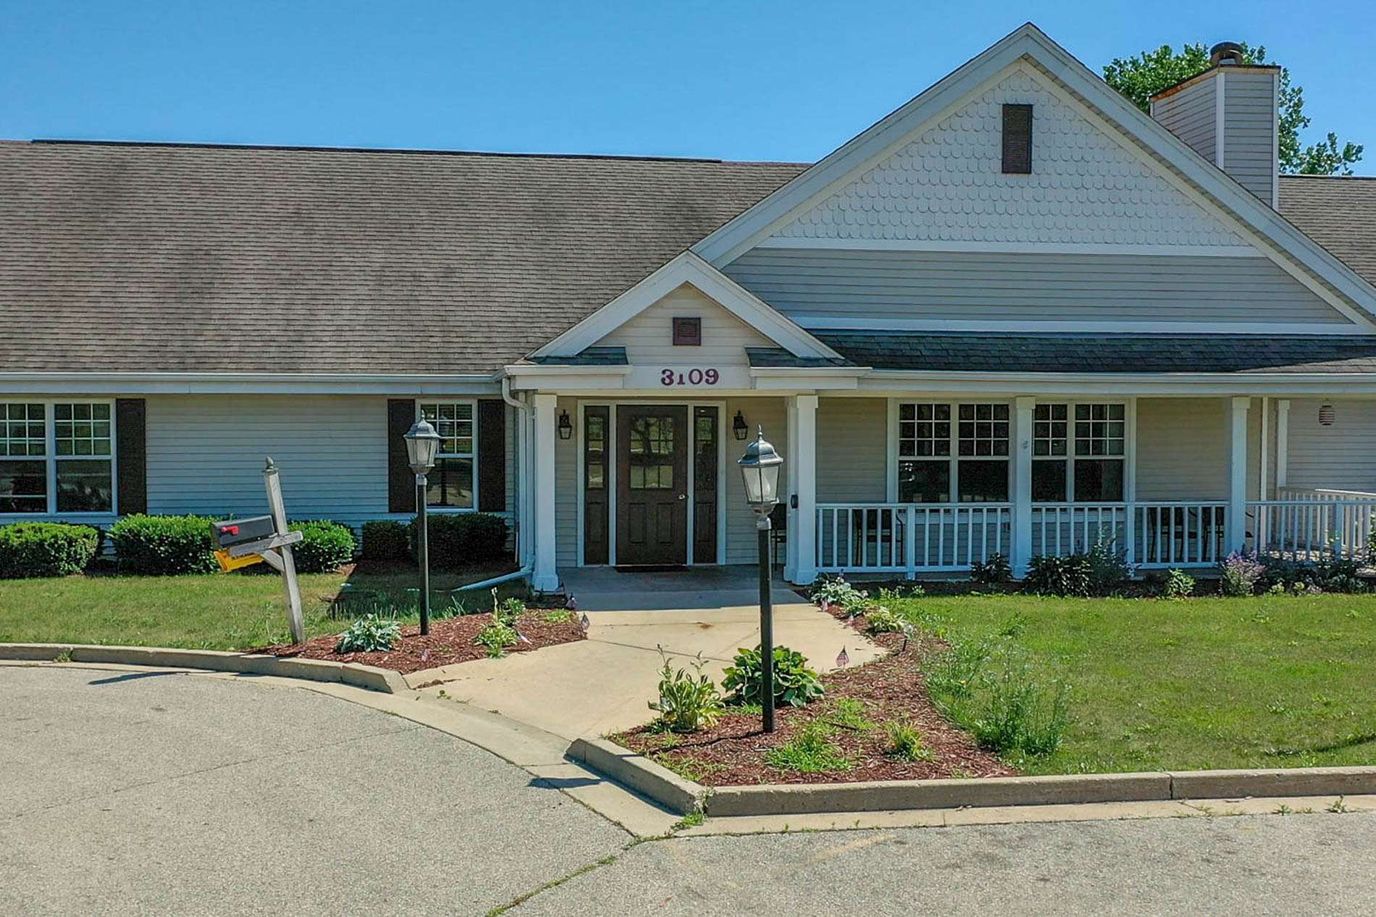
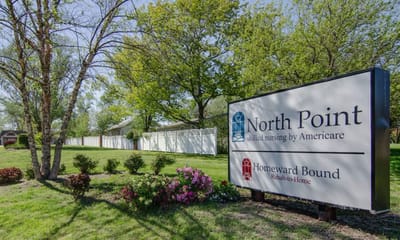


North Point is a 72-bed skilled nursing community at 908 North Pearl Street in Paola, Miami County, Kansas, independently owned and operated by Holly Hess. The facility specializes in skilled nursing, rehabilitation, hospice care, and memory care services across a 103-day average length of stay.
A three-year compliance record shows zero penalties, a baseline signal of regulatory stability. On CMS metrics, the community’s health inspection rating sits 72.9% above the Kansas average. Quality measures also run 29.4% above the state average. Staffing hours, however, present a concern: at 3 hours 44 minutes per resident per day, the facility runs 19% below the Kansas average, placing it 122nd among 141 state facilities. Physical therapist availability breaks this pattern, running 50% above state average.
Long-stay patients show excellent results on hard safety metrics: falls with major injury occur in only 1.4% of residents (68% better than state average), urinary tract infections are absent, and antipsychotic medication use is 78% better than state average. Hospitalization and emergency department visits both run significantly better than state benchmarks
On the other hand: pressure ulcer rates in high-risk populations reach 10.2%, more than twice the state average, and functional decline measures run 14% worse than peers. For short-stay rehabilitation, 59.1% of residents return successfully to home or community; a rate 17% above state average.
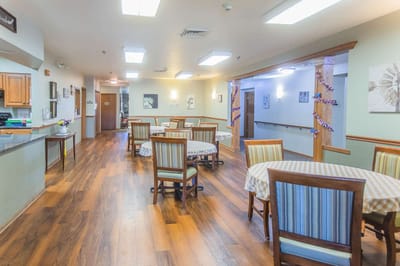
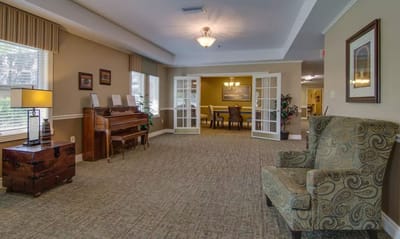
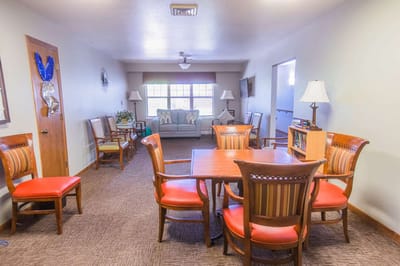
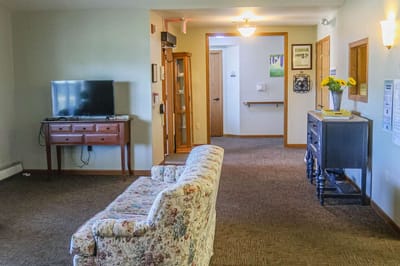
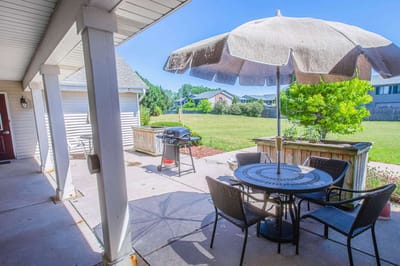
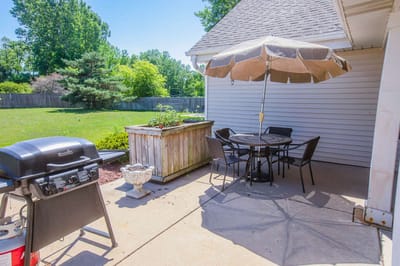
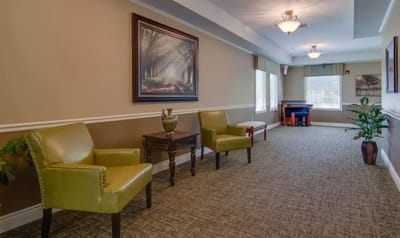
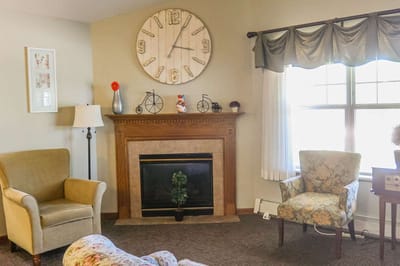
The community offers chef-prepared dining, fitness classes, an on-site salon, pet-friendly spaces, and structured activities.
Current occupancy of 54.9% sits well below the state average, indicating available capacity. The mix of Medicare (46% of admissions), private pay (46%), and Medicaid (8%) reflects a rehabilitation and post-acute focus.
North Point is structured for short-term Medicare rehabilitation and mixed-acuity skilled nursing, serving residents seeking intensive rehabilitation support with ongoing access to therapy and medical oversight.
| Staff type | Hours / Day / Resident | vs state avg |
|---|---|---|
|
Registered Nurse (RN)
| 26m per day | ▼ 39% State avg: 43m per day · National avg: 41m per day |
|
LPN / LVN
| 37m per day | ▼ 8% State avg: 40m per day · National avg: 52m per day |
|
Nurse Aide
| 2h 7m per day | ▼ 22% State avg: 2h 42m per day · National avg: 2h 21m per day |
|
Weekend Total Nursing
| 2h 56m per day | ▼ 18% State avg: 3h 35m per day · National avg: 3h 26m per day |
|
Physical Therapist
| 2m per day | ■ Avg State avg: 2m per day · National avg: 4m per day |
|
Weekend RN
| 21m per day | ▼ 28% State avg: 29m per day · National avg: 29m per day |
Reporting period: October 1 – December 31, 2025 (Q4 2025). Source: CMS Payroll-Based Journal report.
Manages medical care and health needs.
Assists with medical care and medications.
Helps with daily care and mobility.
Total hours from contractors
2,058 contractor hours this quarter
| Certified Nursing Assistant | 32 | 0 | 32 | 8,295 | 92 | 100% | 8.3 |
| Licensed Practical Nurse | 5 | 0 | 5 | 2,324 | 92 | 100% | 8.8 |
| Registered Nurse | 6 | 0 | 6 | 1,470 | 89 | 97% | 8.4 |
| Medication Aide/Technician | 6 | 0 | 6 | 1,405 | 91 | 99% | 8.8 |
| Speech Language Pathologist | 0 | 8 | 8 | 548 | 81 | 88% | 4.2 |
| Nurse Practitioner | 1 | 0 | 1 | 520 | 65 | 71% | 8 |
| RN Director of Nursing | 1 | 0 | 1 | 492 | 56 | 61% | 8.8 |
| Administrator | 1 | 0 | 1 | 488 | 61 | 66% | 8 |
| Physical Therapy Assistant | 0 | 3 | 3 | 453 | 79 | 86% | 5.2 |
| Dental Services Staff | 1 | 0 | 1 | 423 | 56 | 61% | 7.6 |
| Physical Therapy Aide | 0 | 4 | 4 | 404 | 63 | 68% | 5.6 |
| Dietitian | 3 | 0 | 3 | 352 | 50 | 54% | 6.9 |
| Qualified Social Worker | 0 | 3 | 3 | 345 | 64 | 70% | 5.2 |
| Respiratory Therapy Technician | 0 | 5 | 5 | 153 | 45 | 49% | 3.3 |
| Therapeutic Recreation Specialist | 0 | 1 | 1 | 63 | 11 | 12% | 5.7 |
| Occupational Therapy Aide | 0 | 2 | 2 | 43 | 32 | 35% | 1.3 |
| Medical Director | 0 | 1 | 1 | 31 | 18 | 20% | 1.7 |
| Occupational Therapy Assistant | 0 | 1 | 1 | 20 | 3 | 3% | 6.8 |
Federal penalties imposed by CMS for regulatory violations, including civil money penalties (fines) and denials of payment for new Medicare/Medicaid admissions.
Source: CMS Penalties Database
No penalties in the past 3 years
No civil money penalties or payment denials were reported in the last 3 years.
These measures show how residents usually do over time at this home, based on health outcomes and preventive care.
Kansas average: 10.5
Kansas average: 20.7
Kansas average: 19.0%
Kansas average: 19.4%
Kansas average: 23.8%
Kansas average: 4.4%
Kansas average: 4.6%
Kansas average: 3.1%
Kansas average: 5.1%
Kansas average: 5.2%
Kansas average: 16.9%
Kansas average: 91.9%
Kansas average: 95.5%
Kansas average: 1.84
Kansas average: 2.16
Kansas average: 75.6%
Kansas average: 2.2%
Kansas average: 73.5%
Kansas average: 23.0%
Kansas average: 11.7%
Kansas average: 0.8%
Kansas average: 53.7%
Kansas average: 50.6%
Quality measures are calculated from Minimum Data Set (MDS) assessments. For most measures, lower percentages indicate better care quality.
46% of new residents, usually for short-term rehab.
46% of new residents, often for short stays.
8% of new residents, often for long-term daily care.
Source: CMS Long-Term Care Facility Characteristics (Data as of Jan 2026)
Residents meet regularly to discuss policies, care quality, and activities
State-approved Nurse Aide Training and Competency Evaluation Program on-site
Organized group of residents that meets regularly to discuss facility policies, quality of life, and activities.
Data sourced from CMS Long-Term Care Facility Characteristics quarterly report. Payer mix reflects the current resident census by primary payment source.
Historical financial and operational data for North Point from 2011–2023, based on CMS SNF Cost Reports.
Key figures below are for fiscal year ending in 12/2023.
Based on CMS SNF Cost Report for fiscal year ending in 12/2023.
Pets Allowed
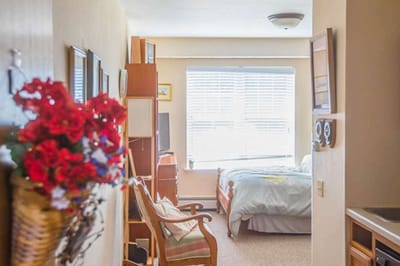
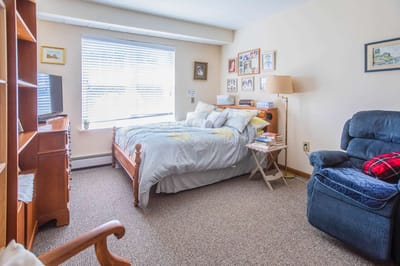
Room Sizes: 200 / 250 sq. ft.
Housing Options: Studio
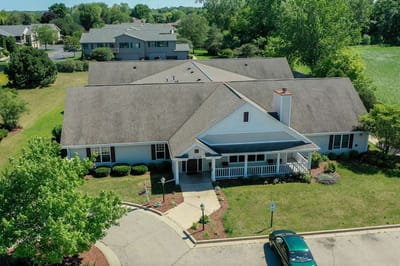
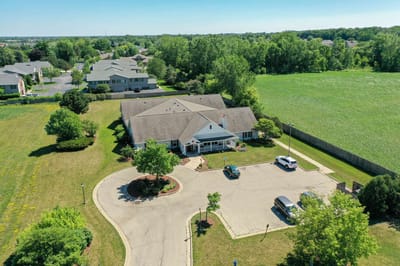
Building Type: Single-story
Transportation Services
Fitness and Recreation
This home supports both short-term rehab and long-term care, with residents staying for a wide range of durations.
New residents most often arrive under Medicare (46% of admissions), and a typical Medicare stay runs around 1 months.
Coverage residents most often arrive under.
Coverage residents most often leave under.
![]() 0.7 miles from city center
0.7 miles from city center
![]() Estimated distance in miles from Paola's city center to North Point's address, calculated via Google Maps.
Estimated distance in miles from Paola's city center to North Point's address, calculated via Google Maps.
Add your location
Info below is compiled from CMS reports & the KS Dept. for Aging & Disability Services (KDADS), senior community websites & trusted data sources such as Walk Score & BBB.
Communities are listed from highest to lowest based on our ranking methodology.
| North Point | AL NH MC RC | Paola | 53
Facility
53
KS AVG
69
Rank
#127 / 223 |
94.0%
Facility
94.0%
KS AVG
76.8
Rank
#20 / 206 | +22% | 3.74
Facility
3.74
KS AVG
4.63
Rank
#121 / 141 | -30% | -19% | $0
Facility
$0
KS AVG
$49.2k
Rank
#1 / 144 | 5
Facility
5
KS AVG
26.9
Rank
#1 / 144 | 5.0
Facility
5.0
KS AVG
6.1
Rank
#49 / 144 | - | 50 | - |
28
Facility
28
KS AVG
46
Rank
#269 / 363 | Holly Hess | $4.3MFiscal year ending 12/2023
Facility
$4.3MFiscal year ending 12/2023
KS AVG
$7.3M
Rank
#110 / 143 | $2.3MFiscal year ending 12/2023
Facility
$2.3MFiscal year ending 12/2023
KS AVG
$3.3M
Rank
#112 / 143 | 53.3%Fiscal year ending 12/2023
Facility
53.3%Fiscal year ending 12/2023
KS AVG
47.9%
Rank
#58 / 143 | 175276 | ||||
| The Healthcare Resort of Kansas City | AL NH SNF | Kansas City (Victory Hills) | 70
Facility
70
KS AVG
69
Rank
#83 / 223 |
94.3%
Facility
94.3%
KS AVG
76.8
Rank
#19 / 206 | +23% | 5.05
Facility
5.05
KS AVG
4.63
Rank
#42 / 141 | -36% | +9% | $28.8k
Facility
$28.8k
KS AVG
$49.2k
Rank
#108 / 144 | 45
Facility
45
KS AVG
26.9
Rank
#123 / 144 | 9.0
Facility
9.0
KS AVG
6.1
Rank
#127 / 144 | 3 | 66 | - |
11
Facility
11
KS AVG
46
Rank
#336 / 363 | Ryan Leiker | $9.0MFiscal year ending 12/2023
Facility
$9.0MFiscal year ending 12/2023
KS AVG
$7.3M
Rank
#46 / 143 | $5.7MFiscal year ending 12/2023
Facility
$5.7MFiscal year ending 12/2023
KS AVG
$3.3M
Rank
#42 / 143 | 62.9%Fiscal year ending 12/2023
Facility
62.9%Fiscal year ending 12/2023
KS AVG
47.9%
Rank
#51 / 143 | 175548 | ||||
| Riverbend Post Acute Rehabilitation | - | AL MC NH SNF | Kansas City (Victory Hills) | 131
Facility
131
KS AVG
69
Rank
#15 / 223 |
91.9%
Facility
91.9%
KS AVG
76.8
Rank
#28 / 206 | +20% | 3.83
Facility
3.83
KS AVG
4.63
Rank
#109 / 141 | - | - | - | -7% | -17% | $84.0k
Facility
$84.0k
KS AVG
$49.2k
Rank
#132 / 144 | 33
Facility
33
KS AVG
26.9
Rank
#102 / 144 | 5.5
Facility
5.5
KS AVG
6.1
Rank
#62 / 144 | 1 | 120 | - |
57
Facility
57
KS AVG
46
Rank
#119 / 363 | Cory Schulte | $12.3MFiscal year ending 12/2023
Facility
$12.3MFiscal year ending 12/2023
KS AVG
$7.3M
Rank
#23 / 143 | $7.9MFiscal year ending 12/2023
Facility
$7.9MFiscal year ending 12/2023
KS AVG
$3.3M
Rank
#19 / 143 | 64.3%Fiscal year ending 12/2023
Facility
64.3%Fiscal year ending 12/2023
KS AVG
47.9%
Rank
#47 / 143 | 175298 |
North Point is located in Paola, Kansas.
Here are the financial assistance programs available to residents in Kansas.
North Point is in the Paola neighborhood.
North Point has a walk score of 28. Somewhat walkable. A few nearby services may be reachable on foot, but most trips require transportation.
North Point's occupancy is 54.9%.
Yes, North Point allows residents to bring their pets.
North Point is registered as a for-profit.
Yes — there are 18 photos of North Point in the photo gallery on this page.
North Point is located at 908 N Pearl St, Paola, KS 66071.
Care Cost Calculator: See Prices in Your Area
Nursing Home Data Explorer
Don’t Wait Too Long: 7 Red Flag Signs Your Parent Needs Assisted Living Now
The True Cost of Assisted Living in 2025 – And How Families Are Paying For It
Understanding Senior Living Costs: Pricing Models, Discounts & Financial Assistance


