


Total health inspections
5
Kansas average 4.5
Last Health inspection on Jul 2024
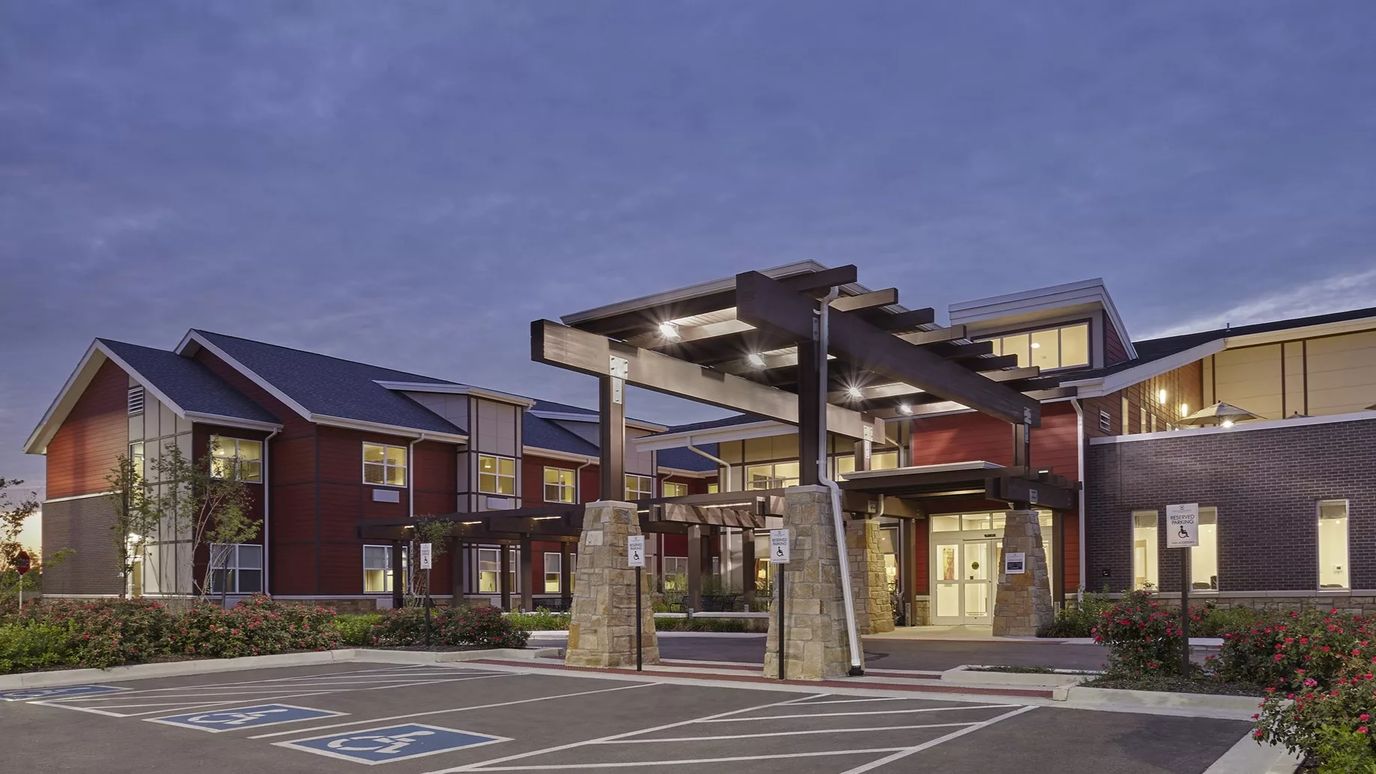

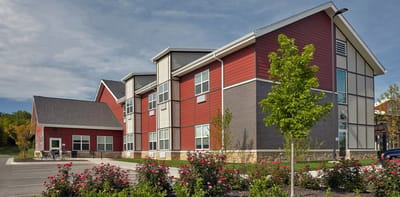


Situated at 8900 Parallel Parkway in Kansas City’s Victory Hills neighborhood, The Healthcare Resort of Kansas City operates 105 beds under private ownership by Ryan Leiker.
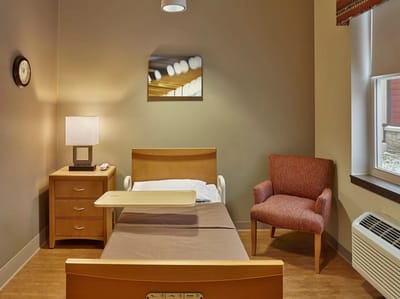
The facility launched in May 2015 as a dual nursing home and assisted living community accepting Medicare, Medicaid, and private-pay residents. Its 3-star overall CMS rating reflects mixed clinical performance. The current census is 66 residents at 62.9% occupancy, below the Kansas state average of 79.5%. The facility’s care model emphasizes short-stay rehabilitation, with an average length of stay of 58 days.
Five surveys since 2021 identified 54 deficiencies; 46% fewer than the typical Kansas nursing home. Yet the July 2024 routine inspection found 13 deficiencies spanning resident safety, medication management, and training compliance.
Notably, the facility received three serious citations, 233% above the Kansas state rate for this severity level. A March 2024 complaint investigation documented failure to prevent surgical amputation when inadequate diabetic foot wound care allowed progressive infection.
CMS imposed a $29,000 penalty in July 2024.
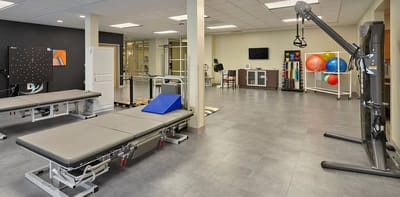
Total nursing coverage averages 5 hours 3 minutes per resident daily, 7% above Kansas state average. Nurse aide hours average 3 hours 18 minutes (22% above state), and on-site physical therapy runs 8 minutes per resident per day—triple the state average. The staff-to-resident ratio of 3.24:1 is 45% better than state norms.
However, payroll represents only 54.5% of revenue, placing the facility near the bottom third statewide on this metric.
The facility achieved 5-star performance on quality measures, 55.8% above Kansas averages. Long-stay residents show strong functional recovery, with 72.2% achieving expected self-care ability at discharge (35% above state average) and 63.8% successfully returning home or community (26% above average). Conversely, 17.6% of residents experienced significant unintended weight loss—246% worse than state average—and pressure ulcer rates in high-risk residents run 30% above state average.
The facility serves primarily short-stay Medicare rehabilitation and private-pay admissions requiring skilled nursing intervention during transitional care episodes.
| Staff type | Hours / Day / Resident | vs state avg |
|---|---|---|
|
Registered Nurse (RN)
| 36m per day | ▼ 16% State avg: 43m per day · National avg: 41m per day |
|
LPN / LVN
| 55m per day | ▲ 38% State avg: 40m per day · National avg: 52m per day |
|
Nurse Aide
| 2h 49m per day | ▲ 4% State avg: 2h 42m per day · National avg: 2h 21m per day |
|
Weekend Total Nursing
| 3h 43m per day | ▲ 4% State avg: 3h 35m per day · National avg: 3h 26m per day |
|
Physical Therapist
| 9m per day | ▲ 330% State avg: 2m per day · National avg: 4m per day |
|
Weekend RN
| 12m per day | ▼ 58% State avg: 29m per day · National avg: 29m per day |
Key information about the people who lead and staff this community.
In Kansas, the Department for Aging and Disability Services, Survey and Certification Commission performs the unannounced inspections required for facility licensing and federal certification.
Deficiencies
| This Facility | KS Average | vs. KS Avg |
|---|---|---|---|
|
Total deficiencies
| 62 | 100 | This facility has 38% fewer total deficiencies than a typical Kansas nursing home (62 vs. KS avg 100).↓ 38% better |
|
Deficiencies per year
| 12.4 | 20 | This facility has 38% fewer deficiencies per year than a typical Kansas nursing home (12.4 vs. KS avg 20).↓ 38% better |
Kansas average 4.5
Last Health inspection on Jul 2024
Kansas average 26.9
Kansas average 6.07
Health citations are formal notices following inspections when they fail to comply with safety and care standards.
24 of 45 citations resulted from standard inspections; 3 of 45 resulted from complaint investigations; and 18 of 45 came from combined inspections (standard and complaint).
Kansas average: 0.9
Kansas average: 0.9
Reporting period: October 1 – December 31, 2025 (Q4 2025). Source: CMS Payroll-Based Journal report.
Manages medical care and health needs.
Assists with medical care and medications.
Helps with daily care and mobility.
Total hours from contractors
1,153 contractor hours this quarter
| Certified Nursing Assistant | 47 | 19 | 66 | 11,190 | 92 | 100% | 7.6 |
| Licensed Practical Nurse | 21 | 35 | 56 | 5,253 | 92 | 100% | 9.7 |
| Medication Aide/Technician | 31 | 12 | 43 | 4,929 | 92 | 100% | 7.6 |
| Registered Nurse | 7 | 7 | 14 | 1,696 | 88 | 96% | 8.2 |
| Dental Services Staff | 3 | 0 | 3 | 1,665 | 71 | 77% | 8.4 |
| Qualified Social Worker | 4 | 0 | 4 | 1,325 | 66 | 72% | 7.4 |
| Clinical Nurse Specialist | 7 | 0 | 7 | 1,140 | 66 | 72% | 7.2 |
| Speech Language Pathologist | 4 | 0 | 4 | 1,053 | 79 | 86% | 6.7 |
| Respiratory Therapy Technician | 4 | 0 | 4 | 821 | 64 | 70% | 7.4 |
| Other Dietary Services Staff | 2 | 0 | 2 | 684 | 65 | 71% | 6.6 |
| Physical Therapy Assistant | 2 | 0 | 2 | 600 | 60 | 65% | 7.8 |
| Nurse Practitioner | 1 | 0 | 1 | 594 | 66 | 72% | 9 |
| Administrator | 1 | 0 | 1 | 528 | 66 | 72% | 8 |
| Dietitian | 1 | 0 | 1 | 520 | 65 | 71% | 8 |
| Physical Therapy Aide | 4 | 0 | 4 | 442 | 61 | 66% | 6.6 |
| Occupational Therapy Aide | 1 | 0 | 1 | 216 | 27 | 29% | 8 |
| Physical Therapist | 1 | 0 | 1 | 6 | 1 | 1% | 5.9 |
Includes penalties issued in 2024
Federal penalties imposed by CMS for regulatory violations, including civil money penalties (fines) and denials of payment for new Medicare/Medicaid admissions.
Source: CMS Penalties Database (Data as of Jan 2026)
Kansas average: $44K
Kansas average: 2.4
Kansas average: 0.3
Penalties are imposed by CMS for violations of federal nursing home regulations.
1 penalty in the past 3 years
Jul 10, 2024 · $29K
Last updated: Jan 2026
These measures show how residents usually do over time at this home, based on health outcomes and preventive care.
Kansas average: 10.5
Kansas average: 20.7
Kansas average: 19.0%
Kansas average: 19.4%
Kansas average: 23.8%
Kansas average: 4.4%
Kansas average: 4.6%
Kansas average: 3.1%
Kansas average: 5.1%
Kansas average: 5.2%
Kansas average: 16.9%
Kansas average: 91.9%
Kansas average: 95.5%
Kansas average: 75.6%
Kansas average: 2.2%
Kansas average: 73.5%
Kansas average: 23.0%
Kansas average: 11.7%
Kansas average: 0.8%
Kansas average: 53.7%
Kansas average: 50.6%
Quality measures are calculated from Minimum Data Set (MDS) assessments. For most measures, lower percentages indicate better care quality.
25% of new residents, usually for short-term rehab.
70% of new residents, often for short stays.
5% of new residents, often for long-term daily care.
Source: CMS Long-Term Care Facility Characteristics (Data as of Jan 2026)
Residents meet regularly to discuss policies, care quality, and activities
Family members meet regularly to discuss policies, care quality, and activities
State-approved Nurse Aide Training and Competency Evaluation Program on-site
Part of a Continuing Care Retirement Community offering multiple care levels
Organized group of family members that meets regularly to discuss facility policies, resident care, and activities.
Organized group of residents that meets regularly to discuss facility policies, quality of life, and activities.
Data sourced from CMS Long-Term Care Facility Characteristics quarterly report. Payer mix reflects the current resident census by primary payment source.
Historical financial and operational data for The Healthcare Resort of Kansas City from 2016–2023, based on CMS SNF Cost Reports.
Key figures below are for fiscal year ending in 12/2023.
Based on CMS SNF Cost Report for fiscal year ending in 12/2023.
Residents typically stay for brief periods, with frequent admissions and discharges throughout the year.
Most new residents arrive under private pay (70% of admissions), and a typical private pay stay runs around 1 - 2 months.
Coverage residents most often arrive under.
Coverage residents most often leave under.
![]() 9.4 miles from city center
9.4 miles from city center
![]() Estimated distance in miles from Kansas City's city center to The Healthcare Resort of Kansas City's address, calculated via Google Maps.
— 0.27 miles to nearest hospital (Providence Medical Center)
Estimated distance in miles from Kansas City's city center to The Healthcare Resort of Kansas City's address, calculated via Google Maps.
— 0.27 miles to nearest hospital (Providence Medical Center)
Add your location
The information below is reported by the Kansas Department for Aging and Disability Services.
| The Healthcare Resort of Kansas City | NH AL SNF | Kansas City (Victory Hills) | 70
Facility
70
KS AVG
69
Rank
#83 / 224 |
94.3%
Facility
94.3%
KS AVG
76.7
Rank
#19 / 207 | +23% | 5.05
Facility
5.05
KS AVG
4.63
Rank
#43 / 144 | -36% | +9% | $28.8k
Facility
$28.8k
KS AVG
$49.2k
Rank
#111 / 147 | 45
Facility
45
KS AVG
26.9
Rank
#126 / 147 | 9.0
Facility
9.0
KS AVG
6.1
Rank
#130 / 147 | 3 | 66 | - |
11
Facility
11
KS AVG
46
Rank
#336 / 363 | Ryan Leiker | $9.0MFiscal year ending 12/2023
Facility
$9.0MFiscal year ending 12/2023
KS AVG
$7.3M
Rank
#46 / 148 | $5.7MFiscal year ending 12/2023
Facility
$5.7MFiscal year ending 12/2023
KS AVG
$3.3M
Rank
#43 / 148 | 62.9%Fiscal year ending 12/2023
Facility
62.9%Fiscal year ending 12/2023
KS AVG
47.9%
Rank
#54 / 148 | 175548 | ||||
| Kansas City Transitional Care | NH PC SNF | Kansas City (Rosedale) | 96
Facility
96
KS AVG
69
Rank
#40 / 224 |
97.9%
Facility
97.9%
KS AVG
76.7
Rank
#9 / 207 | +28% | 3.08
Facility
3.08
KS AVG
4.63
Rank
#137 / 144 | +43% | -34% | $0
Facility
$0
KS AVG
$49.2k
Rank
#1 / 147 | 42
Facility
42
KS AVG
26.9
Rank
#120 / 147 | 5.3
Facility
5.3
KS AVG
6.1
Rank
#59 / 147 | 1 | 94 | - |
79
Facility
79
KS AVG
46
Rank
#21 / 363 | Ignite Kumed Jv LLC | $12.1MFiscal year ending 12/2023
Facility
$12.1MFiscal year ending 12/2023
KS AVG
$7.3M
Rank
#26 / 148 | $4.9MFiscal year ending 12/2023
Facility
$4.9MFiscal year ending 12/2023
KS AVG
$3.3M
Rank
#49 / 148 | 40.2%Fiscal year ending 12/2023
Facility
40.2%Fiscal year ending 12/2023
KS AVG
47.9%
Rank
#129 / 148 | 175544 | ||||
| Riverbend Post Acute Rehabilitation | - | NH AL MC SNF | Kansas City (Victory Hills) | 131
Facility
131
KS AVG
69
Rank
#15 / 224 |
91.9%
Facility
91.9%
KS AVG
76.7
Rank
#28 / 207 | +20% | 3.83
Facility
3.83
KS AVG
4.63
Rank
#112 / 144 | - | - | - | -7% | -17% | $84.0k
Facility
$84.0k
KS AVG
$49.2k
Rank
#135 / 147 | 33
Facility
33
KS AVG
26.9
Rank
#105 / 147 | 5.5
Facility
5.5
KS AVG
6.1
Rank
#64 / 147 | 1 | 120 | - |
57
Facility
57
KS AVG
46
Rank
#119 / 363 | Cory Schulte | $12.3MFiscal year ending 12/2023
Facility
$12.3MFiscal year ending 12/2023
KS AVG
$7.3M
Rank
#23 / 148 | $7.9MFiscal year ending 12/2023
Facility
$7.9MFiscal year ending 12/2023
KS AVG
$3.3M
Rank
#19 / 148 | 64.3%Fiscal year ending 12/2023
Facility
64.3%Fiscal year ending 12/2023
KS AVG
47.9%
Rank
#50 / 148 | 175298 |
The Healthcare Resort of Kansas City is located in Kansas City, Kansas.
Here are the financial assistance programs available to residents in Kansas.
The Healthcare Resort of Kansas City is in the Victory Hills neighborhood of Kansas City.
The Healthcare Resort of Kansas City has a walk score of 11. Car-dependent. Most errands require a car, with limited nearby walkable options.
The Healthcare Resort of Kansas City's occupancy is 74.1%.
No, The Healthcare Resort of Kansas City has a no-pet policy.
The Healthcare Resort of Kansas City is registered as a for-profit in KS.
Yes — there are 9 photos of The Healthcare Resort of Kansas City in the photo gallery on this page.
The Healthcare Resort of Kansas City is located at 8900 Parallel Pkwy, Kansas City, KS 66112.
Care Cost Calculator: See Prices in Your Area
Nursing Home Data Explorer
Don’t Wait Too Long: 7 Red Flag Signs Your Parent Needs Assisted Living Now
The True Cost of Assisted Living in 2025 – And How Families Are Paying For It
Understanding Senior Living Costs: Pricing Models, Discounts & Financial Assistance


