Total health inspections
5
California average 12.5
Last Health inspection on Mar 2025

We arrange tours, appointments, and even moving support so you don’t have to
Thank you for your interest!
Our team will be in touch shortly to help with next steps.
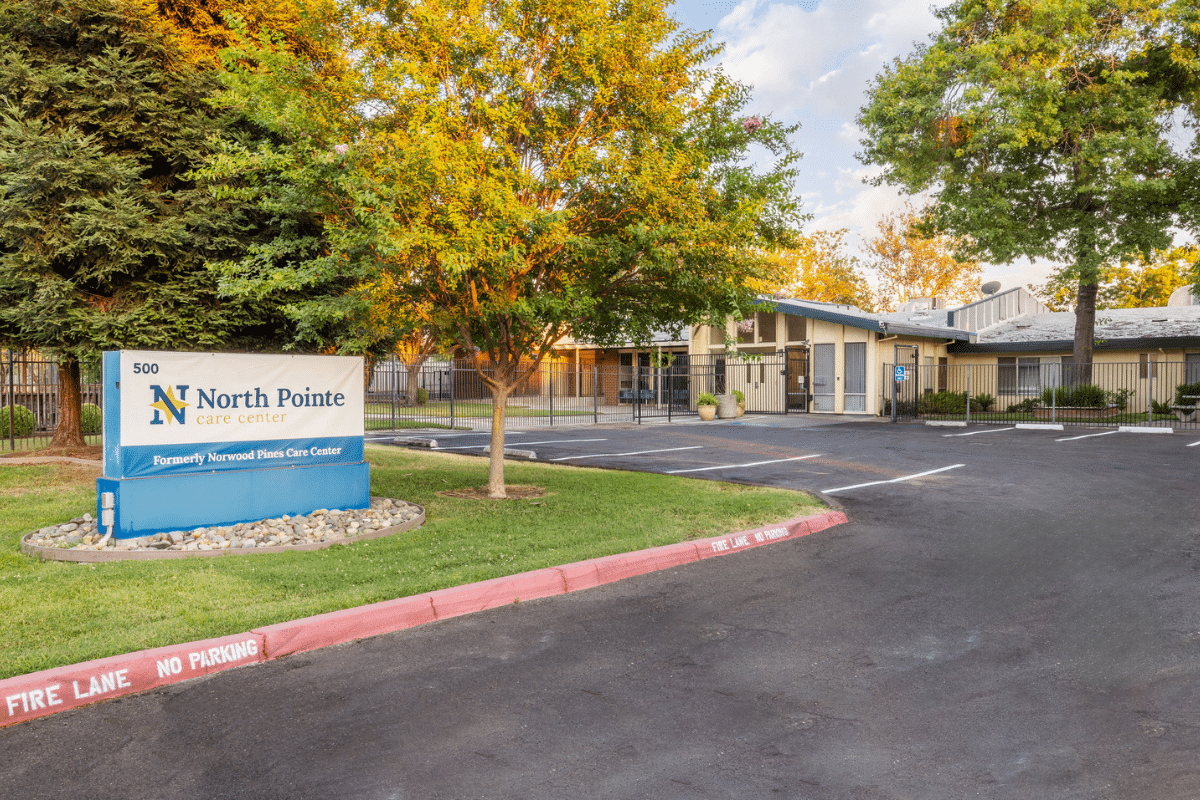


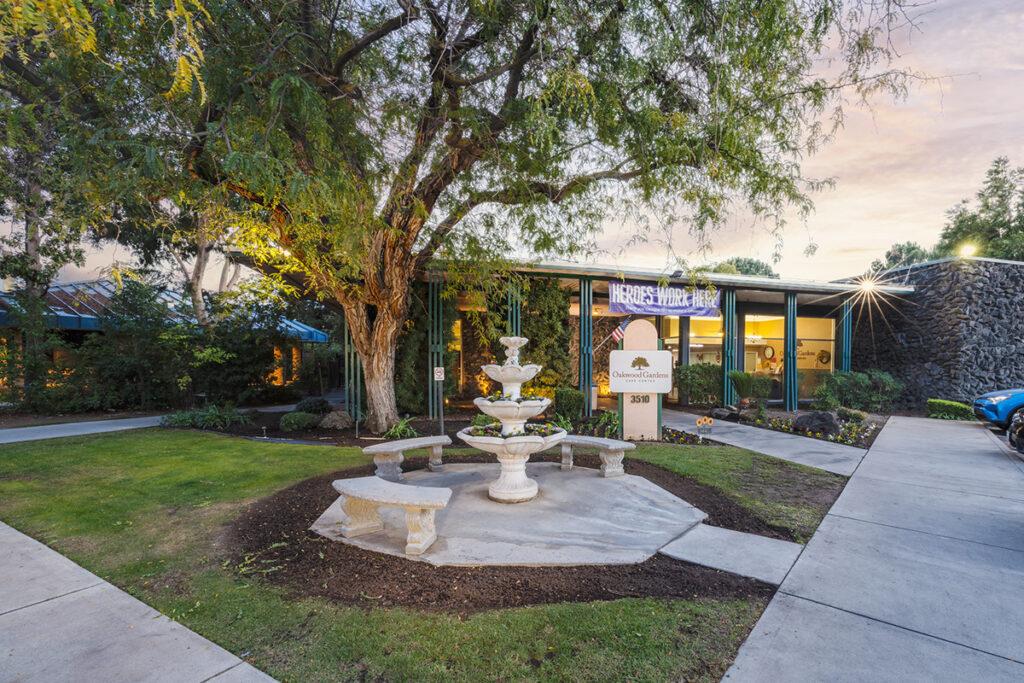
North Point Healthcare and Wellness Centre, located in the picturesque community of Fresno, California, is a skilled nursing facility with top-notch nurses, caregivers, and therapists. Their dedicated staff offers round-the-clock one-on-one attention and care to patients, regardless of whether they require short-term or long-term care. North Point Healthcare and Wellness Centre ensures that their time spent here is a rejuvenating experience, both physically and spiritually.
With a diverse range of services, North Point Healthcare and Wellness Centre ensures that residents receive the utmost medical, restorative, and compassionate care they deserve. Whether in need of short-term rehabilitation or more traditional long-term care, the facility accommodates various senior requirements and caters to all nursing, physical therapy, and medical social services needs.
Offers a balance of services and community atmosphere.
Occupancy is moderate, suggesting balanced demand.
Most residents typically stay for a few weeks or months before returning home or moving on.
79% of new residents, usually for short-term rehab.
13% of new residents, often for short stays.
8% of new residents, often for long-term daily care.
Accept Medicaid: Yes
California average 12.5
Last Health inspection on Mar 2025
California average 50.2
California average 4.65
Health citations are formal notices following inspections when they fail to comply with safety and care standards.
19 of 21 citations resulted from standard inspections; and 2 of 21 resulted from complaint investigations.
California average: 0.4
California average: 1
Data sourced from CMS Health Deficiencies reports. Citation severity codes range from A (least serious) to L (most serious). Immediate Jeopardy (J-L) citations indicate situations where the facility's noncompliance has placed residents at risk of death or serious harm.
Nursing Home Licensed facility providing 24/7 skilled nursing care for residents with complex, ongoing medical needs. Staffed by RNs, LPNs, and CNAs. Inspected and star-rated annually by CMS. Accepts Medicare (short-term rehab) and Medicaid (long-term care).
Assisted Living A licensed, long-term care setting for seniors or individuals with disabilities who need help with daily activities — like bathing, dressing, and medication management — but not 24-hour skilled nursing. Offers housing, meals, and around-the-clock support while aiming to maximize resident independence.
Nursing Home Licensed facility providing 24/7 skilled nursing care for residents with complex, ongoing medical needs. Staffed by RNs, LPNs, and CNAs. Inspected and star-rated annually by CMS. Accepts Medicare (short-term rehab) and Medicaid (long-term care).
Nursing Home Licensed facility providing 24/7 skilled nursing care for residents with complex, ongoing medical needs. Staffed by RNs, LPNs, and CNAs. Inspected and star-rated annually by CMS. Accepts Medicare (short-term rehab) and Medicaid (long-term care).
Assisted Living A licensed, long-term care setting for seniors or individuals with disabilities who need help with daily activities — like bathing, dressing, and medication management — but not 24-hour skilled nursing. Offers housing, meals, and around-the-clock support while aiming to maximize resident independence.
Nursing Home Licensed facility providing 24/7 skilled nursing care for residents with complex, ongoing medical needs. Staffed by RNs, LPNs, and CNAs. Inspected and star-rated annually by CMS. Accepts Medicare (short-term rehab) and Medicaid (long-term care).
![]() 7.5 miles from city center — 0.36 miles to nearest hospital (Fresno Surgical Hospital)
7.5 miles from city center — 0.36 miles to nearest hospital (Fresno Surgical Hospital)
![]() 668 E Bullard Ave, Fresno, CA 93710
668 E Bullard Ave, Fresno, CA 93710
Add your location
This data corresponds to Q2 2025 and is based on CMS Payroll-Based Journal.
California average ratio: 0.00:1
California average: 7.7 hours
Manages medical care and health needs.
No contractors work on this role.
Assists with medical care and medications.
No contractors work on this role.
Helps with daily care and mobility.
No contractors work on this role.
Total hours from contractors
0 contractor hours this quarter
No contractor roles were reported this quarter.
| Certified Nursing Assistant | 68 | 0 | 68 | 20,841 | 91 | 100% | 7.2 |
| Licensed Practical Nurse | 17 | 0 | 17 | 5,668 | 91 | 100% | 7.8 |
| Registered Nurse | 11 | 0 | 11 | 4,096 | 91 | 100% | 7.8 |
| RN Director of Nursing | 3 | 0 | 3 | 1,468 | 68 | 75% | 8 |
| Speech Language Pathologist | 3 | 0 | 3 | 1,250 | 79 | 87% | 6.5 |
| Physical Therapy Aide | 5 | 0 | 5 | 1,205 | 72 | 79% | 7 |
| Clinical Nurse Specialist | 2 | 0 | 2 | 994 | 67 | 74% | 8 |
| Other Dietary Services Staff | 3 | 0 | 3 | 726 | 88 | 97% | 7.2 |
| Respiratory Therapy Technician | 1 | 0 | 1 | 512 | 64 | 70% | 8 |
| Administrator | 1 | 0 | 1 | 504 | 63 | 69% | 8 |
| Dietitian | 1 | 0 | 1 | 440 | 56 | 62% | 7.9 |
| Mental Health Service Worker | 1 | 0 | 1 | 361 | 55 | 60% | 6.6 |
| Dental Services Staff | 1 | 0 | 1 | 310 | 44 | 48% | 7 |
| Qualified Social Worker | 2 | 0 | 2 | 125 | 36 | 40% | 3.1 |
| Physical Therapy Assistant | 1 | 0 | 1 | 10 | 2 | 2% | 5.2 |
Source: CMS Long-Term Care Facility Characteristics (Data as of Jan 2026)
Residents meet regularly to discuss policies, care quality, and activities
Organized group of residents that meets regularly to discuss facility policies, quality of life, and activities.
Data sourced from CMS Long-Term Care Facility Characteristics quarterly report. Payer mix reflects the current resident census by primary payment source.
These measures show how residents usually do over time at this home, based on health outcomes and preventive care.
California average: 6.6
California average: 11.3
California average: 11.1%
California average: 12.0%
California average: 11.3%
California average: 1.7%
California average: 5.0%
California average: 1.2%
California average: 4.2%
California average: 6.7%
California average: 10.1%
California average: 98.5%
California average: 98.2%
California average: 94.0%
California average: 1.5%
California average: 93.2%
Quality measures are calculated from Minimum Data Set (MDS) assessments. For most measures, lower percentages indicate better care quality.
Historical financial and operational data for North Pointe Care Center based on CMS SNF Cost Reports.
Loading trend charts...
Care Cost Calculator: See Prices in Your Area
Nursing Home Data Explorer
Don’t Wait Too Long: 7 Red Flag Signs Your Parent Needs Assisted Living Now
The True Cost of Assisted Living in 2025 – And How Families Are Paying For It
Understanding Senior Living Costs: Pricing Models, Discounts & Financial Assistance

Touring a community? Use this expert-backed checklist to stay organized, ask the right questions, and find the perfect fit.
We'll send you a PDF version of the touring checklist.