Total health inspections
3
Florida average 4.3
Last Health inspection on May 2024

We arrange tours, appointments, and even moving support so you don’t have to
Thank you for your interest!
Our team will be in touch shortly to help with next steps.


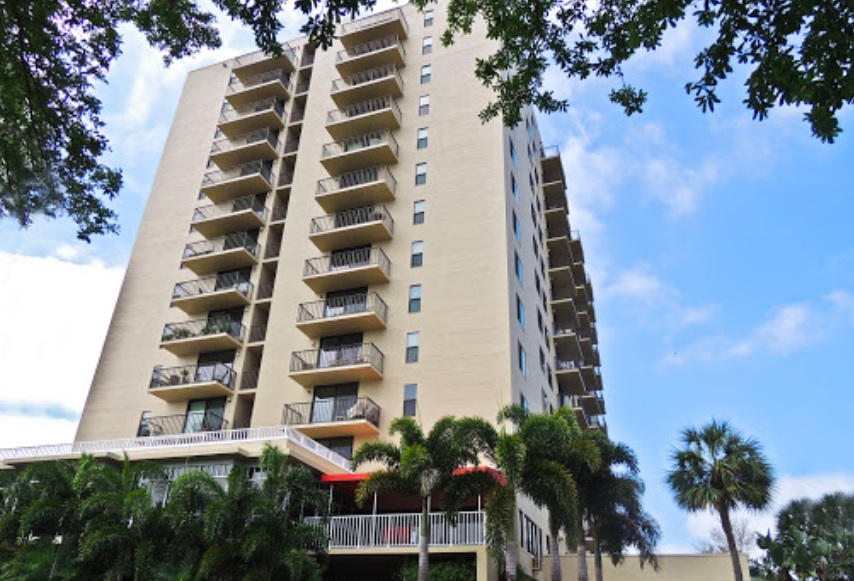
A recipient of the 5-Star Quality Measures rating from the Centers for Medicare and Medicaid, Northdale Rehabilitation Center is a skilled nursing facility in Tampa. It offers a wide range of clinical services such as infusion therapy, wound care, enteral therapy, and rehabilitation, to name a few, through its subacute care, long-term care, respite care, and hospice care programs. It promotes accessible medical services as it accepts numerous insurance providers including WellCare, Aetna, Medicare, UnitedHealthcare, Coventry, DevotedHealth, FreedomHealth, Medicaid, and Wellmed.
Striving to holistically empower seniors to achieve a higher quality of life, they have private and semi-private rooms available for residents surrounded by picturesque landscaped grounds. Amenities at this facility include dining areas, a salon, numerous common areas, private visitation areas, and hospitality services.
Brian McCoy is the Administrator at Northdale Rehabilitation Center, known for his genuine concern and professionalism. He actively leads the team to ensure exceptional care and responsiveness to residents and their families, exemplified by his prompt action during a family care meeting.
Offers a balance of services and community atmosphere.
Occupancy is moderate, suggesting balanced demand.
This home supports both short-term rehab and long-term care, with residents staying for a wide range of durations.
36% of new residents, usually for short-term rehab.
59% of new residents, often for short stays.
5% of new residents, often for long-term daily care.
Florida average 4.3
Last Health inspection on May 2024
Florida average 19.7
Florida average 4.48
Health citations are formal notices following inspections when they fail to comply with safety and care standards.
14 of 15 citations resulted from standard inspections; and 1 of 15 came from combined inspections (standard and complaint).
Florida average: 0.8
Florida average: 0.4
Data sourced from CMS Health Deficiencies reports. Citation severity codes range from A (least serious) to L (most serious). Immediate Jeopardy (J-L) citations indicate situations where the facility's noncompliance has placed residents at risk of death or serious harm.
Nursing Home Licensed facility providing 24/7 skilled nursing care for residents with complex, ongoing medical needs. Staffed by RNs, LPNs, and CNAs. Inspected and star-rated annually by CMS. Accepts Medicare (short-term rehab) and Medicaid (long-term care).
Assisted Living A licensed, long-term care setting for seniors or individuals with disabilities who need help with daily activities — like bathing, dressing, and medication management — but not 24-hour skilled nursing. Offers housing, meals, and around-the-clock support while aiming to maximize resident independence.
![]() 9.5 miles from city center — 4.4 miles to nearest hospital (AdventHealth Pepin Heart Institute)
9.5 miles from city center — 4.4 miles to nearest hospital (AdventHealth Pepin Heart Institute)
Add your location
This data corresponds to Q2 2025 and is based on CMS Payroll-Based Journal.
Florida average ratio: 1.52:1
Florida average: 7.9 hours
Manages medical care and health needs.
No contractors work on this role.
Assists with medical care and medications.
No contractors work on this role.
Helps with daily care and mobility.
No contractors work on this role.
Total hours from contractors
225 contractor hours this quarter
| Certified Nursing Assistant | 72 | 0 | 72 | 21,946 | 91 | 100% | 7.5 |
| Licensed Practical Nurse | 24 | 0 | 24 | 7,824 | 91 | 100% | 7.2 |
| Registered Nurse | 15 | 0 | 15 | 5,069 | 91 | 100% | 8.4 |
| Respiratory Therapy Technician | 5 | 0 | 5 | 1,393 | 83 | 91% | 7.3 |
| Speech Language Pathologist | 6 | 0 | 6 | 1,100 | 69 | 76% | 7.2 |
| Dietitian | 3 | 0 | 3 | 1,030 | 76 | 84% | 7.7 |
| Dental Services Staff | 3 | 0 | 3 | 1,007 | 69 | 76% | 6.4 |
| Physical Therapy Assistant | 4 | 0 | 4 | 988 | 78 | 86% | 6.1 |
| Qualified Social Worker | 6 | 0 | 6 | 941 | 69 | 76% | 7.3 |
| Physical Therapy Aide | 4 | 0 | 4 | 910 | 67 | 74% | 7.2 |
| Occupational Therapy Aide | 1 | 3 | 4 | 721 | 67 | 74% | 7.7 |
| RN Director of Nursing | 4 | 0 | 4 | 618 | 67 | 74% | 2.7 |
| Occupational Therapist | 2 | 0 | 2 | 570 | 70 | 77% | 8.1 |
| Mental Health Service Worker | 2 | 0 | 2 | 541 | 62 | 68% | 7.9 |
| Administrator | 1 | 0 | 1 | 512 | 64 | 70% | 8 |
| Nurse Practitioner | 1 | 0 | 1 | 480 | 60 | 66% | 8 |
| Clinical Nurse Specialist | 1 | 0 | 1 | 440 | 55 | 60% | 8 |
Source: CMS Long-Term Care Facility Characteristics (Data as of Jan 2026)
Residents meet regularly to discuss policies, care quality, and activities
Organized group of residents that meets regularly to discuss facility policies, quality of life, and activities.
Data sourced from CMS Long-Term Care Facility Characteristics quarterly report. Payer mix reflects the current resident census by primary payment source.
These measures show how residents usually do over time at this home, based on health outcomes and preventive care.
Florida average: 7.4
Florida average: 12.4
Florida average: 10.5%
Florida average: 12.9%
Florida average: 13.5%
Florida average: 2.6%
Florida average: 5.4%
Florida average: 0.9%
Florida average: 6.0%
Florida average: 3.3%
Florida average: 8.0%
Florida average: 97.7%
Florida average: 99.2%
Florida average: 2.10
Florida average: 1.18
Florida average: 94.0%
Florida average: 1.5%
Florida average: 94.7%
Florida average: 26.2%
Florida average: 9.3%
Florida average: 0.8%
Florida average: 53.7%
Florida average: 50.6%
Quality measures are calculated from Minimum Data Set (MDS) assessments. For most measures, lower percentages indicate better care quality.
Historical financial and operational data for Northdale Rehabilitation Center based on CMS SNF Cost Reports.
Loading trend charts...
Care Cost Calculator: See Prices in Your Area
Nursing Home Data Explorer
Don’t Wait Too Long: 7 Red Flag Signs Your Parent Needs Assisted Living Now
The True Cost of Assisted Living in 2025 – And How Families Are Paying For It
Understanding Senior Living Costs: Pricing Models, Discounts & Financial Assistance

Touring a community? Use this expert-backed checklist to stay organized, ask the right questions, and find the perfect fit.
We'll send you a PDF version of the touring checklist.