Northern Manor
Nursing Home · New City, NY
CMS overall rating Info The Overall CMS Rating is scored from 1 to 5 stars and combines results from health inspections, staffing levels, and quality measures. Health inspections carry the most weight. Staffing and quality scores can increase or decrease the final rating based on performance compared to state and national standards.

Northern Manor

Nursing Home · New City, NY
CMS overall rating Info The Overall CMS Rating is scored from 1 to 5 stars and combines results from health inspections, staffing levels, and quality measures. Health inspections carry the most weight. Staffing and quality scores can increase or decrease the final rating based on performance compared to state and national standards.
Calculator: See prices in your area
Northern Manor accepts Medicare, Medicaid, and private pay.

Overview of Northern Manor

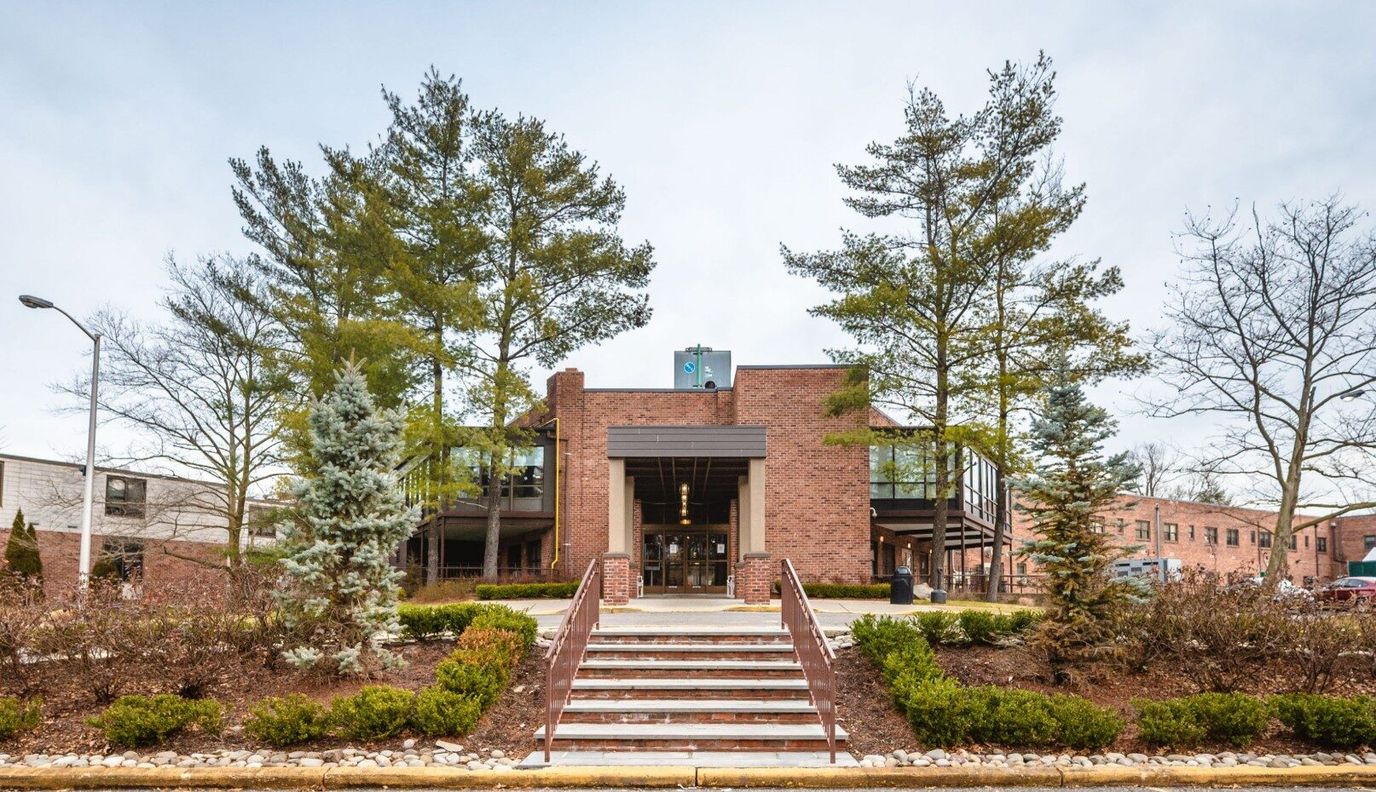
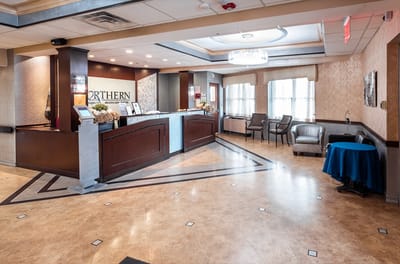
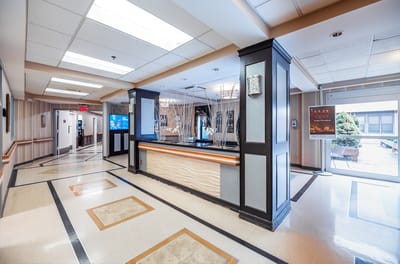
Northern Manor is a nursing home in Nanuet, NY, offering rehabilitation and skilled nursing. The community also ensures older adults are well-cared for in a compassionate and inclusive environment. With round-the-clock support, nutritious meals, transportation, and comprehensive medical care, residents receive the utmost attention and care to live comfortably. Through a multidisciplinary approach to care, the community strives to provide the best possible care for residents’ recovery and rehabilitation.

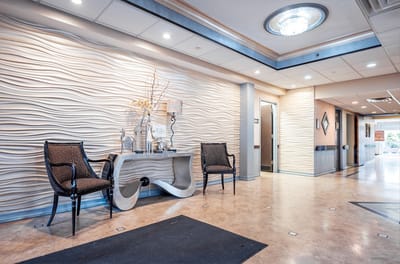
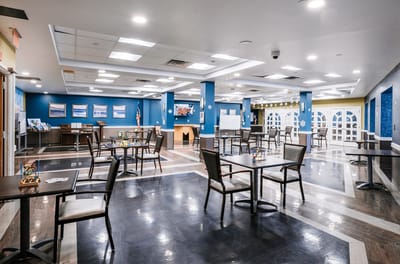
Light exercises, social events, and a variety of recreational opportunities encourage residents to live actively and make friends. State-of-the-art rehabilitation equipment and lively common areas also ensure residents’ relaxation and wellness. Residents also experience a stress-free retirement, as it is ideally situated in the tree-lined neighborhood of Nanuet. This nursing home has exceptional standards of care, making it a great choice for senior living in New York.

(845) 623-3904

Quality ratings

Measured by Centers for Medicare & Medicaid Services (CMS)

Overall rating Info The Overall CMS Rating combines results from health inspections, staffing levels and quality measures. Health inspections carry the most weight. Staffing and quality scores can increase or decrease the final rating based on performance compared to state and national standards.
▼ 67.5% Below NY avg. ▼ 67.5% Below NY avg.Click the badge to see the full State ranking.Click here to see the full State ranking.
Health Inspection Info Based on the results of the facility's three most recent standard inspections and any complaint investigations. CMS reviews the number, scope, and severity of deficiencies, with more recent findings weighted more heavily.
▼ 64.7% Below NY avg. ▼ 64.7% Below NY avg.Click the badge to see the full State ranking.Click here to see the full State ranking.
Staffing Info Measures average nursing staff hours per resident per day, including Registered Nurses (RNs) and total nursing staff. Ratings are adjusted based on the level of care residents require and are compared to state and national benchmarks.
▼ 63.2% Below NY avg. ▼ 63.2% Below NY avg.Click the badge to see the full State ranking.Click here to see the full State ranking.
Quality Measures Info Based on clinical and physical health indicators reported to CMS, such as hospital readmissions, falls, pressure ulcers, and improvements in mobility. These measures reflect how well residents' health needs are being managed.
▼ 21.4% Below NY avg. ▼ 21.4% Below NY avg.Click the badge to see the full State ranking.Click here to see the full State ranking.

Staffing hours breakdown

Info Daily nursing hours per resident by staff type, reported to CMS. Higher is generally better — compare this facility to state and national averages to see where staffing stands.

Hours per resident per day — compared to New York state averages

Total nursing care / resident Info This home is ranked 336th out of 388 homes in New York. Total adjusted nursing hours per resident per day, combining RN, LPN, and aide time. CMS adjusts this for case-mix so facilities can be fairly compared.
2h 43m per day
Rank #336 / 388Nurse hours — State benchmarkedThis home is ranked 336th out of 388 homes in New York. Shows adjusted nurse hours per resident per day benchmarked to the New York average, with a ranking across 388 New York SNFs. More hours mean more direct care. The national average is about 3.5 hrs; below 3.0 is a red flag.Click the rank badge to see the full State ranking.Click here to see the full State ranking.
This facility New York avg (3h 35m per day)
vs New York avg
-24%
Staff typeHours / Day / Residentvs state avg
Weekend Total Nursing Info Combined nursing hours (RN + LPN + Nurse Aide) per resident per day on weekends. Staffing often drops on weekends — this figure reveals whether the facility maintains adequate coverage outside of weekday hours. 3h 13m per day

Types of Care at Northern Manor

Nursing Home

Capacity and availability

This home usually has limited availability

Occupancy between 85% and 95% suggests balanced demand.

Higher occupancy than the New York average: 88.3%
Occupancy rate 94.4% Rank #147 / 433Occupancy rate — State benchmarkedThis home is ranked 147th out of 433 homes in New York. Shows this facility's occupancy rate versus the New York average, with its Statewide rank out of 433. Higher occupancy signals strong local demand and financial stability.Click the rank badge to see the full State ranking.Click here to see the full State ranking.
Avg. Length of Stay 140 days
Occupancy rate
94.4% Rank #147 / 433Occupancy rate — State benchmarkedThis home is ranked 147th out of 433 homes in New York. Shows this facility's occupancy rate versus the New York average, with its Statewide rank out of 433. Higher occupancy signals strong local demand and financial stability.Click the rank badge to see the full State ranking.Click here to see the full State ranking.
Avg. Length of Stay
140 days
Walk Score
Walk Score: 70 / 100 Rank #605 / 1167Walk Score — State benchmarkedThis home is ranked 605th out of 1167 homes in New York. Shows how walkable this facility's neighborhood is compared to the average Walk Score across New York SNFs. Higher scores benefit residents, families, and staff.Click the rank badge to see the full State ranking.Click here to see the full State ranking.
Very walkable. Most errands can be accomplished on foot, and many essentials are within a short walk.

Contact Northern Manor

Staffing Data

Reporting period: October 1 – December 31, 2025 (Q4 2025). Source: CMS Payroll-Based Journal report.

Total staff 212
Employees 187
Contractors 25
Staff to resident ratio 0.92:1
426% better than New York average
New York average ratio: 0.18:1 New York average ratio: 0.18:1See full New York ranking
Avg staff/day 118
Average shift 8.2 hours
6% better than New York average
New York average: 7.7 hours New York average shift: 7.7 hoursSee full New York ranking
Total staff hours (quarter) 89,326

Nursing staff breakdown

Q4 2025 · Oct 1 – Dec 31 More info This data comes from the CMS Payroll-Based Journal report covering October 1 – December 31, 2025.
Registered Nurse

Manages medical care and health needs.

RN Staff 27
Average shift length Info Average shift length. Calculated as total hours divided by days worked and average staff per day. 8.6 hours

No contractors work on this role.

Licensed Practical Nurse

Assists with medical care and medications.

LPN Staff 41
Average shift length Info Average shift length. Calculated as total hours divided by days worked and average staff per day. 8.6 hours

This role is partially covered by contractors.

Certified Nursing Assistant

Helps with daily care and mobility.

CNA Staff 84
Average shift length Info Average shift length. Calculated as total hours divided by days worked and average staff per day. 8.3 hours

No contractors work on this role.

Contractor staffing

Q4 2025 · Oct 1 – Dec 31 More info This data comes from the CMS Payroll-Based Journal report covering October 1 – December 31, 2025.

Total hours from contractors

6.1%

5,481 contractor hours this quarter

Qualified Activities Professional: 10 Other Dietary Services Staff: 5 Physical Therapy Assistant: 3 Respiratory Therapy Technician: 2 Speech Language Pathologist: 2 Licensed Practical Nurse: 1 Qualified Social Worker: 1 Physical Therapy Aide: 1

Staff by category

Q4 2025 · Oct 1 – Dec 31 More info This data comes from the CMS Payroll-Based Journal report covering October 1 – December 31, 2025.
Certified Nursing Assistant8408444,30492100%8.3
Licensed Practical Nurse4014119,62792100%8.6
Registered Nurse270279,83292100%8.6
Qualified Activities Professional610164,06792100%8.8
Respiratory Therapy Technician5272,76592100%8
Other Social Services Staff2021,1047177%8.7
Occupational Therapy Aide4049256874%7.4
Other Dietary Services Staff0558878795%7.1
Dental Services Staff3038566470%7.6
Physical Therapy Aide1127846672%7.9
Physical Therapy Assistant1347276874%7.3
Speech Language Pathologist1236918289%7.5
Clinical Nurse Specialist7076807986%5.4
Qualified Social Worker2135186672%6.2
Nurse Practitioner1014956672%7.5
Administrator1014645863%8
Mental Health Service Worker1014435964%7.5
Medical Director1011587986%2
84 Certified Nursing Assistant
% of Days 100%
41 Licensed Practical Nurse
% of Days 100%
27 Registered Nurse
% of Days 100%
16 Qualified Activities Professional
% of Days 100%
7 Respiratory Therapy Technician
% of Days 100%
2 Other Social Services Staff
% of Days 77%
4 Occupational Therapy Aide
% of Days 74%
5 Other Dietary Services Staff
% of Days 95%
3 Dental Services Staff
% of Days 70%
2 Physical Therapy Aide
% of Days 72%
4 Physical Therapy Assistant
% of Days 74%
3 Speech Language Pathologist
% of Days 89%
7 Clinical Nurse Specialist
% of Days 86%
3 Qualified Social Worker
% of Days 72%
1 Nurse Practitioner
% of Days 72%
1 Administrator
% of Days 63%
1 Mental Health Service Worker
% of Days 64%
1 Medical Director
% of Days 86%

Penalties and fines

Federal penalties imposed by CMS for regulatory violations, including civil money penalties (fines) and denials of payment for new Medicare/Medicaid admissions.

Source: CMS Penalties Database

No penalties in the past 3 years

No civil money penalties or payment denials were reported in the last 3 years.

Quality of care over time

These measures show how residents usually do over time at this home, based on health outcomes and preventive care.

High-risk clinical events score Info A composite score based on pressure ulcers, falls with injury, weight loss, walking ability decline, and activities of daily living decline. 6.6
32% better than New York average

New York average: 9.8

Functional decline score Info A composite score based on activities of daily living decline, walking ability decline, and incontinence. 16.5
9% better than New York average

New York average: 18.1

Long-stay resident measures
Need for Help with Daily Activities Increased Info Percent of long-stay residents whose need for help with daily activities has increased 12.3%
25% better than New York average

New York average: 16.4%

Walking Ability Worsened Info Percent of long-stay residents whose ability to move independently worsened 12.4%
25% better than New York average

New York average: 16.6%

Low Risk Residents with Bowel/Bladder Incontinence Info Percent of low risk long-stay residents who lose control of their bowels or bladder 24.8%
16% worse than New York average

New York average: 21.4%

Falls with Major Injury Info Percent of long-stay residents experiencing one or more falls with major injury 1.2%
59% better than New York average

New York average: 3.0%

High Risk Residents with Pressure Ulcers Info Percent of long-stay high risk residents with pressure ulcers 5.7%
20% better than New York average

New York average: 7.2%

Urinary Tract Infection Info Percent of long-stay residents with a urinary tract infection 0.5%
65% better than New York average

New York average: 1.4%

Lost Too Much Weight Info Percent of long-stay residents who lose too much weight 1.5%
75% better than New York average

New York average: 6.1%

Depressive Symptoms Info Percent of long-stay residents who have depressive symptoms 57.6%
218% worse than New York average

New York average: 18.1%

Antipsychotic Use Info Percent of long-stay residents who received an antipsychotic medication 14.3%
14% worse than New York average

New York average: 12.6%

Pneumococcal Vaccine Info Percent of long-stay residents assessed and appropriately given the pneumococcal vaccine 89.6%
In line with New York average

New York average: 91.4%

Influenza Vaccine Info Percent of long-stay residents assessed and appropriately given the seasonal influenza vaccine 96.9%
In line with New York average

New York average: 95.2%

Short-stay resident measures
Pneumococcal Vaccine Info Percent of short-stay residents assessed and appropriately given the pneumococcal vaccine 76.5%
In line with New York average

New York average: 76.6%

Antipsychotic medication increase Info Percent of short-stay residents who newly received an antipsychotic medication 0.4%
69% better than New York average

New York average: 1.3%

Influenza Vaccine Info Percent of short-stay residents assessed and appropriately given the seasonal influenza vaccine 79.1%
In line with New York average

New York average: 78.8%

Breakdown by payment type

Medicare

23% of new residents, usually for short-term rehab.

Typical stay 1 - 2 months

Private pay

52% of new residents, often for short stays.

Typical stay 2 - 3 months

Medicaid

25% of new residents, often for long-term daily care.

Typical stay 1 years

Facility Characteristics

Source: CMS Long-Term Care Facility Characteristics (Data as of Jan 2026)

Total residents 230
Medicare
21
9.1% of residents
Medicaid
159
69.1% of residents
Private pay or other
50
21.7% of residents
Programs & Services
Residents Group

Residents meet regularly to discuss policies, care quality, and activities

Active Resident Council

Organized group of residents that meets regularly to discuss facility policies, quality of life, and activities.

Finances and operations

Privately-owned community
Operated by a business corporation.
Home revenue
$38.8M
Profit
$1.4M
Privately-owned community Operated by a business corporation.
Home revenue
$38.8M Rank #127 / 383Revenue — State benchmarkedThis home is ranked 127th out of 383 homes in New York. Shows this facility's annual revenue compared to the New York SNF average. Higher revenue generally means more resources for staffing and capital — read alongside Payroll %.Click the rank badge to see the full State ranking.Click here to see the full State ranking.
Profit
$1.4M
Payroll costs Info The portion of the home's budget spent on staff, including nurses, caregivers, and other employees who support care and operations. Rank #98 / 383Payroll — State benchmarkedThis home is ranked 98th out of 383 homes in New York. Shows total annual staff payroll benchmarked to the New York average. Higher payroll investment relative to peers often signals better staffing and less reliance on cheaper contract labor.Click the rank badge to see the full State ranking.Click here to see the full State ranking.
$21.9M
56.4% of revenue Rank #96 / 383Payroll % — State benchmarkedThis home is ranked 96th out of 383 homes in New York. Shows payroll as a percentage of revenue versus the New York average. Well-run New York SNFs typically land around 53–65% — the top third Statewide. Below 25% may signal understaffing or heavy agency use — read with Staffing ratings.Click the rank badge to see the full State ranking.Click here to see the full State ranking.
Other operating costs Info All remaining costs needed to run the home, such as food, utilities, building maintenance, supplies and administrative expenses.
$15.5M
Total costs $37.4M

What does this home offer?

Housing options icon

Housing Options: Private / Semi-Private Rooms

Building type icon
Building type icon

Building Type: 2-story

Dining services icon

Dining Services

Beauty services icon

Beauty Services

Security systems icon

Security Systems

Rehabilitative support icon

Rehabilitative Support

On-site medical care and health services icon

On-site Medical Care and Health Services

Who this home usually serves

TYPE OF STAY

Mostly long-term care residents

Most residents stay for extended periods and receive ongoing daily care.

Places of interest near Northern Manor

Address 1.6 miles from city center Info Estimated distance in miles from Nanuet's city center to Northern Manor's address, calculated via Google Maps.

Calculate Travel Distance to Northern Manor

Add your location

Address

Financial Assistance for
Nursing Home in New York

Northern Manor is located in Nanuet, New York.
Here are the financial assistance programs available to residents in New York.

Get Financial aid guidance

Community First Choice Option

NY Medicaid CFCO

Age 65+ or disabled
General New York resident, Medicaid- eligible, care need (not necessarily nursing home level).
Income Limits (2025) ~$2,829/month 300% FBR, individual
Asset Limits $30,182 individual, higher due to NY Medicaid expansion
NY

Higher asset limit; urban density increases demand.

Benefits
Personal care (5-7 hours/day) Respite care (240 hours/year) Home modifications ($1,500 avg.) Assistive technology ($500 avg.)

Expanded In-Home Services for the Elderly Program (EISEP)

NY EISEP

Age 60+
General New York resident, at risk of decline but not nursing home level.
Income Limits ~$2,500/month individual, varies
Asset Limits $15,000 individual
NY

Cost-sharing required above certain income; urban/rural balance.

Benefits
In-home care (3-5 hours/week) Respite (up to 10 days/year) Case management Transportation (~5 trips/month)

Senior Citizen Rent Increase Exemption (SCRIE)

NY SCRIE

Age 62+
General NYC resident, live in rent-controlled/stabilized apartment, spend >1/3 of income on rent.
Income Limits (2025) $50,000/year household
Asset Limits No strict asset cap, but income-focused eligibility.
NY

Limited to NYC’s rent-regulated units; high demand in urban areas.

Benefits
Rent freeze (e.g., covers increases of $50-$200+/month); tax credit for landlord

Senior Citizen Homeowners’ Exemption (SCHE)

NY SCHE

Age 65+
General NYC resident, own and live in a 1-3 family home, co-op, or condo.
Income Limits (2025) $58,399/year household
Asset Limits No strict asset cap, income-driven eligibility.
NY

Applies only in NYC; excludes large apartment buildings.

Benefits
Property tax reduction (5-50%, e.g., $500-$5,000/year based on income and property value)

New York Foundation for Senior Citizens (NYFSC) Home Sharing Program

NYFSC Home Sharing

Age One participant must be 60+ (host or guest)
General NYC resident, able to share living space.
Income Limits No strict limit, but targets those needing cost relief.
Asset Limits Not applicable; focus on housing need.
NY

Primarily NYC-focused; limited slots due to demand.

Benefits
Shared housing (reduces rent/living costs by 30-50%, e.g., $500-$1,000/month savings); optional light assistance between housemates

Compare Nursing Home around New City

The information below is reported by the New York State Department of Health.

2 facilities compared · CMS & NY Dept. of Health data

Filter by care type
Friedwald Center for Rehabilitation & Nursing
NH

Nursing Home Licensed facility providing 24/7 skilled nursing care for residents with complex, ongoing medical needs. Staffed by RNs, LPNs, and CNAs. Inspected and star-rated annually by CMS. Accepts Medicare (short-term rehab) and Medicaid (long-term care).

New City (Diablo Road)180 92.8% +5%3.90 +41%+9%$0196.3-158 71 Barry Winet$36.3M$20.0M55.1%335734
Northern Manor
NH

Nursing Home Licensed facility providing 24/7 skilled nursing care for residents with complex, ongoing medical needs. Staffed by RNs, LPNs, and CNAs. Inspected and star-rated annually by CMS. Accepts Medicare (short-term rehab) and Medicaid (long-term care).

Nanuet231 94.4% +7%2.72 +1%-24%$0385.4-224 70 Morris Klein$38.8M$21.9M56.4%335046

Frequently Asked Questions about Northern Manor

Is Northern Manor in a walkable area?

Northern Manor has a walk score of 70. Very walkable. Most errands can be accomplished on foot, and many essentials are within a short walk.

What is the occupancy rate at Northern Manor?

Northern Manor's occupancy is 94.4%.

What is the address of Northern Manor?

Northern Manor is located at 199 N Middletown Rd, Nanuet, NY 10954.

What is the phone number of Northern Manor?

(845) 623-3904 will put you in contact with the team at Northern Manor.

Is Northern Manor Medicare or Medicaid certified?

Yes — Northern Manor is a CMS-certified provider of Medicare and Medicaid.

Guides for Better Senior Living

Care Cost Calculator: See Prices in Your Area

Nursing Home Data Explorer

Don’t Wait Too Long: 7 Red Flag Signs Your Parent Needs Assisted Living Now

The True Cost of Assisted Living in 2025 – And How Families Are Paying For It

Understanding Senior Living Costs: Pricing Models, Discounts & Financial Assistance

Explore Open Rooms
1 Contact details
2 What type of senior care service are you looking for?
3 What budget do you have in mind for senior care?
4 How soon do you need to find care?
5 Additional details

Thank you for your interest!

Our team will be in touch shortly to help with next steps.