Oak Grove Center
Nursing Home, Hospice Care, Memory Care & Respite Care · Waterville, ME
CMS overall rating Info CMS (the Centers for Medicare & Medicaid Services) is the federal agency that rates nursing home quality. Its Overall Rating runs from 1 to 5 stars, combining health inspections, staffing, and quality measures, with inspections weighted most heavily.

Oak Grove Center

Nursing Home, Hospice Care, Memory Care & Respite Care · Waterville, ME
CMS overall rating Info CMS (the Centers for Medicare & Medicaid Services) is the federal agency that rates nursing home quality. Its Overall Rating runs from 1 to 5 stars, combining health inspections, staffing, and quality measures, with inspections weighted most heavily.
Calculator: See prices in your area
Oak Grove Center accepts Medicare, Medicaid, and private pay.

Overview of Oak Grove Center

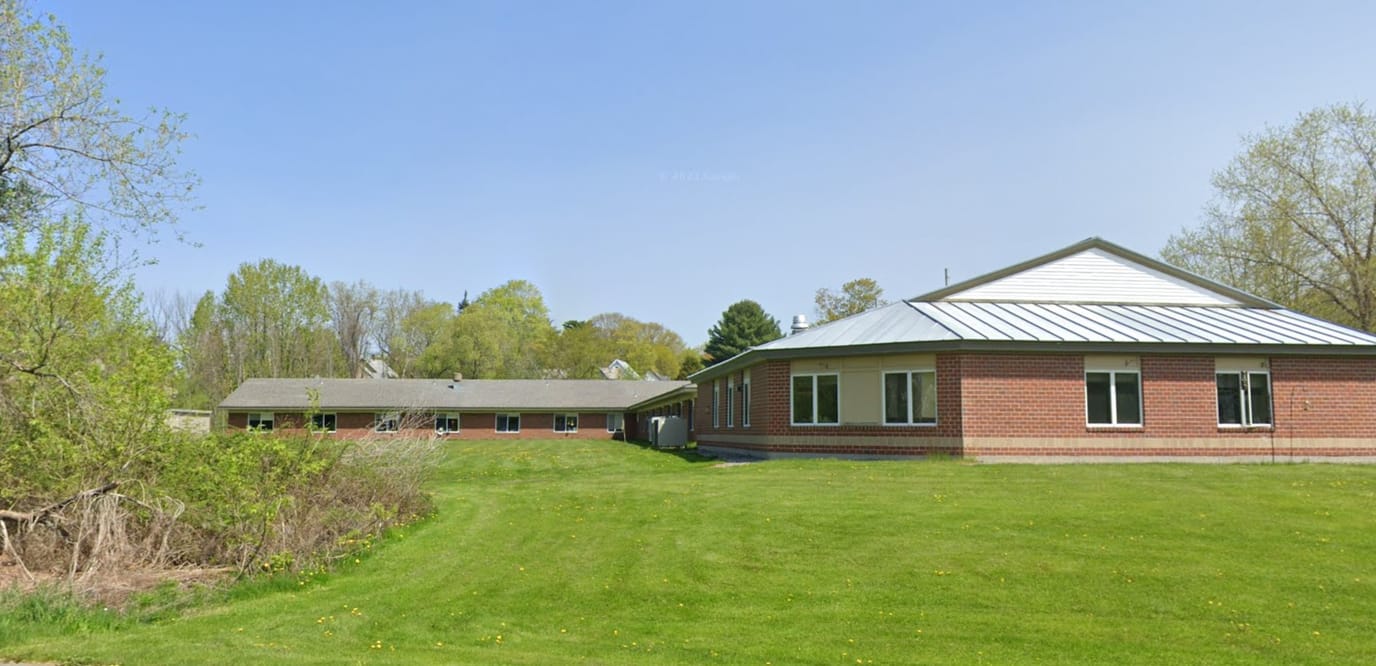
Oak Grove Center in Waterville, Maine offers a range of services from post-hospital short-term rehabilitation to long-term and respite care. The center warmly accepts Medicare, Medicaid, and various private insurance options. This VA contracted facility also received an AHCA Silver Quality Award recognition.

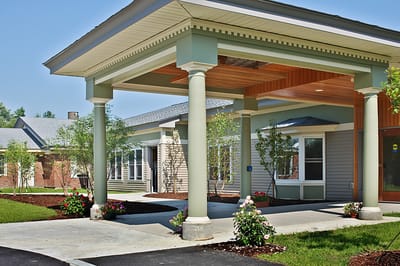
The center’s holistic approach encompasses pain management, case management, and discharge planning, while personalized treatment plans, medication management, and specialized care such as podiatry, wound care, and dementia care contribute to a comprehensive wellness strategy. Beyond their exceptional medical services, Oak Grove Center offers a range of amenities, from an inviting beauty salon and barber services to lush gardens and courtyards that provide serene outdoor spaces for seniors to enjoy.

Quality ratings

Measured by Centers for Medicare & Medicaid Services (CMS)

Overall rating Info The Overall CMS Rating combines results from health inspections, staffing levels and quality measures. Health inspections carry the most weight. Staffing and quality scores can increase or decrease the final rating based on performance compared to state and national standards.
▼ 67.1% Below ME avg. ▼ 67.1% Below ME avg.ME average: 3.0Click the badge to see the full State ranking.Click here to see the full State ranking.
Health Inspection Info Based on the results of the facility's three most recent standard inspections and any complaint investigations. CMS reviews the number, scope, and severity of deficiencies, with more recent findings weighted more heavily.
▼ 64.8% Below ME avg. ▼ 64.8% Below ME avg.ME average: 2.8Click the badge to see the full State ranking.Click here to see the full State ranking.
Staffing Info Measures average nursing staff hours per resident per day, including Registered Nurses (RNs) and total nursing staff. Ratings are adjusted based on the level of care residents require and are compared to state and national benchmarks.
▼ 49.5% Below ME avg. ▼ 49.5% Below ME avg.ME average: 4.0Click the badge to see the full State ranking.Click here to see the full State ranking.
Quality Measures Info Based on clinical and physical health indicators reported to CMS, such as hospital readmissions, falls, pressure ulcers, and improvements in mobility. These measures reflect how well residents' health needs are being managed.
▲ 10.0% Above ME avg. ▲ 10.0% Above ME avg.ME average: 2.7Click the badge to see the full State ranking.Click here to see the full State ranking.

Staffing hours breakdown

Info Daily nursing hours per resident by staff type, reported to CMS. Higher is generally better — compare this facility to state and national averages to see where staffing stands.

Hours per resident per day — compared to Maine state averages

Total nursing care / resident Info This home is ranked 33rd out of 34 homes in Maine for nurse hours. Total adjusted nursing hours per resident per day, combining RN, LPN, and aide time. CMS adjusts this for case-mix so facilities can be fairly compared.
3h 5m per day
Rank #33 / 34Nurse hours — State benchmarkedThis home is ranked 33rd out of 34 homes in Maine. Shows adjusted nurse hours per resident per day benchmarked to the Maine average, with a ranking across 34 Maine facilities. More hours mean more direct care. The national average is about 3.5 hrs; below 3.0 is a red flag.Rankings are based only on facilities in Maine that report data for that category. Facilities without available data are excluded from the ranking.Click the rank badge to see the full State ranking.Click here to see the full State ranking.
This facility Maine avg (4h 30m per day)
vs Maine avg
-31%

5 of 6 metrics below state avg

Standout metric LPN / LVN is +59% above state avg
Staff typeHours / Day / Residentvs state avg
Registered Nurse (RN) Info RNs hold the highest nursing license and can assess residents, interpret test results, and direct care plans. More RN hours per day often signals stronger clinical oversight and faster response to health changes. 52m per day ▼ 15% State avg: 1h 2m per day · National avg: 41m per day
LPN / LVN Info Licensed Practical Nurses (LPNs) or Licensed Vocational Nurses (LVNs) deliver routine hands-on care — medication administration, wound dressing, and monitoring vital signs. They work under RN supervision and make up a large share of daily bedside care. 43m per day ▲ 59% State avg: 27m per day · National avg: 52m per day
Nurse Aide Info Certified Nurse Aides (CNAs) provide the most direct day-to-day assistance: bathing, dressing, feeding, and mobility. Nurse aide hours are typically the largest staffing category and directly affect residents' quality of life. 1h 56m per day ▼ 32% State avg: 2h 52m per day · National avg: 2h 20m per day
Weekend Total Nursing Info Combined nursing hours (RN + LPN + Nurse Aide) per resident per day on weekends. Staffing often drops on weekends — this figure reveals whether the facility maintains adequate coverage outside of weekday hours. 3h 20m per day ▼ 15% State avg: 3h 55m per day · National avg: 3h 26m per day
Physical Therapist Info Hours per resident per day provided by licensed Physical Therapists (PTs) or PT Assistants. PT services help residents recover mobility after injury or illness and are especially important for post-acute (short-stay) rehabilitation. 3m per day ▼ 14% State avg: 4m per day · National avg: 4m per day
Weekend RN Info Registered nurse hours specifically on weekends. Facilities sometimes reduce RN presence on Saturdays and Sundays — a low weekend RN figure compared to weekday hours can indicate reduced clinical oversight when most administrative staff are absent. 42m per day ▼ 5% State avg: 44m per day · National avg: 28m per day

Capacity and availability

This home usually has availability

Lower occupancy than the Maine average: 83.1%
Occupancy rate
58.8% Rank #227 / 251Occupancy rate — State benchmarkedThis home is ranked 227th out of 251 homes in Maine. Shows this facility's occupancy rate versus the Maine average, with its Statewide rank out of 251. Higher occupancy signals strong local demand and financial stability.Rankings are based only on facilities in Maine that report data for that category. Facilities without available data are excluded from the ranking.Click the rank badge to see the full State ranking.Click here to see the full State ranking.
Avg. Length of Stay
78 days
Bed community size
90-bed community Rank #15 / 357Bed count — State benchmarkedThis home is ranked 15th out of 357 homes in Maine. Shows this facility's certified or reported bed count compared to other Maine facilities. Larger communities may offer more amenities, programs, and on-site services for residents and families.Rankings are based only on facilities in Maine that report data for that category. Facilities without available data are excluded from the ranking.Click the rank badge to see the full State ranking.Click here to see the full State ranking.
A larger shared setting that may offer more common spaces and organized community services.
Walk Score
Walk Score: 41 / 100 Rank #146 / 422Walk Score — State benchmarkedThis home is ranked 146th out of 422 homes in Maine. Shows how walkable this facility's neighborhood is compared to the average Walk Score across Maine facilities. Higher scores benefit residents, families, and staff.Rankings are based only on facilities in Maine that report data for that category. Facilities without available data are excluded from the ranking.Click the rank badge to see the full State ranking.Click here to see the full State ranking.
Somewhat walkable. A few nearby services may be reachable on foot, but most trips require transportation.

Amenities & Lifestyle

Specific ProgramsAutism Program, Arts Program, ILP Thrive, Wraparound Program, Sports Program, Specialty Programs, Special Education Nonpublic School, Residential Treatment (Ages 8-18), Day Programs (Ages 5-22), Intensive Outpatient Program, Partial Hospitalization, Oak Grove at the Ranch

Contact Oak Grove Center

Staffing Data

Reporting period: October 1 – December 31, 2025 (Q4 2025). Source: CMS Payroll-Based Journal report.

Total staff 190
Employees 118
Contractors 72
Staff to resident ratio 2.41 : 1
19% more staff per resident than Maine average
Maine average ratio: 2.03 : 1 Maine average ratio: 2.03 : 1See full Maine ranking
Avg staff/day 45
Average shift 8 hours
0% compared with Maine average
Maine average: 8.1 hours Maine average shift: 8.1 hoursSee full Maine ranking
Total staff hours (quarter) 33,143

Nursing staff breakdown

Q4 2025 · Oct 1 – Dec 31 More info This data comes from the CMS Payroll-Based Journal report covering October 1 – December 31, 2025.
Registered Nurse

Manages medical care and health needs.

RN Staff Info 26 total: 17 full-time employees and 9 contractors. 26
Average shift length Info Average shift length. Calculated as total hours divided by days worked and average staff per day. 10.1 hours
Licensed Practical Nurse

Assists with medical care and medications.

LPN Staff Info 18 total: 6 full-time employees and 12 contractors. 18
Average shift length Info Average shift length. Calculated as total hours divided by days worked and average staff per day. 10.2 hours
Certified Nursing Assistant

Helps with daily care and mobility.

CNA Staff Info 94 total: 48 full-time employees and 46 contractors. 94
Average shift length Info Average shift length. Calculated as total hours divided by days worked and average staff per day. 7.7 hours

Contractor staffing

Q4 2025 · Oct 1 – Dec 31 More info This data comes from the CMS Payroll-Based Journal report covering October 1 – December 31, 2025.

Total hours from contractors

18.8%

6,236 contractor hours this quarter

Certified Nursing Assistant: 46 Licensed Practical Nurse: 12 Registered Nurse: 9 Occupational Therapy Assistant: 2 Qualified Social Worker: 1 Occupational Therapy Aide: 1 Medical Director: 1

Staff by category

Q4 2025 · Oct 1 – Dec 31 More info This data comes from the CMS Payroll-Based Journal report covering October 1 – December 31, 2025.
Certified Nursing Assistant48469413,13392100%7.7
Registered Nurse179265,43192100%10.1
Licensed Practical Nurse612185,03592100%10.2
Medication Aide/Technician110111,78792100%7.1
Physical Therapy Aide4049127278%7.1
Mental Health Service Worker2028876874%7.6
Clinical Nurse Specialist2028777683%7.3
Speech Language Pathologist4048707683%6.5
Other Dietary Services Staff3037478087%6.7
RN Director of Nursing1015176975%7.5
Other Social Services Staff1015096470%8
Nurse Practitioner2024926267%7.9
Physical Therapy Assistant4044847076%6.5
Administrator1014555762%8
Respiratory Therapy Technician5054446267%6.2
Occupational Therapy Aide0112102628%8.1
Nurse Aide in Training2021772325%7.7
Qualified Social Worker516833235%2.2
Occupational Therapy Assistant022643033%2.1
Medical Director011301112%2.7
94 Certified Nursing Assistant
% of Days 100%
26 Registered Nurse
% of Days 100%
18 Licensed Practical Nurse
% of Days 100%
11 Medication Aide/Technician
% of Days 100%
4 Physical Therapy Aide
% of Days 78%
2 Mental Health Service Worker
% of Days 74%
2 Clinical Nurse Specialist
% of Days 83%
4 Speech Language Pathologist
% of Days 83%
3 Other Dietary Services Staff
% of Days 87%
1 RN Director of Nursing
% of Days 75%
1 Other Social Services Staff
% of Days 70%
2 Nurse Practitioner
% of Days 67%
4 Physical Therapy Assistant
% of Days 76%
1 Administrator
% of Days 62%
5 Respiratory Therapy Technician
% of Days 67%
1 Occupational Therapy Aide
% of Days 28%
2 Nurse Aide in Training
% of Days 25%
6 Qualified Social Worker
% of Days 35%
2 Occupational Therapy Assistant
% of Days 33%
1 Medical Director
% of Days 12%

Penalties and fines

Includes penalties issued in 2024

Federal penalties imposed by CMS for regulatory violations, including civil money penalties (fines) and denials of payment for new Medicare/Medicaid admissions.

Source: CMS Penalties Database (Data as of Jan 2026)

Total fines amount $14K Rank #29 / 34Federal fines — State benchmarkedThis home is ranked 29th out of 34 homes in Maine. Shows this facility's cumulative CMS federal fine dollars versus the Maine average among facilities with fines, and where it ranks among 34 facilities in the pool. Lower total dollars mean a better rank.Rankings are based only on facilities in Maine that report data for that category. Facilities without available data are excluded from the ranking.Click the rank badge to see the full State ranking.Click here to see the full State ranking.
42% lower than Maine average

Maine average: $24K

Number of fines 1
18% fewer fines than Maine average

Maine average: 1.2

Payment Denials Info Serious action where Medicare and/or Medicaid temporarily stops payments for new residents until issues are fixed. 2
967% more payment denials than Maine average

Maine average: 0.2

Fines amount comparison
This facility $14K
Maine average $24K
Penalty History

Penalties are imposed by CMS for violations of federal nursing home regulations.

3 penalties in the past 3 years

Multiple penalties were reported in the last 3 years.

Civil Money Penalty Info Fines imposed for noncompliance, which can be assessed per day or per instance of violation. May 29, 2024
$14K
Payment Denial Info Serious action where Medicare and/or Medicaid temporarily stops payments for new residents until issues are fixed. May 29, 2024
29 days
Payment Denial Info Serious action where Medicare and/or Medicaid temporarily stops payments for new residents until issues are fixed. Mar 27, 2024
6 days

Last updated: Jan 2026

Quality of care over time

These measures show how residents usually do over time at this home, based on health outcomes and preventive care.

High-risk clinical events score Info A composite score based on pressure ulcers, falls with injury, weight loss, walking ability decline, and activities of daily living decline. 19.6
38% worse than Maine average

Maine average: 14.2

Functional decline score Info A composite score based on activities of daily living decline, walking ability decline, and incontinence. 38.2
31% worse than Maine average

Maine average: 29.1

Long-stay resident measures
Significantly below average Maine avg: 2.6 Info CMS star rating based on long-stay quality measure performance. 5 stars = significantly above average, 1 star = significantly below average.
Need for Help with Daily Activities Increased Info Percent of long-stay residents whose need for help with daily activities has increased 29.2%
13% worse than Maine average

Maine average: 26.0%

Walking Ability Worsened Info Percent of long-stay residents whose ability to move independently worsened 42.2%
35% worse than Maine average

Maine average: 31.4%

Low Risk Residents with Bowel/Bladder Incontinence Info Percent of low risk long-stay residents who lose control of their bowels or bladder 43.1%
44% worse than Maine average

Maine average: 29.8%

Falls with Major Injury Info Percent of long-stay residents experiencing one or more falls with major injury 5.5%
25% worse than Maine average

Maine average: 4.4%

High Risk Residents with Pressure Ulcers Info Percent of long-stay high risk residents with pressure ulcers 7.9%
76% worse than Maine average

Maine average: 4.5%

Urinary Tract Infection Info Percent of long-stay residents with a urinary tract infection 4.5%
61% worse than Maine average

Maine average: 2.8%

Lost Too Much Weight Info Percent of long-stay residents who lose too much weight 13.1%
139% worse than Maine average

Maine average: 5.5%

Depressive Symptoms Info Percent of long-stay residents who have depressive symptoms 25.3%
141% worse than Maine average

Maine average: 10.5%

Antipsychotic Use Info Percent of long-stay residents who received an antipsychotic medication 21.2%
7% worse than Maine average

Maine average: 19.8%

Pneumococcal Vaccine Info Percent of long-stay residents assessed and appropriately given the pneumococcal vaccine 95.3%
6% better than Maine average

Maine average: 90.1%

Influenza Vaccine Info Percent of long-stay residents assessed and appropriately given the seasonal influenza vaccine 98.6%
In line with Maine average

Maine average: 95.5%

Hospitalizations per 1,000 days Info Number of hospitalizations per 1,000 long-stay resident days. 1.20
14% better than Maine average

Maine average: 1.39

ED visits per 1,000 days Info Number of outpatient emergency department visits per 1,000 long-stay resident days. 2.15
In line with Maine average

Maine average: 2.08

Short-stay resident measures
Average Maine avg: 3.3 Info CMS star rating based on short-stay quality measure performance. 5 stars = much above average, 1 star = much below average.
Pneumococcal Vaccine Info Percent of short-stay residents assessed and appropriately given the pneumococcal vaccine 86.9%
23% better than Maine average

Maine average: 70.8%

Antipsychotic medication increase Info Percent of short-stay residents who newly received an antipsychotic medication 1.6%
10% worse than Maine average

Maine average: 1.4%

Influenza Vaccine Info Percent of short-stay residents assessed and appropriately given the seasonal influenza vaccine 93.4%
25% better than Maine average

Maine average: 74.5%

Re-hospitalized after SNF stay Info Percentage of short-stay residents who were re-hospitalized after their nursing home admission. 14.4%
30% better than Maine average

Maine average: 20.5%

Emergency department visits Info Percentage of short-stay residents who had an outpatient emergency department visit. 23.4%
50% worse than Maine average

Maine average: 15.6%

Falls with major injury Info Percentage of SNF residents who experience falls with major injury during their stay. 2.8%
268% worse than Maine average

Maine average: 0.8%

Ability to care for self at discharge Info Percentage of residents at or above expected ability to care for themselves at discharge. 49.3%
8% worse than Maine average

Maine average: 53.7%

Successful return to home or community Info Rate of successful return to home or community from a skilled nursing facility. 55.0%
9% better than Maine average

Maine average: 50.6%

Breakdown by payment type

Medicare

35% of new residents, usually for short-term rehab.

Typical stay 30 days

Private pay

60% of new residents, often for short stays.

Typical stay 27 days

Medicaid

5% of new residents, often for long-term daily care.

Typical stay 3 years

Facility Characteristics

Source: CMS Long-Term Care Facility Characteristics (Data as of Jan 2026)

Total residents 79
Medicare
11
13.9% of residents
Medicaid
46
58.2% of residents
Private pay or other
22
27.8% of residents
Programs & Services
Residents Group

Residents meet regularly to discuss policies, care quality, and activities

Active Resident Council

Organized group of residents that meets regularly to discuss facility policies, quality of life, and activities.

Finances and operations

Based on CMS SNF Cost Report for fiscal year ending in 09/2023.

For-profit
Corporation
Net patient revenue Info Net patient revenue — what the home actually collects for resident care, after contractual allowances, bad debt and discounts are subtracted from its gross charges (CMS cost report, Worksheet G-3). It covers resident care only; money the home earns from other sources is shown separately as "Other income."
$10.8M
Net patient income Info Net patient income: net patient revenue minus the home's total operating expenses. A positive figure means it earns more from resident care than it spends to deliver it; a negative figure means the opposite. It excludes non-operating "other income."
-$805.3K
For-profit Corporation
Net patient revenue Info Net patient revenue — what the home actually collects for resident care, after contractual allowances, bad debt and discounts are subtracted from its gross charges (CMS cost report, Worksheet G-3). It covers resident care only; money the home earns from other sources is shown separately as "Other income."
$10.8M Rank #14 / 40Revenue — State benchmarkedThis home is ranked 14th out of 40 homes in Maine. Shows this facility's annual revenue compared to the Maine average. Higher revenue generally means more resources for staffing and capital — read alongside Payroll %.Rankings are based only on facilities in Maine that report data for that category. Facilities without available data are excluded from the ranking.Click the rank badge to see the full State ranking.Click here to see the full State ranking.
Net patient income Info Net patient income: net patient revenue minus the home's total operating expenses. A positive figure means it earns more from resident care than it spends to deliver it; a negative figure means the opposite. It excludes non-operating "other income."
-$805.3K
Other income Info Money the home earns outside of resident care — such as investments, grants, rentals and other non-operating sources (CMS cost report, Worksheet G-3). It is tracked separately from net patient revenue: it is not part of that figure, and it is not included in net patient income.
$1.0M
Payroll costs Info Staff salaries plus wage-related costs — benefits such as payroll taxes, health insurance and retirement — from the home's own accounting records (CMS cost report, Worksheet A). Contract or agency labor is counted separately, under other operating costs. Rank #21 / 40Payroll — State benchmarkedThis home is ranked 21st out of 40 homes in Maine. Shows total annual staff payroll benchmarked to the Maine average. Higher payroll investment relative to peers often signals better staffing and less reliance on cheaper contract labor.Rankings are based only on facilities in Maine that report data for that category. Facilities without available data are excluded from the ranking.Click the rank badge to see the full State ranking.Click here to see the full State ranking.
$5.0M 46% of net patient revenue Info Payroll as a share of revenue: staff salaries and wage-related benefits divided by net patient revenue. A higher figure means more of each revenue dollar goes to staff pay. Rank #32 / 40Payroll % — State benchmarkedThis home is ranked 32nd out of 40 homes in Maine. Shows payroll as a percentage of revenue versus the Maine average. Well-run Maine facilities typically land around 60–66% — the top third Statewide. Below 25% may signal understaffing or heavy agency use — read with Staffing ratings.Rankings are based only on facilities in Maine that report data for that category. Facilities without available data are excluded from the ranking.Click the rank badge to see the full State ranking.Click here to see the full State ranking.
Other operating costs Info Everything it costs to run the home apart from payroll — food, utilities, supplies, maintenance, contract labor and administration. Calculated as total operating expense minus payroll (staff salaries and wage-related benefits).
$6.6M
Total costs Info The home's total operating expense for the year — all the costs of running it, salaries included (CMS cost report, Worksheet G-3).
$11.6M

What does this home offer?

Housing options icon

Housing Options: Private Rooms / Semi-Private Rooms

Building type icon
Building type icon

Building Type: Single-story

Transportation services icon

Transportation Services

Fitness and recreation icon

Fitness and Recreation

Who this home usually serves

TYPE OF STAY

Primarily short stays

Residents typically stay for brief periods, with frequent admissions and discharges throughout the year.

Most new residents arrive under private pay (60% of admissions), and a typical private pay stay runs around 27 days.

Admissions
284 total

Coverage residents most often arrive under.

Medicare 35%
Private pay 60%
Medicaid 5%
Discharges
290 total

Coverage residents most often leave under.

Medicare 24%
Private pay 50%
Medicaid 26%

Places of interest near Oak Grove Center

Address 20.1 miles from city center Info Estimated distance in miles from Waterville's city center to Oak Grove Center's address, calculated via Google Maps.

Calculate Travel Distance to Oak Grove Center

Add your location

Address

Compare Nursing Homes around Augusta

The information below is reported by the Maine Department of Health and Human Services, Division of Licensing and Certification.

4 facilities compared · CMS & ME Dept. of Health data

Maine Veterans‘ Homes Augusta
NH
AL
MC
RC
Augusta
108
Facility 108
ME AVG 20
Rank #10 / 357
93.1%
Facility 93.1%
ME AVG 83.1%
Rank #134 / 251
+12%
7.43
Facility 7.43
ME AVG 4.50
Rank #1 / 34
+2%+65%
$0
Facility $0
ME AVG $26.4k
Rank #1 / 34
6
Facility 6
ME AVG 28.5
Rank #1 / 34
3.0
Facility 3.0
ME AVG 5.9
Rank #1 / 34
-102-
7
Facility 7
ME AVG 31
Rank #316 / 422
Maine Veterans' Home
$86.7M
Facility $86.7M
ME AVG $16.9M
Rank #1 / 40
$16.6M
Facility $16.6M
ME AVG $4.7M
Rank #1 / 40
19.2%
Facility 19.2%
ME AVG 37.8%
Rank #39 / 40
205126
MaineGeneral Rehabilitation & Long Term Care – Gray Birch
NH
AL
Augusta (Gray Birch Drive)
77
Facility 77
ME AVG 20
Rank #27 / 357
88.4%
Facility 88.4%
ME AVG 83.1%
Rank #157 / 251
+6%
5.57
Facility 5.57
ME AVG 4.50
Rank #3 / 34
+34%+24%
$9.8k
Facility $9.8k
ME AVG $26.4k
Rank #22 / 34
21
Facility 21
ME AVG 28.5
Rank #7 / 34
7.0
Facility 7.0
ME AVG 5.9
Rank #24 / 34
166-
28
Facility 28
ME AVG 31
Rank #195 / 422
Mainegeneral Health
$10.6M
Facility $10.6M
ME AVG $16.9M
Rank #19 / 40
$8.8M
Facility $8.8M
ME AVG $4.7M
Rank #15 / 40
83.1%
Facility 83.1%
ME AVG 37.8%
Rank #5 / 40
205054
Augusta Center for Health & Rehabilitation
NH
HC
NC
PC
RC
Augusta (Mayfair)
72
Facility 72
ME AVG 20
Rank #33 / 357
95.1%
Facility 95.1%
ME AVG 83.1%
Rank #125 / 251
+14%
3.64
Facility 3.64
ME AVG 4.50
Rank #25 / 34
+9%-19%
$10.1k
Facility $10.1k
ME AVG $26.4k
Rank #24 / 34
26
Facility 26
ME AVG 28.5
Rank #11 / 34
4.3
Facility 4.3
ME AVG 5.9
Rank #8 / 34
167-
23
Facility 23
ME AVG 31
Rank #208 / 422
Ryan Francis
$9.4M
Facility $9.4M
ME AVG $16.9M
Rank #30 / 40
$4.7M
Facility $4.7M
ME AVG $4.7M
Rank #26 / 40
49.8%
Facility 49.8%
ME AVG 37.8%
Rank #12 / 40
205077
Oak Grove Center
NH
HC
MC
RC
Waterville (Cool Street)
90
Facility 90
ME AVG 20
Rank #15 / 357
58.8%
Facility 58.8%
ME AVG 83.1%
Rank #227 / 251
-29%
3.09
Facility 3.09
ME AVG 4.50
Rank #33 / 34
-8%-31%
$14.1k
Facility $14.1k
ME AVG $26.4k
Rank #29 / 34
63
Facility 63
ME AVG 28.5
Rank #34 / 34
9.0
Facility 9.0
ME AVG 5.9
Rank #28 / 34
185-
41
Facility 41
ME AVG 31
Rank #146 / 422
Laura Matones
$10.8M
Facility $10.8M
ME AVG $16.9M
Rank #14 / 40
$5.0M
Facility $5.0M
ME AVG $4.7M
Rank #21 / 40
46%
Facility 46%
ME AVG 37.8%
Rank #32 / 40
205091

Financial Assistance for
Nursing Home in Maine

Oak Grove Center is located in Waterville, Maine.
Here are the financial assistance programs available to residents in Maine.

Get Financial aid guidance

Home and Community Benefits for the Elderly

MaineCare HCB Program

Age 65+ or 18+ with disability
General Maine resident, Medicaid- eligible, nursing home-level care need.
Income Limits (2025) ~$2,829/month 300% FBR, individual
Asset Limits $2,000 (individual), $3,000 (couple).
ME

Rural access emphasized.

Benefits
Personal care (5-7 hours/day) Respite (240 hours/year) Meals ($6/meal) Adult day services ($60/day)

Maine Statewide Respite Program

ME Respite Program

Age
General Caregiver of someone 60+ with dementia, Maine resident.
Income Limits ~$2,500/month individual, varies
Asset Limits $40,000 individual
ME

Limited to dementia caregivers; capped funding.

Benefits
In-home respite (up to 30 days/year) Adult day care (~$60/day)

MaineCare Long-Term Care (Nursing Facility Services)

MaineCare Nursing Facility Services

Age 65+
General Maine resident, Medicaid-eligible, requires nursing home-level care.
Income Limits (2025) $943/month (individual); must be less than nursing home cost for full coverage.
Asset Limits $2,000 (individual), $3,000 (couple); spousal allowance up to $155,356.
ME

Home equity limit of $636,000; estate recovery applies post-55.

Benefits
24/7 nursing care Meals Therapy Medications (hours unlimited per medical need)

Consumer-Directed Home-Based Care (CDHBC)

Maine Consumer-Directed Personal Assistance Services

Age 65+
General Maine resident, needs ADL assistance, income/asset limits apply.
Income Limits (2025) ~$2,000/month varies by AAA
Asset Limits Not strict; prioritizes low-income.
ME

Available through five Area Agencies on Aging.

Benefits
Personal care (20-30 hours/week) PERS Adult day care Home modifications

Home Accessibility and Repair Program

Maine State Housing Authority Home Accessibility and Repair

Age 62+
General Maine resident, homeowner, low-income.
Income Limits (2025) ~$34,000/year individual, 80% AMI, varies by county
Asset Limits Not specified; focus on income.
ME

Includes Elderly Hardship Grants for urgent repairs.

Benefits
Wheelchair ramps Grab bars Roof repairs (up to $20,000/project)

Program of All-Inclusive Care for the Elderly (PACE)

Maine PACE (not widely available yet)

Age 55+
General Maine resident, Medicare/Medicaid-eligible, nursing home-level care need, community-safe.
Income Limits (2025) No strict limit; Medicaid portion $2,901/month max.
Asset Limits $2,000 (individual) for Medicaid portion.
ME

Pilot phase; check availability with DHHS.

Benefits
Medical care Personal care Day center Transportation Respite (tailored to need)

Veterans Aid and Attendance (A&A) Benefit

Maine VA Aid and Attendance

Age
General Wartime veteran/spouse, age 65+ or disabled, needs ADL help, Maine resident.
Income Limits (2025) Net income minus medical expenses < $1,984/month individual with A&A
Asset Limits $155,356 net worth limit
ME

High veteran population in rural areas.

Benefits
Cash benefit ($1,478-$2,471/month, varies by status) for care costs

Medicare Savings Programs (MSP)

Maine Medicare Savings Programs

Age 65+
General Maine resident, Medicare Part A/B enrollee.
Income Limits (2025) $2,014/month (individual, QMB), $2,706/month (SLMB/QI).
Asset Limits $9,090 (individual), $13,630 (couple).
ME

Includes Qualified Medicare Beneficiary (QMB), Specified Low-Income Medicare Beneficiary (SLMB), and Qualified Individual (QI).

Benefits
Covers Medicare premiums (up to $174.70/month Part B) Co-pays Deductibles

Frequently Asked Questions about Oak Grove Center

What neighborhood is Oak Grove Center in?

Oak Grove Center is in the Cool Street neighborhood.

Is Oak Grove Center in a walkable area?

Oak Grove Center has a walk score of 41. Somewhat walkable. A few nearby services may be reachable on foot, but most trips require transportation.

What is the occupancy rate at Oak Grove Center?

Oak Grove Center's occupancy is 58.8%.

Does Oak Grove Center operate as a for-profit or non-profit?

Oak Grove Center is registered as a for-profit.

Are there photos of Oak Grove Center?

Yes — there are 7 photos of Oak Grove Center in the photo gallery on this page.

What is the address of Oak Grove Center?

Oak Grove Center is located at 27 Cool St, Waterville, ME 04901.

What is the phone number of Oak Grove Center?

(207) 873-0721 will put you in contact with the team at Oak Grove Center.

Guides for Better Senior Living

Care Cost Calculator: See Prices in Your Area

Nursing Home Data Explorer

Don’t Wait Too Long: 7 Red Flag Signs Your Parent Needs Assisted Living Now

The True Cost of Assisted Living in 2025 – And How Families Are Paying For It

Understanding Senior Living Costs: Pricing Models, Discounts & Financial Assistance