


Mix of rehab and long-term care
This home supports both short-term rehab and long-term care, with residents staying for a wide range of durations.

We arrange tours, appointments, and even moving support so you don’t have to
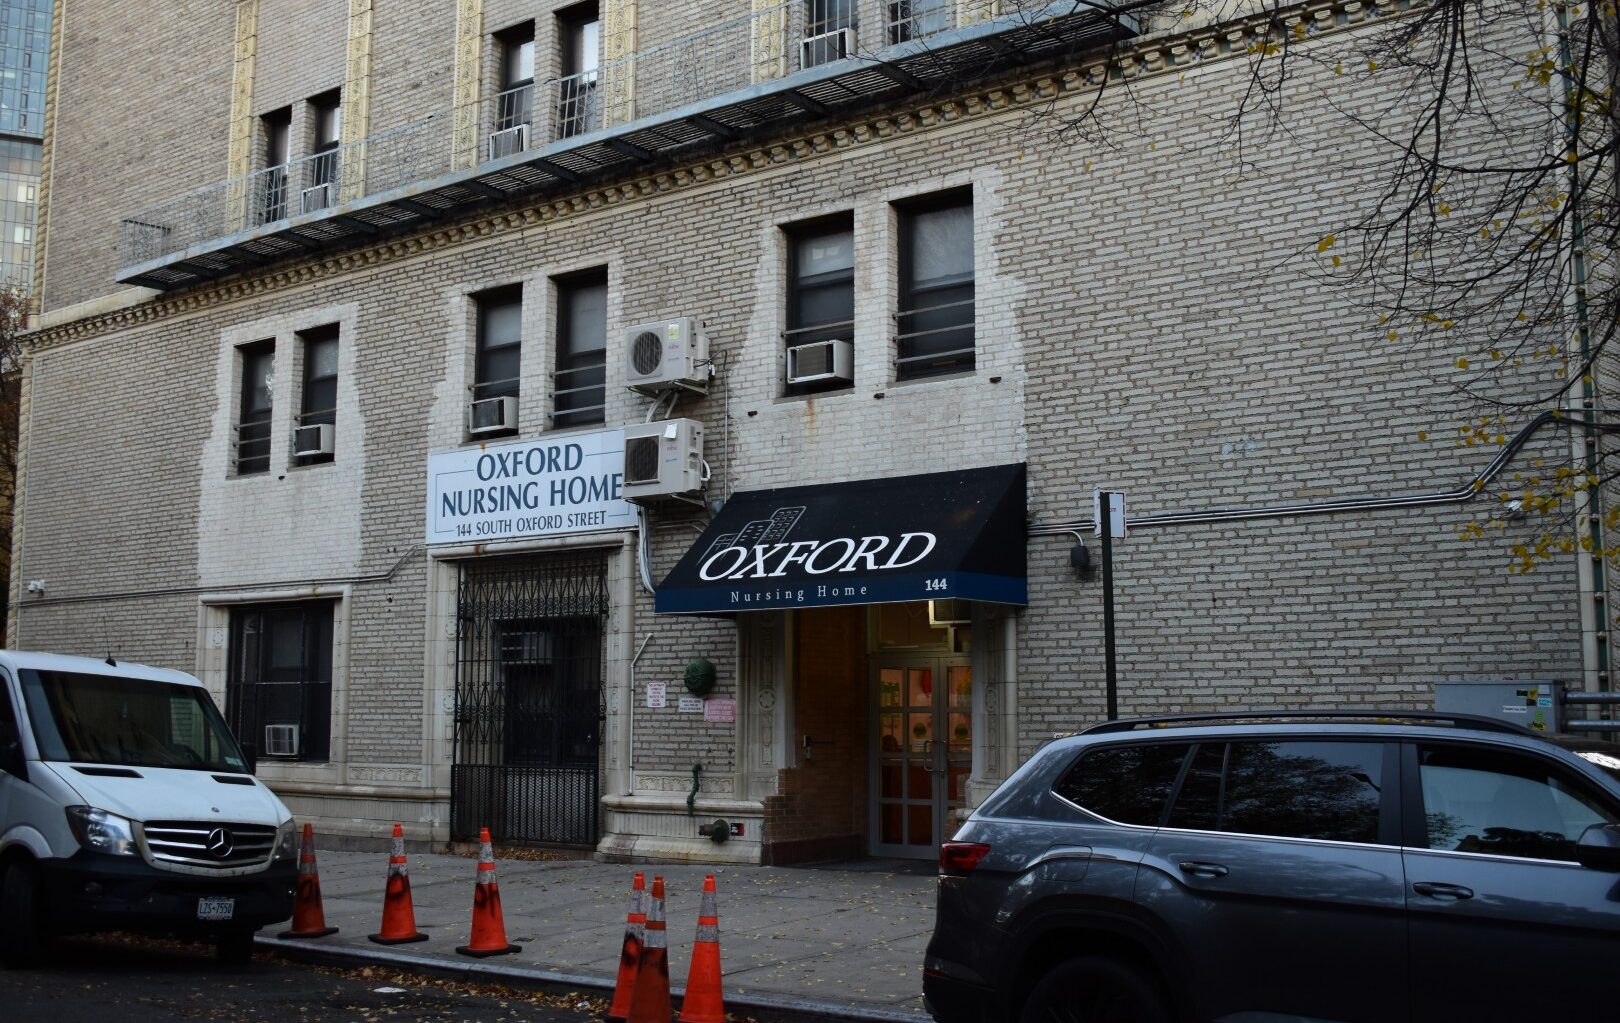
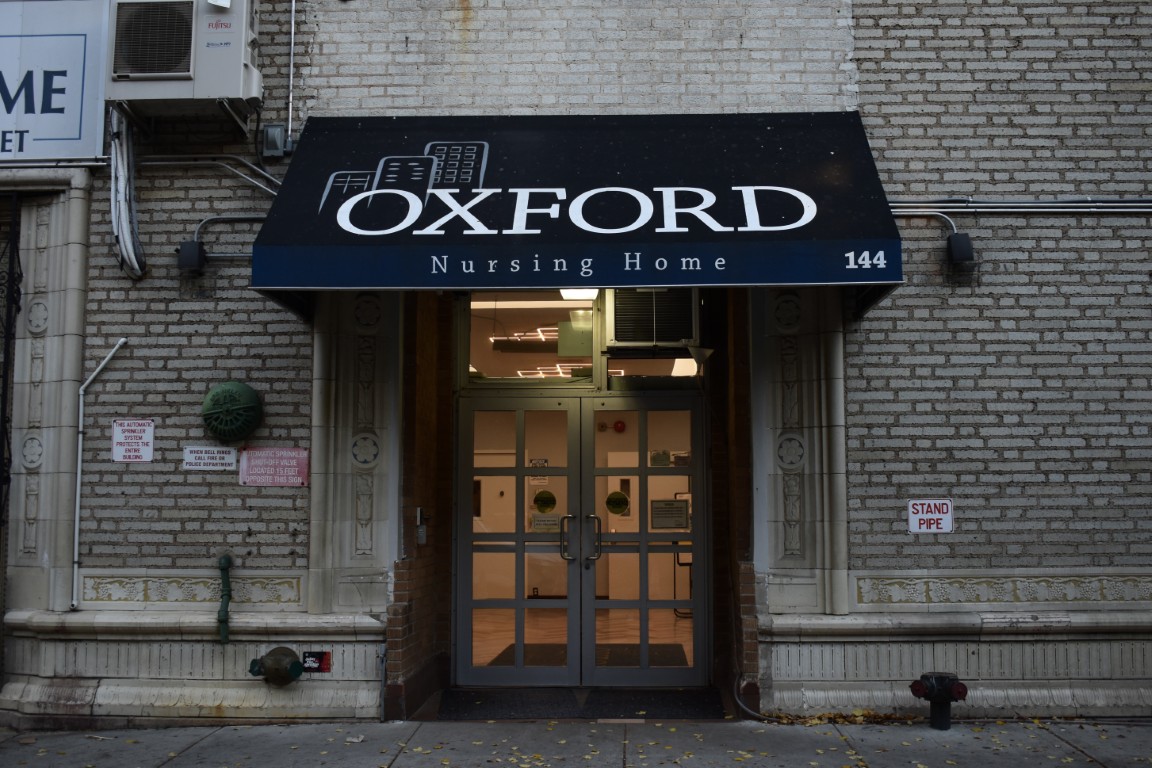
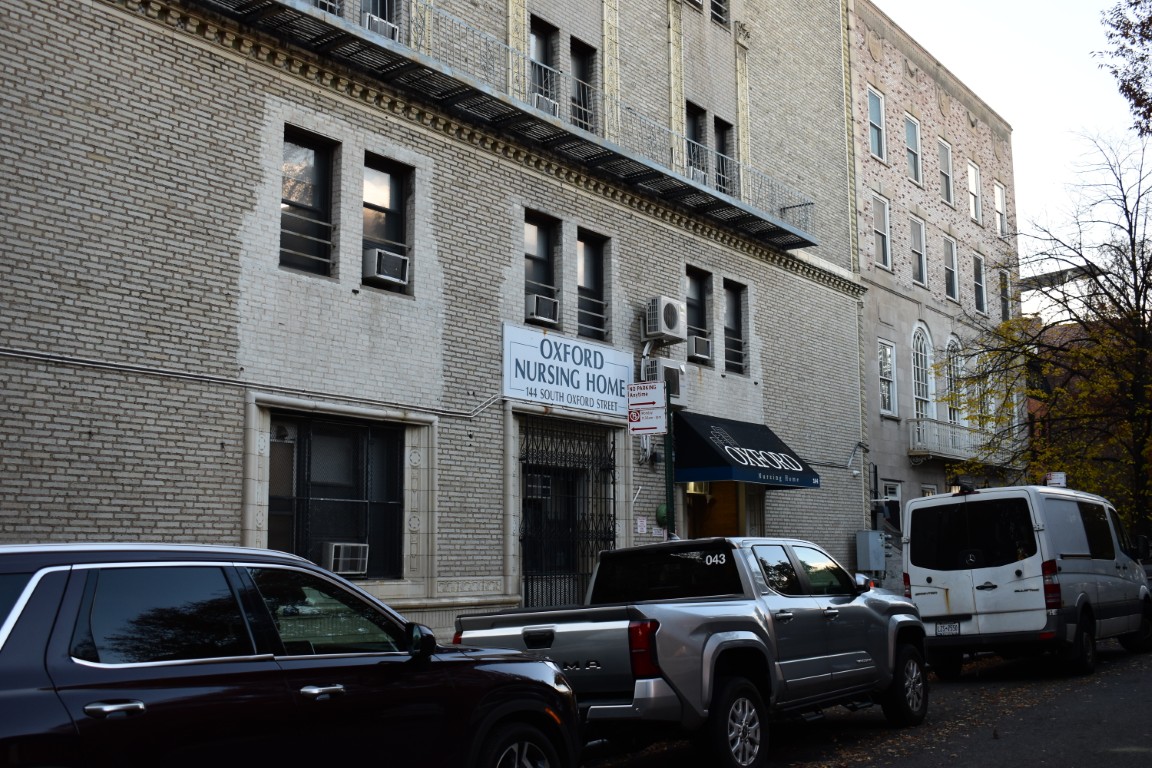
Oxford Nursing Home is an exceptional nursing home in Brooklyn, NY, that offers short-term rehabilitation and long-term care. Promoting a stress-free environment, this large community strives to meet older adults’ healthcare needs. Recreational activities, 24-hour care, and household services are also offered to ensure residents have a maintenance-free living. The community also ensures residents are well-cared for with individualized care plans.
Here, residents can celebrate special events and little moments with a variety of programs conducted for their leisure and wellness. Medicare and Medicaid are also accepted to ease residents’ financial burdens. Surrounded by local amenities, including hospitals and public transportation, the community guarantees accessibility and convenience. This nursing home is one of the ideal choices for those needing complex care for their healthcare needs in retirement in New York, especially with its exceptional services.
| Staff type | Hours / Day / Resident | vs state avg |
|---|---|---|
|
Registered Nurse (RN)
| 38m per day | ▼ 10% State avg: 42m per day · National avg: 41m per day |
|
LPN / LVN
| 26m per day | ▼ 45% State avg: 47m per day · National avg: 52m per day |
|
Nurse Aide
| 2h 34m per day | ▲ 17% State avg: 2h 11m per day · National avg: 2h 20m per day |
|
Weekend Total Nursing
| 3h 12m per day | ■ Avg State avg: 3h 14m per day · National avg: 3h 27m per day |
|
Physical Therapist
| 5m per day | ▼ 18% State avg: 7m per day · National avg: 4m per day |
|
Weekend RN
| 30m per day | ▲ 6% State avg: 29m per day · National avg: 29m per day |
Federal penalties imposed by CMS for regulatory violations, including civil money penalties (fines) and denials of payment for new Medicare/Medicaid admissions.
Source: CMS Penalties Database
No penalties in the past 3 years
No civil money penalties or payment denials were reported in the last 3 years.
28% of new residents, usually for short-term rehab.
59% of new residents, often for short stays.
13% of new residents, often for long-term daily care.
Building Type: Mid-rise
Beauty Services
Transportation Services
Rehabilitative Support
Social and Recreational Activities

On-site Medical Care and Health Services
This home supports both short-term rehab and long-term care, with residents staying for a wide range of durations.
![]() 1,8
1,8
Add your location
Oxford Nursing Home is located in Brooklyn, New York.
Here are the financial assistance programs available to residents in New York.
The information below is reported by the New York State Department of Health.
| Hopkins Center For Rehabilitation And Healthcare |
NH Nursing Home Licensed facility providing 24/7 skilled nursing care for residents with complex, ongoing medical needs. Staffed by RNs, LPNs, and CNAs. Inspected and star-rated annually by CMS. Accepts Medicare (short-term rehab) and Medicaid (long-term care).
MC Memory Care Secured, specialized care for people living with Alzheimer's or dementia. Staff trained in cognitive impairment, with higher staff-to-resident ratios and an environment designed to reduce confusion and wandering risk. | Brooklyn (Boerum Hill) | 288
Facility
288
NY AVG
160
Rank
#75 / 748 |
99.0%
Facility
99.0%
NY AVG
88.3%
Rank
#1 / 432 | +12% | 2.88
Facility
2.88
NY AVG
3.58
Rank
#285 / 387 | -16% | -20% | $0
Facility
$0
NY AVG
$67.6k
Rank
#287 / 394 | 85 | 14
Facility
14
NY AVG
18.5
Rank
#148 / 393 | 4.7
Facility
4.7
NY AVG
5.1
Rank
#193 / 393 | - | 283 | - |
97
Facility
97
NY AVG
63
Rank
#81 / 1173 | Hopkins Ventures LLC | $49.5M
Facility
$49.5M
NY AVG
$32.0M
Rank
#76 / 382 | $26.9M
Facility
$26.9M
NY AVG
$10.7M
Rank
#61 / 382 | 54.3%
Facility
54.3%
NY AVG
37%
Rank
#109 / 382 | 335847 | ||||
| Ditmas Park Nursing & Rehab |
NH Nursing Home Licensed facility providing 24/7 skilled nursing care for residents with complex, ongoing medical needs. Staffed by RNs, LPNs, and CNAs. Inspected and star-rated annually by CMS. Accepts Medicare (short-term rehab) and Medicaid (long-term care). | Brooklyn (Flatbush) | 240
Facility
240
NY AVG
160
Rank
#113 / 748 |
95.0%
Facility
95.0%
NY AVG
88.3%
Rank
#408 / 432 | +8% | - | +50% | - | $0
Facility
$0
NY AVG
$67.6k
Rank
#321 / 394 | 85
Facility
85
NY AVG
83
Rank
#164 / 344 | 7
Facility
7
NY AVG
18.5
Rank
#30 / 393 | 2.3
Facility
2.3
NY AVG
5.1
Rank
#29 / 393 | - | 194 | A- |
93
Facility
93
NY AVG
63
Rank
#192 / 1173 | Bmo Family Holdings LLC | $67.0M
Facility
$67.0M
NY AVG
$32.0M
Rank
#41 / 382 | $26.7M
Facility
$26.7M
NY AVG
$10.7M
Rank
#62 / 382 | 39.9%
Facility
39.9%
NY AVG
37%
Rank
#312 / 382 | 335648 | ||||
| The Phoenix Rehabilitation And Nursing Center |
NH Nursing Home Licensed facility providing 24/7 skilled nursing care for residents with complex, ongoing medical needs. Staffed by RNs, LPNs, and CNAs. Inspected and star-rated annually by CMS. Accepts Medicare (short-term rehab) and Medicaid (long-term care). | Brooklyn (Fort Greene) | 400
Facility
400
NY AVG
160
Rank
#25 / 748 |
98.0%
Facility
98.0%
NY AVG
88.3%
Rank
#45 / 432 | +11% | 2.59
Facility
2.59
NY AVG
3.58
Rank
#360 / 387 | +2% | -28% | $0
Facility
$0
NY AVG
$67.6k
Rank
#1 / 394 | - | 8
Facility
8
NY AVG
18.5
Rank
#41 / 393 | 2.7
Facility
2.7
NY AVG
5.1
Rank
#42 / 393 | - | 392 | - |
96
Facility
96
NY AVG
63
Rank
#108 / 1173 | - | $70.1M
Facility
$70.1M
NY AVG
$32.0M
Rank
#37 / 382 | $30.8M
Facility
$30.8M
NY AVG
$10.7M
Rank
#47 / 382 | 43.9%
Facility
43.9%
NY AVG
37%
Rank
#263 / 382 | 335516 | ||||
| Palm Gardens Center For Nursing And Rehabilitation |
NH Nursing Home Licensed facility providing 24/7 skilled nursing care for residents with complex, ongoing medical needs. Staffed by RNs, LPNs, and CNAs. Inspected and star-rated annually by CMS. Accepts Medicare (short-term rehab) and Medicaid (long-term care).
MC Memory Care Secured, specialized care for people living with Alzheimer's or dementia. Staff trained in cognitive impairment, with higher staff-to-resident ratios and an environment designed to reduce confusion and wandering risk. | Brooklyn (Kensington) | 240
Facility
240
NY AVG
160
Rank
#113 / 748 |
94.2%
Facility
94.2%
NY AVG
88.3%
Rank
#155 / 432 | +7% | 2.67
Facility
2.67
NY AVG
3.58
Rank
#335 / 387 | +8% | -25% | $0
Facility
$0
NY AVG
$67.6k
Rank
#1 / 394 | 83 | 10
Facility
10
NY AVG
18.5
Rank
#74 / 393 | 3.3
Facility
3.3
NY AVG
5.1
Rank
#84 / 393 | - | 224 | A+ |
80
Facility
80
NY AVG
63
Rank
#457 / 1173 | Palm Gardens Care Center, LLC (For Profit) | $55.4M
Facility
$55.4M
NY AVG
$32.0M
Rank
#61 / 382 | $34.5M
Facility
$34.5M
NY AVG
$10.7M
Rank
#38 / 382 | 62.3%
Facility
62.3%
NY AVG
37%
Rank
#52 / 382 | 335328 |
Oxford Nursing Home has a walk score of 98. Walker's paradise. Daily errands do not require a car, with many shops and services nearby.
Oxford Nursing Home's occupancy is 83.1%.
The team at Oxford Nursing Home can be reached at [email protected].
Yes — there are 3 photos of Oxford Nursing Home in the photo gallery on this page.
Oxford Nursing Home is located at 144 S Oxford St, Brooklyn, NY 11217.
(718) 623-9635 will put you in contact with the team at Oxford Nursing Home.
Oxford Nursing Home is not currently listed as a CMS-certified provider of Medicare or Medicaid.
Care Cost Calculator: See Prices in Your Area
Nursing Home Data Explorer
Don’t Wait Too Long: 7 Red Flag Signs Your Parent Needs Assisted Living Now
The True Cost of Assisted Living in 2025 – And How Families Are Paying For It
Understanding Senior Living Costs: Pricing Models, Discounts & Financial Assistance

Thank you for your interest!
Our team will be in touch shortly to help with next steps.
