Palm Garden of Gainesville
Nursing Home, Palliative Care & Respite Care · Gainesville, FL
CMS overall rating Info CMS (the Centers for Medicare & Medicaid Services) is the federal agency that rates nursing home quality. Its Overall Rating runs from 1 to 5 stars, combining health inspections, staffing, and quality measures, with inspections weighted most heavily.

Palm Garden of Gainesville

Nursing Home, Palliative Care & Respite Care · Gainesville, FL
CMS overall rating Info CMS (the Centers for Medicare & Medicaid Services) is the federal agency that rates nursing home quality. Its Overall Rating runs from 1 to 5 stars, combining health inspections, staffing, and quality measures, with inspections weighted most heavily.
Calculator: See prices in your area
Palm Garden of Gainesville accepts Medicare, Medicaid, and private pay.

Overview of Palm Garden of Gainesville

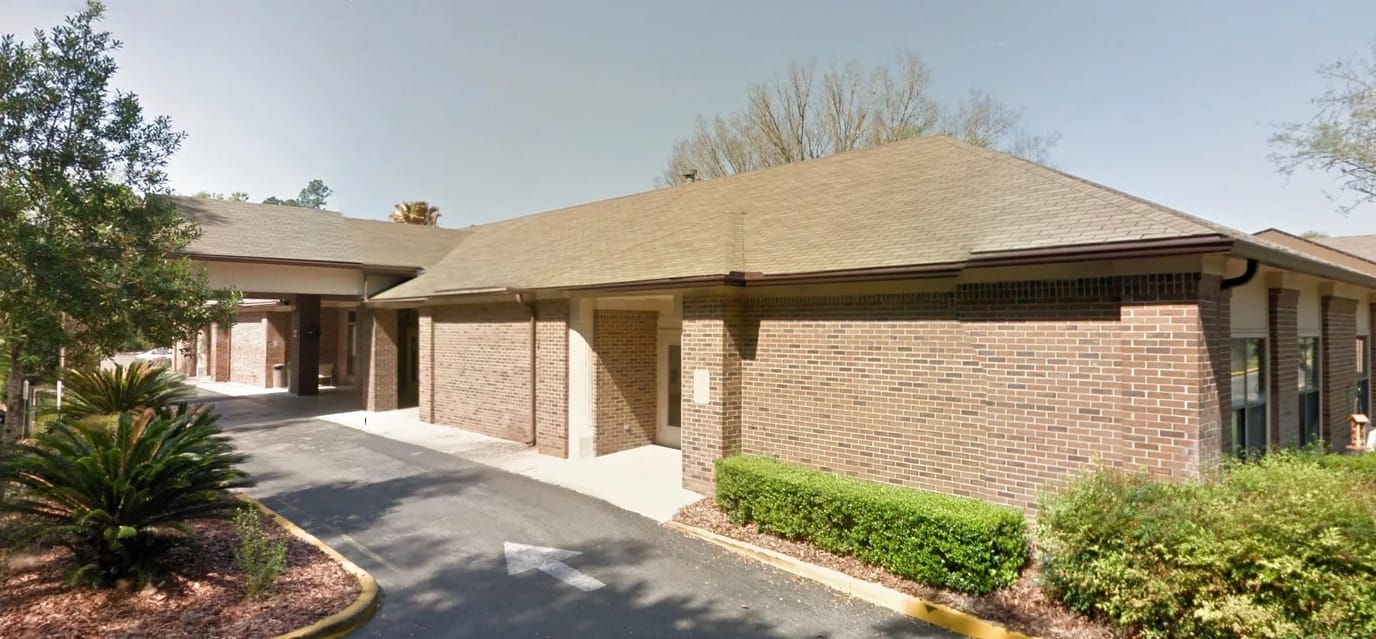
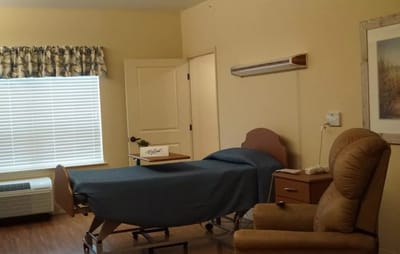
Palm Garden of Gainesville offers seniors a premier living experience, whether they require short-term, long-term, or rehabilitation care. This distinguished home boasts a team of professionals in senior care, each employing an interdisciplinary approach to ensure comprehensive support. Residents benefit from a range of activities and licensed therapists, tailored to meet their diverse needs. The primary goal here is to empower residents, fostering their maximum independence and ensuring a safe return home.

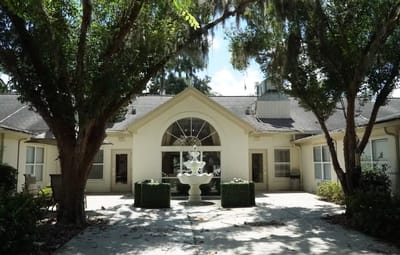
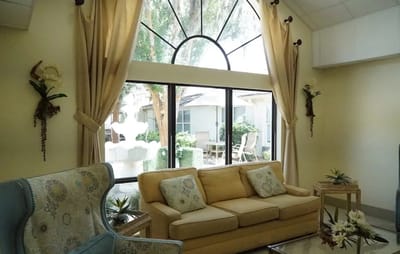
Beyond their expert care, Palm Garden provides an array of services and amenities designed for residents’ well-being. These include specialized support such as pain management, diabetes care, psychosocial assistance, as well as palliative and hospice services. The community boasts spacious outdoor areas for residents to enjoy, enhancing their overall quality of life. Additionally, Palm Garden offers unique resources like a registered dietitian, therapy services, a professional barber, and even VitalStim, a specialized program addressing swallowing difficulties.

(352) 331-0601

Quality ratings

Measured by Centers for Medicare & Medicaid Services (CMS)

Overall rating Info The Overall CMS Rating combines results from health inspections, staffing levels and quality measures. Health inspections carry the most weight. Staffing and quality scores can increase or decrease the final rating based on performance compared to state and national standards.
▲ 26.0% Above FL avg. ▲ 26.0% Above FL avg.FL average: 3.2Click the badge to see the full State ranking.Click here to see the full State ranking.
Health Inspection Info Based on the results of the facility's three most recent standard inspections and any complaint investigations. CMS reviews the number, scope, and severity of deficiencies, with more recent findings weighted more heavily.
▲ 6.7% Above FL avg. ▲ 6.7% Above FL avg.FL average: 2.8Click the badge to see the full State ranking.Click here to see the full State ranking.
Staffing Info Measures average nursing staff hours per resident per day, including Registered Nurses (RNs) and total nursing staff. Ratings are adjusted based on the level of care residents require and are compared to state and national benchmarks.
▼ 11.3% Below FL avg. ▼ 11.3% Below FL avg.FL average: 3.4Click the badge to see the full State ranking.Click here to see the full State ranking.
Quality Measures Info Based on clinical and physical health indicators reported to CMS, such as hospital readmissions, falls, pressure ulcers, and improvements in mobility. These measures reflect how well residents' health needs are being managed.
▲ 23.2% Above FL avg. ▲ 23.2% Above FL avg.FL average: 4.1Click the badge to see the full State ranking.Click here to see the full State ranking.

Staffing hours breakdown

Info Daily nursing hours per resident by staff type, reported to CMS. Higher is generally better — compare this facility to state and national averages to see where staffing stands.

Hours per resident per day — compared to Florida state averages

Total nursing care / resident Info This home is ranked 91st out of 253 homes in Florida for nurse hours. Total adjusted nursing hours per resident per day, combining RN, LPN, and aide time. CMS adjusts this for case-mix so facilities can be fairly compared.
4h 7m per day
Rank #91 / 253Nurse hours — State benchmarkedThis home is ranked 91st out of 253 homes in Florida. Shows adjusted nurse hours per resident per day benchmarked to the Florida average, with a ranking across 253 Florida facilities. More hours mean more direct care. The national average is about 3.5 hrs; below 3.0 is a red flag.Ranking totals vary by category as each rank only includes facilities that report data for that metric. Homes missing that data point aren't included in the ranking.Click the rank badge to see the full State ranking.Click here to see the full State ranking.
This facility Florida avg (4h 2m per day)
vs Florida avg
+2%

4 of 6 metrics below state avg

Standout metric LPN / LVN is +35% above state avg
Staff typeHours / Day / Residentvs state avg
Registered Nurse (RN) Info RNs hold the highest nursing license and can assess residents, interpret test results, and direct care plans. More RN hours per day often signals stronger clinical oversight and faster response to health changes. 24m per day ▼ 46% State avg: 44m per day · National avg: 41m per day
LPN / LVN Info Licensed Practical Nurses (LPNs) or Licensed Vocational Nurses (LVNs) deliver routine hands-on care — medication administration, wound dressing, and monitoring vital signs. They work under RN supervision and make up a large share of daily bedside care. 1h 4m per day ▲ 35% State avg: 47m per day · National avg: 52m per day
Nurse Aide Info Certified Nurse Aides (CNAs) provide the most direct day-to-day assistance: bathing, dressing, feeding, and mobility. Nurse aide hours are typically the largest staffing category and directly affect residents' quality of life. 2h 14m per day ▼ 5% State avg: 2h 20m per day · National avg: 2h 21m per day
Weekend Total Nursing Info Combined nursing hours (RN + LPN + Nurse Aide) per resident per day on weekends. Staffing often drops on weekends — this figure reveals whether the facility maintains adequate coverage outside of weekday hours. 3h 29m per day ■ Avg State avg: 3h 31m per day · National avg: 3h 26m per day
Physical Therapist Info Hours per resident per day provided by licensed Physical Therapists (PTs) or PT Assistants. PT services help residents recover mobility after injury or illness and are especially important for post-acute (short-stay) rehabilitation. 4m per day ▼ 19% State avg: 5m per day · National avg: 4m per day
Weekend RN Info Registered nurse hours specifically on weekends. Facilities sometimes reduce RN presence on Saturdays and Sundays — a low weekend RN figure compared to weekday hours can indicate reduced clinical oversight when most administrative staff are absent. 12m per day ▼ 63% State avg: 32m per day · National avg: 29m per day

Capacity and availability

This home usually has limited availability

Higher occupancy than the Florida average: 84.3%
Occupancy rate
89.9% Rank #120 / 258Occupancy rate — State benchmarkedThis home is ranked 120th out of 258 homes in Florida. Shows this facility's occupancy rate versus the Florida average, with its Statewide rank out of 258. Higher occupancy signals strong local demand and financial stability.Ranking totals vary by category as each rank only includes facilities that report data for that metric. Homes missing that data point aren't included in the ranking.Click the rank badge to see the full State ranking.Click here to see the full State ranking.
Avg. Length of Stay
108 days
Bed community size
150-bed community Rank #135 / 1074Bed count — State benchmarkedThis home is ranked 135th out of 1074 homes in Florida. Shows this facility's certified or reported bed count compared to other Florida facilities. Larger communities may offer more amenities, programs, and on-site services for residents and families.Ranking totals vary by category as each rank only includes facilities that report data for that metric. Homes missing that data point aren't included in the ranking.Click the rank badge to see the full State ranking.Click here to see the full State ranking.
A larger shared setting that may offer more common spaces and organized community services.
Walk Score
Walk Score: 37 / 100 Rank #787 / 1486Walk Score — State benchmarkedThis home is ranked 787th out of 1486 homes in Florida. Shows how walkable this facility's neighborhood is compared to the average Walk Score across Florida facilities. Higher scores benefit residents, families, and staff.Ranking totals vary by category as each rank only includes facilities that report data for that metric. Homes missing that data point aren't included in the ranking.Click the rank badge to see the full State ranking.Click here to see the full State ranking.
Somewhat walkable. A few nearby services may be reachable on foot, but most trips require transportation.

About this community

Awards

AwardsThe American Health Care Association's Silver Award for Achievement in Quality, The Lynn Domenech Care and Comfort Award

License Details

AccreditationsGold Seal Nursing Care Center Accreditation from the Joint Commission

Payment & Insurance

1 service
Accept Medicare

Therapy & Rehabilitation

2 services
Rehabilitation Services
Respite Care

Staffing & Medical

1 service
24-Hour Staffing

Amenities & Lifestyle

Private And Semi-Private Rooms
Spacious Therapy Gyms
Complimentary Wifi Access
Beauty/Barber Salons
Spacious Areas For Outdoor Enjoyment
Nutritional Counseling By A Registered Dietician
Specific ProgramsOutpatient Therapy, Pain Management, Specialized Wound Care Team, Physical, Occupational and Speech Therapies, VitalStim, Diabetic Care, Ileostomy and Colostomy Care, Psychosocial Support, Post Discharge Follow-up, Palliative Care and Hospice Services
Operating Hours24 hours a day, 7 days a week

Contact Palm Garden of Gainesville

Staffing Data

Reporting period: October 1 – December 31, 2025 (Q4 2025). Source: CMS Payroll-Based Journal report.

Total staff 243
Employees 204
Contractors 39
Staff to resident ratio 1.72 : 1
17% more staff per resident than Florida average
Florida average ratio: 1.47 : 1 Florida average ratio: 1.47 : 1See full Florida ranking
Avg staff/day 76
Average shift 7.9 hours
0% compared with Florida average
Florida average: 7.9 hours Florida average shift: 7.9 hoursSee full Florida ranking
Total staff hours (quarter) 55,097

Nursing staff breakdown

Q4 2025 · Oct 1 – Dec 31 More info This data comes from the CMS Payroll-Based Journal report covering October 1 – December 31, 2025.
Registered Nurse

Manages medical care and health needs.

RN Staff Info All 9 RN Staff are full-time employees. No contractors work on this role. 9
Average shift length Info Average shift length. Calculated as total hours divided by days worked and average staff per day. 7.8 hours
Licensed Practical Nurse

Assists with medical care and medications.

LPN Staff Info All 43 LPN Staff are full-time employees. No contractors work on this role. 43
Average shift length Info Average shift length. Calculated as total hours divided by days worked and average staff per day. 8.5 hours
Certified Nursing Assistant

Helps with daily care and mobility.

CNA Staff Info All 113 CNA Staff are full-time employees. No contractors work on this role. 113
Average shift length Info Average shift length. Calculated as total hours divided by days worked and average staff per day. 8.2 hours

Contractor staffing

Q4 2025 · Oct 1 – Dec 31 More info This data comes from the CMS Payroll-Based Journal report covering October 1 – December 31, 2025.

Total hours from contractors

3.8%

2,071 contractor hours this quarter

Respiratory Therapy Technician: 9 Speech Language Pathologist: 8 Physical Therapy Aide: 6 Physical Therapy Assistant: 6 Occupational Therapy Assistant: 5 Dietitian: 2 Medical Director: 1 Occupational Therapy Aide: 1 Qualified Social Worker: 1

Staff by category

Q4 2025 · Oct 1 – Dec 31 More info This data comes from the CMS Payroll-Based Journal report covering October 1 – December 31, 2025.
Certified Nursing Assistant113011328,52892100%8.2
Licensed Practical Nurse4304312,98392100%8.5
Registered Nurse9093,16792100%7.8
Dietitian82101,5809199%7.7
Speech Language Pathologist88161,4528289%6.8
Clinical Nurse Specialist4041,4376672%8.4
Mental Health Service Worker2029556773%8.1
Physical Therapy Aide2689296773%7.4
Administrator2028886166%8
Respiratory Therapy Technician69158657278%4.7
Physical Therapy Assistant1677006470%6.6
RN Director of Nursing3035896166%8.5
Nurse Practitioner1014325459%8
Qualified Social Worker2132765257%5.2
Occupational Therapy Aide0112203134%7.1
Occupational Therapy Assistant055804953%1.4
Medical Director011181617%1.1
113 Certified Nursing Assistant
% of Days 100%
43 Licensed Practical Nurse
% of Days 100%
9 Registered Nurse
% of Days 100%
10 Dietitian
% of Days 99%
16 Speech Language Pathologist
% of Days 89%
4 Clinical Nurse Specialist
% of Days 72%
2 Mental Health Service Worker
% of Days 73%
8 Physical Therapy Aide
% of Days 73%
2 Administrator
% of Days 66%
15 Respiratory Therapy Technician
% of Days 78%
7 Physical Therapy Assistant
% of Days 70%
3 RN Director of Nursing
% of Days 66%
1 Nurse Practitioner
% of Days 59%
3 Qualified Social Worker
% of Days 57%
1 Occupational Therapy Aide
% of Days 34%
5 Occupational Therapy Assistant
% of Days 53%
1 Medical Director
% of Days 17%

Penalties and fines

Federal penalties imposed by CMS for regulatory violations, including civil money penalties (fines) and denials of payment for new Medicare/Medicaid admissions.

Source: CMS Penalties Database

No penalties in the past 3 years

No civil money penalties or payment denials were reported in the last 3 years.

Quality of care over time

These measures show how residents usually do over time at this home, based on health outcomes and preventive care.

High-risk clinical events score Info A composite score based on pressure ulcers, falls with injury, weight loss, walking ability decline, and activities of daily living decline. 9.5
28% worse than Florida average

Florida average: 7.4

Functional decline score Info A composite score based on activities of daily living decline, walking ability decline, and incontinence. 14.9
20% worse than Florida average

Florida average: 12.4

Long-stay resident measures
Significantly above average Florida avg: 4.5 Info CMS star rating based on long-stay quality measure performance. 5 stars = significantly above average, 1 star = significantly below average.
Need for Help with Daily Activities Increased Info Percent of long-stay residents whose need for help with daily activities has increased 12.3%
17% worse than Florida average

Florida average: 10.5%

Walking Ability Worsened Info Percent of long-stay residents whose ability to move independently worsened 12.6%
In line with Florida average

Florida average: 12.9%

Low Risk Residents with Bowel/Bladder Incontinence Info Percent of low risk long-stay residents who lose control of their bowels or bladder 19.8%
46% worse than Florida average

Florida average: 13.5%

Falls with Major Injury Info Percent of long-stay residents experiencing one or more falls with major injury 3.3%
26% worse than Florida average

Florida average: 2.6%

High Risk Residents with Pressure Ulcers Info Percent of long-stay high risk residents with pressure ulcers 10.5%
96% worse than Florida average

Florida average: 5.4%

Urinary Tract Infection Info Percent of long-stay residents with a urinary tract infection 1.0%
10% worse than Florida average

Florida average: 0.9%

Lost Too Much Weight Info Percent of long-stay residents who lose too much weight 8.7%
45% worse than Florida average

Florida average: 6.0%

Depressive Symptoms Info Percent of long-stay residents who have depressive symptoms 0.3%
92% better than Florida average

Florida average: 3.3%

Antipsychotic Use Info Percent of long-stay residents who received an antipsychotic medication 3.3%
59% better than Florida average

Florida average: 8.0%

Pneumococcal Vaccine Info Percent of long-stay residents assessed and appropriately given the pneumococcal vaccine 99.8%
In line with Florida average

Florida average: 97.7%

Influenza Vaccine Info Percent of long-stay residents assessed and appropriately given the seasonal influenza vaccine 97.3%
In line with Florida average

Florida average: 99.2%

Hospitalizations per 1,000 days Info Number of hospitalizations per 1,000 long-stay resident days. 2.44
16% worse than Florida average

Florida average: 2.10

ED visits per 1,000 days Info Number of outpatient emergency department visits per 1,000 long-stay resident days. 0.84
29% better than Florida average

Florida average: 1.18

Short-stay resident measures
Above average Florida avg: 3.1 Info CMS star rating based on short-stay quality measure performance. 5 stars = much above average, 1 star = much below average.
Pneumococcal Vaccine Info Percent of short-stay residents assessed and appropriately given the pneumococcal vaccine 94.9%
In line with Florida average

Florida average: 94.0%

Antipsychotic medication increase Info Percent of short-stay residents who newly received an antipsychotic medication 1.1%
27% better than Florida average

Florida average: 1.5%

Influenza Vaccine Info Percent of short-stay residents assessed and appropriately given the seasonal influenza vaccine 96.4%
In line with Florida average

Florida average: 94.7%

Re-hospitalized after SNF stay Info Percentage of short-stay residents who were re-hospitalized after their nursing home admission. 27.6%
5% worse than Florida average

Florida average: 26.2%

Emergency department visits Info Percentage of short-stay residents who had an outpatient emergency department visit. 7.5%
19% better than Florida average

Florida average: 9.3%

Falls with major injury Info Percentage of SNF residents who experience falls with major injury during their stay. 1.4%
79% worse than Florida average

Florida average: 0.8%

Ability to care for self at discharge Info Percentage of residents at or above expected ability to care for themselves at discharge. 66.7%
24% better than Florida average

Florida average: 53.7%

Successful return to home or community Info Rate of successful return to home or community from a skilled nursing facility. 57.3%
13% better than Florida average

Florida average: 50.6%

Breakdown by payment type

Medicare

49% of new residents, usually for short-term rehab.

Typical stay 30 days

Private pay

37% of new residents, often for short stays.

Typical stay 1 - 2 months

Medicaid

14% of new residents, often for long-term daily care.

Typical stay 10 - 11 months

Facility Characteristics

Source: CMS Long-Term Care Facility Characteristics (Data as of Jan 2026)

Total residents 141
Medicare
23
16.3% of residents
Medicaid
100
70.9% of residents
Private pay or other
18
12.8% of residents
Programs & Services
Residents Group

Residents meet regularly to discuss policies, care quality, and activities

Active Resident Council

Organized group of residents that meets regularly to discuss facility policies, quality of life, and activities.

Finances and operations

Based on CMS SNF Cost Report for fiscal year ending in 10/2023.

Privately-owned community
Operated by a single business entity.
Net patient revenue Info Net patient revenue — what the home actually collects for resident care, after contractual allowances, bad debt and discounts are subtracted from its gross charges (CMS cost report, Worksheet G-3). It covers resident care only; money the home earns from other sources is shown separately as "Other income."
$17.5M
Net patient income Info Net patient income: net patient revenue minus the home's total operating expenses. A positive figure means it earns more from resident care than it spends to deliver it; a negative figure means the opposite. It excludes non-operating "other income."
$610.6K
Privately-owned community Operated by a single business entity.
Net patient revenue Info Net patient revenue — what the home actually collects for resident care, after contractual allowances, bad debt and discounts are subtracted from its gross charges (CMS cost report, Worksheet G-3). It covers resident care only; money the home earns from other sources is shown separately as "Other income."
$17.5M Rank #70 / 257Revenue — State benchmarkedThis home is ranked 70th out of 257 homes in Florida. Shows this facility's annual revenue compared to the Florida average. Higher revenue generally means more resources for staffing and capital — read alongside Payroll %.Ranking totals vary by category as each rank only includes facilities that report data for that metric. Homes missing that data point aren't included in the ranking.Click the rank badge to see the full State ranking.Click here to see the full State ranking.
Net patient income Info Net patient income: net patient revenue minus the home's total operating expenses. A positive figure means it earns more from resident care than it spends to deliver it; a negative figure means the opposite. It excludes non-operating "other income."
$610.6K
Other income Info Money the home earns outside of resident care — such as investments, grants, rentals and other non-operating sources (CMS cost report, Worksheet G-3). It is tracked separately from net patient revenue: it is not part of that figure, and it is not included in net patient income.
$37.2K
Payroll costs Info Staff salaries plus wage-related costs — benefits such as payroll taxes, health insurance and retirement — from the home's own accounting records (CMS cost report, Worksheet A). Contract or agency labor is counted separately, under other operating costs. Rank #114 / 257Payroll — State benchmarkedThis home is ranked 114th out of 257 homes in Florida. Shows total annual staff payroll benchmarked to the Florida average. Higher payroll investment relative to peers often signals better staffing and less reliance on cheaper contract labor.Ranking totals vary by category as each rank only includes facilities that report data for that metric. Homes missing that data point aren't included in the ranking.Click the rank badge to see the full State ranking.Click here to see the full State ranking.
$7.4M 42.1% of net patient revenue Info Payroll as a share of revenue: staff salaries and wage-related benefits divided by net patient revenue. A higher figure means more of each revenue dollar goes to staff pay. Rank #209 / 257Payroll % — State benchmarkedThis home is ranked 209th out of 257 homes in Florida. Shows payroll as a percentage of revenue versus the Florida average. Well-run Florida facilities typically land around 49–56% — the top third Statewide. Below 25% may signal understaffing or heavy agency use — read with Staffing ratings.Ranking totals vary by category as each rank only includes facilities that report data for that metric. Homes missing that data point aren't included in the ranking.Click the rank badge to see the full State ranking.Click here to see the full State ranking.
Other operating costs Info Everything it costs to run the home apart from payroll — food, utilities, supplies, maintenance, contract labor and administration. Calculated as total operating expense minus payroll (staff salaries and wage-related benefits).
$9.5M
Total costs Info The home's total operating expense for the year — all the costs of running it, salaries included (CMS cost report, Worksheet G-3).
$16.9M

Who this home usually serves

TYPE OF STAY

Mostly short-term rehab stays

Most residents typically stay for a few weeks or months before returning home or moving on.

New residents most often arrive under Medicare (49% of admissions), and a typical Medicare stay runs around 30 days.

Admissions
654 total

Coverage residents most often arrive under.

Medicare 49%
Private pay 37%
Medicaid 14%
Discharges
457 total

Coverage residents most often leave under.

Medicare 61%
Private pay 10%
Medicaid 30%

Managed by Kala Fuhrmann

Executive Director

Places of interest near Palm Garden of Gainesville

Address 5.9 miles from city center Info Estimated distance in miles from Gainesville's city center to Palm Garden of Gainesville's address, calculated via Google Maps. — 0.74 miles to nearest hospital (HCA Florida North Florida Hospital)

Calculate Travel Distance to Palm Garden of Gainesville

Add your location

Address

Compare Nursing Home around Gainesville

The information below is reported by the Florida Agency for Health Care Administration (AHCA).

5 facilities compared · CMS & FL Dept. of Health data

Parklands Care Center
NH
HC
PC
RC
Gainesville (University Heights)
120
Facility 120
FL AVG 89
Rank #256 / 1074
92.8%
Facility 92.8%
FL AVG 84.3%
Rank #68 / 258
+10%
3.68
Facility 3.68
FL AVG 4.04
Rank #175 / 253
-30%-9%
$0
Facility $0
FL AVG $78.9k
Rank #1 / 258
-
11
Facility 11
FL AVG 19.7
Rank #53 / 252
2.2
Facility 2.2
FL AVG 4.5
Rank #28 / 252
-112-
64
Facility 64
FL AVG 40
Rank #291 / 1486
Parklands Nursing Snf Holdco LLC
$5.7M
Facility $5.7M
FL AVG $15.7M
Rank #210 / 257
$2.9M
Facility $2.9M
FL AVG $6.1M
Rank #244 / 257
51.7%
Facility 51.7%
FL AVG 39.8%
Rank #247 / 257
105638
Terrace Health & Rehabilitation Center
NH
RC
Gainesville
138
Facility 138
FL AVG 89
Rank #183 / 1074
86.1%
Facility 86.1%
FL AVG 84.3%
Rank #163 / 258
+2%
3.94
Facility 3.94
FL AVG 4.04
Rank #126 / 253
-54%-2%
$13.7k
Facility $13.7k
FL AVG $78.9k
Rank #184 / 258
-
16
Facility 16
FL AVG 19.7
Rank #107 / 252
3.2
Facility 3.2
FL AVG 4.5
Rank #66 / 252
-127-
39
Facility 39
FL AVG 40
Rank #743 / 1486
Terrace Snf Holdco LLC
$16.6M
Facility $16.6M
FL AVG $15.7M
Rank #97 / 257
$7.4M
Facility $7.4M
FL AVG $6.1M
Rank #132 / 257
44.5%
Facility 44.5%
FL AVG 39.8%
Rank #203 / 257
106046
Oak Hammock at the University of Florida
NH
AL
MC
Gainesville
80
Facility 80
FL AVG 89
Rank #582 / 1074
85.5%
Facility 85.5%
FL AVG 84.3%
Rank #166 / 258
+1%
5.85
Facility 5.85
FL AVG 4.04
Rank #12 / 253
-31%+45%
$0
Facility $0
FL AVG $78.9k
Rank #1 / 258
92
Facility 92
FL AVG 83
Rank #237 / 876
13
Facility 13
FL AVG 19.7
Rank #73 / 252
4.3
Facility 4.3
FL AVG 4.5
Rank #129 / 252
-71-
6
Facility 6
FL AVG 40
Rank #1343 / 1486
Donna Brown
$13.2M
Facility $13.2M
FL AVG $15.7M
Rank #20 / 257
$17.1M
Facility $17.1M
FL AVG $6.1M
Rank #12 / 257
129.6%
Facility 129.6%
FL AVG 39.8%
Rank #135 / 257
106066
Palm Garden of Gainesville
NH
PC
RC
Gainesville
150
Facility 150
FL AVG 89
Rank #135 / 1074
89.9%
Facility 89.9%
FL AVG 84.3%
Rank #120 / 258
+7%
4.12
Facility 4.12
FL AVG 4.04
Rank #91 / 253
-69%+2%
$0
Facility $0
FL AVG $78.9k
Rank #1 / 258
-
29
Facility 29
FL AVG 19.7
Rank #205 / 252
2.9
Facility 2.9
FL AVG 4.5
Rank #52 / 252
-139-
37
Facility 37
FL AVG 40
Rank #787 / 1486
Kala Fuhrmann
$17.5M
Facility $17.5M
FL AVG $15.7M
Rank #70 / 257
$7.4M
Facility $7.4M
FL AVG $6.1M
Rank #114 / 257
42.1%
Facility 42.1%
FL AVG 39.8%
Rank #209 / 257
105571
Signature HealthCARE of Gainesville
NH
Gainesville
120
Facility 120
FL AVG 89
Rank #256 / 1074
89.4%
Facility 89.4%
FL AVG 84.3%
Rank #130 / 258
+6%
3.96
Facility 3.96
FL AVG 4.04
Rank #110 / 253
-55%-2%
$12.9k
Facility $12.9k
FL AVG $78.9k
Rank #182 / 258
-
31
Facility 31
FL AVG 19.7
Rank #216 / 252
4.4
Facility 4.4
FL AVG 4.5
Rank #137 / 252
-106-
38
Facility 38
FL AVG 40
Rank #764 / 1486
Gainesville Fl Holdco LLC
$11.3M
Facility $11.3M
FL AVG $15.7M
Rank #211 / 257
$4.0M
Facility $4.0M
FL AVG $6.1M
Rank #191 / 257
35.2%
Facility 35.2%
FL AVG 39.8%
Rank #42 / 257
105664

Financial Assistance for
Nursing Home in Florida

Palm Garden of Gainesville is located in Gainesville, Florida.
Here are the financial assistance programs available to residents in Florida.

Get Financial aid guidance

Long-Term Care Waiver

Florida Medicaid LTC Waiver

Age 65+ or 21+ disabled
General Florida resident, Medicaid- eligible, nursing home-level care need.
Income Limits (2025) ~$2,829/month 300% FBR, individual
Asset Limits $2,000 (individual), $3,000 (couple).
FL

High demand; waitlists common.

Benefits
In-home care (6-8 hours/day) Assisted living Respite (240 hours/year) Case management

Community Care for the Elderly (CCE)

Florida CCE

Age 60+
General Florida resident, at risk of nursing home.
Income Limits ~$2,000/month varies
Asset Limits $5,000 individual
FL

Limited funding; regional variation.

Benefits
Homemaker services (3-5 hours/week) Adult day care (~$60/day) Respite (up to 10 days/year)

Home Care for the Elderly (HCE)

Florida Home Care for the Elderly

Age 60+
General Florida resident, at risk of nursing home placement; caregiver must be approved.
Income Limits (2025) ~$2,829/month individual, aligned with Medicaid thresholds
Asset Limits ~$2,000 (individual); varies by case manager discretion.
FL

Limited funding (~3,500 served annually); prioritizes low-income frail seniors.

Benefits
Basic subsidy (~$160/month) for housing/medical costs; special subsidies for supplies/services (e.g., incontinence supplies, ~$50-$200/month)

Program of All-Inclusive Care for the Elderly (PACE)

Florida Medicaid PACE

Age 55+
General Florida resident, nursing home-level care need, safe with PACE support.
Income Limits (2025) ~$2,829/month 300% FBR
Asset Limits $2,000 (individual), $3,000 (couple).
FL

Limited to specific counties (e.g., Hillsborough, Miami-Dade); ~10 sites statewide.

Benefits
Personal care (5-7 hours/day) Medical care Meals Transportation Therapy

Optional State Supplementation (OSS)

Florida Optional State Supplementation

Age 65+ or disabled
General Florida resident, living in approved facility, receiving SSI or low-income.
Income Limits (2025) ~$1,004/month individual, including SSI
Asset Limits $2,000 (individual), $3,000 (couple).
FL

Limited to specific facility types; ~$78.40/month max supplement.

Benefits
Cash payment (~$78.40/month) for room/board or personal needs in facilities

Frequently Asked Questions about Palm Garden of Gainesville

Is Palm Garden of Gainesville in a walkable area?

Palm Garden of Gainesville has a walk score of 37. Somewhat walkable. A few nearby services may be reachable on foot, but most trips require transportation.

What is the occupancy rate at Palm Garden of Gainesville?

Palm Garden of Gainesville's occupancy is 89.9%.

Are there photos of Palm Garden of Gainesville?

Yes — there are 11 photos of Palm Garden of Gainesville in the photo gallery on this page.

What is the phone number of Palm Garden of Gainesville?

(352) 331-0601 will put you in contact with the team at Palm Garden of Gainesville.

Is Palm Garden of Gainesville Medicare or Medicaid certified?

Yes — Palm Garden of Gainesville is a CMS-certified provider of Medicare and Medicaid.

Guides for Better Senior Living

Care Cost Calculator: See Prices in Your Area

Nursing Home Data Explorer

Don’t Wait Too Long: 7 Red Flag Signs Your Parent Needs Assisted Living Now

The True Cost of Assisted Living in 2025 – And How Families Are Paying For It

Understanding Senior Living Costs: Pricing Models, Discounts & Financial Assistance