


Total health inspections
5
Florida average 4.3
Last Health inspection on Mar 2025
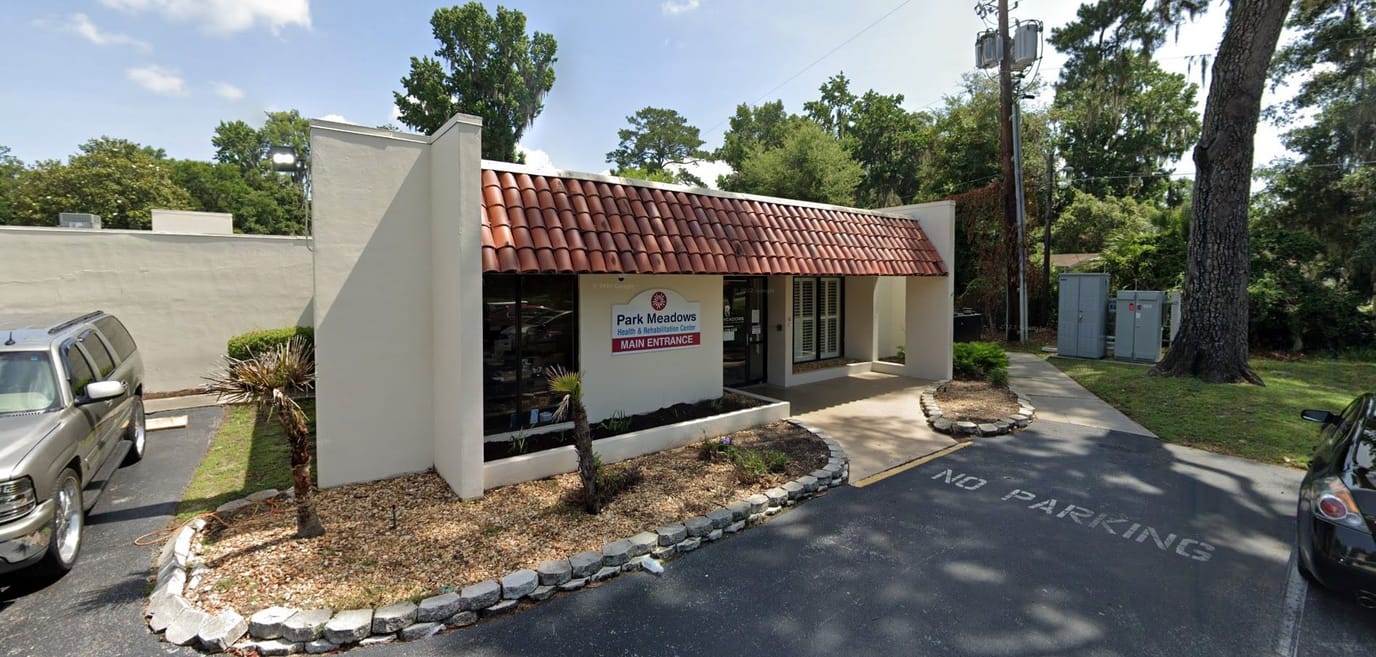
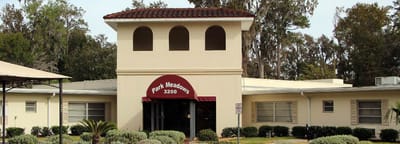
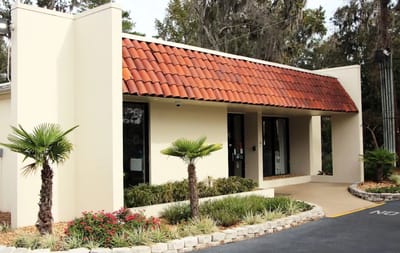


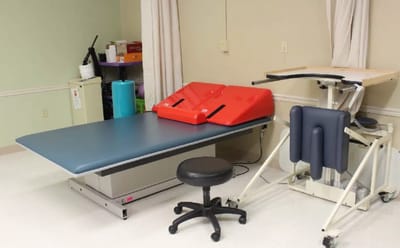
Set in Gainesville, Florida, Park Meadows Health and Rehabilitation Center provides a comforting and healing approach to care. They provide an array of equipment, services, and surroundings that enhance the daily lives of seniors, catering to their medical needs, rehabilitation requirements, and the need for companionship. The community also features amenities like a private enclosed courtyard, providing residents a serene space to unwind.
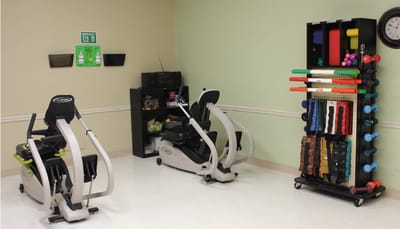
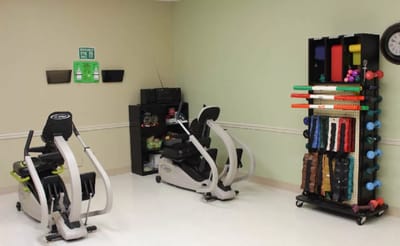
Additionally, their commitment to convenience is reflected in services such as complimentary transportation and a modern rehabilitation gym. Engaging activities, ranging from games to arts and crafts, as well as light exercise classes like chair yoga, ensure that residents stay active and involved. Families can rest assured knowing that Park Meadows Health and Rehabilitation Center provides the best care in nursing homes, a fact echoed by glowing nursing home reviews.
| Staff type | Hours / Day / Resident | vs state avg |
|---|---|---|
|
Registered Nurse (RN)
| 31m per day | ▼ 29% State avg: 44m per day · National avg: 41m per day |
|
LPN / LVN
| 51m per day | ▲ 9% State avg: 47m per day · National avg: 52m per day |
|
Nurse Aide
| 2h 11m per day | ▼ 7% State avg: 2h 20m per day · National avg: 2h 21m per day |
|
Weekend Total Nursing
| 3h 16m per day | ▼ 7% State avg: 3h 31m per day · National avg: 3h 26m per day |
|
Physical Therapist
| 6m per day | ▲ 18% State avg: 5m per day · National avg: 4m per day |
|
Weekend RN
| 22m per day | ▼ 30% State avg: 32m per day · National avg: 29m per day |
Key information about the people who lead and staff this community.
In Florida, the Agency for Health Care Administration (AHCA) is the primary authority that conducts unannounced inspections and completes official health quality reports for all healthcare facilities.
Inspection score unavailable
Not enough inspection history to generate a score.
Average score for Florida nursing homes: B 83/100
Citations
| This Facility | FL Average | vs. FL Avg |
|---|---|---|---|
|
Total citations
| 30 | 33 | This facility has 9% fewer total citations than a typical Florida nursing home (30 vs. FL avg 33).↓ 9% better |
Florida average 4.3
Last Health inspection on Mar 2025
Florida average 19.7
Florida average 4.48
Health citations are formal notices following inspections when they fail to comply with safety and care standards.
25 of 30 citations resulted from standard inspections; and 5 of 30 resulted from complaint investigations.
Florida average: 0.8
Florida average: 0.4
Reporting period: October 1 – December 31, 2025 (Q4 2025). Source: CMS Payroll-Based Journal report.
Manages medical care and health needs.
Assists with medical care and medications.
Helps with daily care and mobility.
Total hours from contractors
401 contractor hours this quarter
| Certified Nursing Assistant | 96 | 1 | 97 | 28,209 | 92 | 100% | 7.7 |
| Licensed Practical Nurse | 33 | 0 | 33 | 9,008 | 92 | 100% | 8.7 |
| Registered Nurse | 20 | 0 | 20 | 4,924 | 92 | 100% | 8.9 |
| RN Director of Nursing | 4 | 0 | 4 | 2,002 | 84 | 91% | 8.9 |
| Speech Language Pathologist | 3 | 0 | 3 | 1,384 | 69 | 75% | 8.1 |
| Clinical Nurse Specialist | 3 | 0 | 3 | 1,298 | 87 | 95% | 9 |
| Respiratory Therapy Technician | 4 | 0 | 4 | 1,274 | 71 | 77% | 7 |
| Physical Therapy Assistant | 2 | 0 | 2 | 850 | 69 | 75% | 7.4 |
| Dietitian | 2 | 0 | 2 | 850 | 77 | 84% | 7.3 |
| Qualified Social Worker | 2 | 0 | 2 | 704 | 72 | 78% | 6 |
| Physical Therapy Aide | 4 | 0 | 4 | 566 | 63 | 68% | 7.1 |
| Administrator | 1 | 0 | 1 | 528 | 66 | 72% | 8 |
| Nurse Practitioner | 1 | 0 | 1 | 504 | 63 | 68% | 8 |
| Dental Services Staff | 1 | 0 | 1 | 497 | 59 | 64% | 8.4 |
| Mental Health Service Worker | 1 | 0 | 1 | 480 | 60 | 65% | 8 |
| Medical Director | 0 | 1 | 1 | 26 | 13 | 14% | 2 |
Includes penalties issued in 2024
Federal penalties imposed by CMS for regulatory violations, including civil money penalties (fines) and denials of payment for new Medicare/Medicaid admissions.
Source: CMS Penalties Database (Data as of Jan 2026)
Florida average: $72K
Florida average: 2.6
Florida average: 0.1
Penalties are imposed by CMS for violations of federal nursing home regulations.
2 penalties in the past 3 years
Multiple penalties were reported in the last 3 years.
Last updated: Jan 2026
These measures show how residents usually do over time at this home, based on health outcomes and preventive care.
Florida average: 7.4
Florida average: 12.4
Florida average: 10.5%
Florida average: 12.9%
Florida average: 13.5%
Florida average: 2.6%
Florida average: 5.4%
Florida average: 0.9%
Florida average: 6.0%
Florida average: 3.3%
Florida average: 97.7%
Florida average: 99.2%
Florida average: 2.10
Florida average: 1.18
Florida average: 94.0%
Florida average: 1.5%
Florida average: 94.7%
Florida average: 26.2%
Florida average: 9.3%
Florida average: 0.8%
Florida average: 53.7%
Florida average: 50.6%
Quality measures are calculated from Minimum Data Set (MDS) assessments. For most measures, lower percentages indicate better care quality.
37% of new residents, usually for short-term rehab.
44% of new residents, often for short stays.
19% of new residents, often for long-term daily care.
Source: CMS Long-Term Care Facility Characteristics (Data as of Jan 2026)
Residents meet regularly to discuss policies, care quality, and activities
Organized group of residents that meets regularly to discuss facility policies, quality of life, and activities.
Data sourced from CMS Long-Term Care Facility Characteristics quarterly report. Payer mix reflects the current resident census by primary payment source.
Historical financial and operational data for Park Meadows Health and Rehabilitation Center from 2011–2023, based on CMS SNF Cost Reports.
Key figures below are for fiscal year ending in 12/2023.
Based on CMS SNF Cost Report for fiscal year ending in 12/2023.
This home supports both short-term rehab and long-term care, with residents staying for a wide range of durations.
New residents most often arrive under private pay (44% of admissions), and a typical private pay stay runs around 27 days.
Coverage residents most often arrive under.
Coverage residents most often leave under.
![]() 3.7 miles from city center
3.7 miles from city center
![]() Estimated distance in miles from Gainesville's city center to Park Meadows Health and Rehabilitation Center's address, calculated via Google Maps.
— 0.72 miles to nearest hospital (UF Health CPR Training Center - Shands Hospital)
Estimated distance in miles from Gainesville's city center to Park Meadows Health and Rehabilitation Center's address, calculated via Google Maps.
— 0.72 miles to nearest hospital (UF Health CPR Training Center - Shands Hospital)
Add your location
Info below is compiled from CMS reports & the FL Agency for Health Care Administration (AHCA), senior community websites & trusted data sources such as Walk Score & BBB.
Communities are listed from highest to lowest based on our ranking methodology.
| Oak Hammock at the University of Florida | NH AL MC SNF | Gainesville | 80
Facility
80
FL AVG
88
Rank
#570 / 1058 | - | - | 5.85
Facility
5.85
FL AVG
4.04
Rank
#12 / 181 | -31% | +45% | $0
Facility
$0
FL AVG
$78.9k
Rank
#1 / 185 | 92
Facility
92
FL AVG
83
Rank
#237 / 876 | 13
Facility
13
FL AVG
19.7
Rank
#56 / 181 | 4.3
Facility
4.3
FL AVG
4.5
Rank
#92 / 181 | - | 71 | - |
6
Facility
6
FL AVG
40
Rank
#1344 / 1487 | Donna Brown | $13.2MFiscal year ending 12/2023
Facility
$13.2MFiscal year ending 12/2023
FL AVG
$15.7M
Rank
#19 / 184 | $17.1MFiscal year ending 12/2023
Facility
$17.1MFiscal year ending 12/2023
FL AVG
$6.1M
Rank
#11 / 184 | 129.6%Fiscal year ending 12/2023
Facility
129.6%Fiscal year ending 12/2023
FL AVG
39.8%
Rank
#90 / 184 | 106066 | ||||
| Terrace Health & Rehabilitation Center | NH RC SNF | Gainesville | 138
Facility
138
FL AVG
88
Rank
#180 / 1058 |
92.2%
Facility
92.2%
FL AVG
84.4
Rank
#51 / 125 | +9% | 3.94
Facility
3.94
FL AVG
4.04
Rank
#104 / 181 | -54% | -2% | $13.7k
Facility
$13.7k
FL AVG
$78.9k
Rank
#130 / 185 | - | 16
Facility
16
FL AVG
19.7
Rank
#78 / 181 | 3.2
Facility
3.2
FL AVG
4.5
Rank
#48 / 181 | - | 127 | - |
39
Facility
39
FL AVG
40
Rank
#744 / 1487 | Terrace Snf Holdco LLC | $16.6MFiscal year ending 04/2024
Facility
$16.6MFiscal year ending 04/2024
FL AVG
$15.7M
Rank
#80 / 184 | $7.4MFiscal year ending 04/2024
Facility
$7.4MFiscal year ending 04/2024
FL AVG
$6.1M
Rank
#108 / 184 | 44.5%Fiscal year ending 04/2024
Facility
44.5%Fiscal year ending 04/2024
FL AVG
39.8%
Rank
#143 / 184 | 106046 | ||||
| Parklands Care Center | NH HOS PC RC SNF | Gainesville (University Heights) | 120
Facility
120
FL AVG
88
Rank
#253 / 1058 |
93.6%
Facility
93.6%
FL AVG
84.4
Rank
#36 / 125 | +11% | 3.68
Facility
3.68
FL AVG
4.04
Rank
#137 / 181 | -30% | -9% | $0
Facility
$0
FL AVG
$78.9k
Rank
#1 / 185 | - | 11
Facility
11
FL AVG
19.7
Rank
#42 / 181 | 2.2
Facility
2.2
FL AVG
4.5
Rank
#22 / 181 | - | 112 | - |
64
Facility
64
FL AVG
40
Rank
#291 / 1487 | Parklands Nursing Snf Holdco LLC | $13.3M*Fiscal year ending 12/2022These figures are from this home's most recent complete cost report — an older period than most facilities report. Compare with that in mind.
Facility
$13.3M*Fiscal year ending 12/2022These figures are from this home's most recent complete cost report — an older period than most facilities report. Compare with that in mind.
FL AVG
$15.7M
Rank
#49 / 184 | $5.4M*Fiscal year ending 12/2022These figures are from this home's most recent complete cost report — an older period than most facilities report. Compare with that in mind.
Facility
$5.4M*Fiscal year ending 12/2022These figures are from this home's most recent complete cost report — an older period than most facilities report. Compare with that in mind.
FL AVG
$6.1M
Rank
#148 / 184 | 40.2%*Fiscal year ending 12/2022These figures are from this home's most recent complete cost report — an older period than most facilities report. Compare with that in mind.
Facility
40.2%*Fiscal year ending 12/2022These figures are from this home's most recent complete cost report — an older period than most facilities report. Compare with that in mind.
FL AVG
39.8%
Rank
#181 / 184 | 105638 | ||||
| Palm Garden of Gainesville | NH PC RC SNF | Gainesville | 150
Facility
150
FL AVG
88
Rank
#132 / 1058 |
92.8%
Facility
92.8%
FL AVG
84.4
Rank
#46 / 125 | +10% | 4.12
Facility
4.12
FL AVG
4.04
Rank
#76 / 181 | -69% | +2% | $0
Facility
$0
FL AVG
$78.9k
Rank
#1 / 185 | - | 29
Facility
29
FL AVG
19.7
Rank
#147 / 181 | 2.9
Facility
2.9
FL AVG
4.5
Rank
#38 / 181 | - | 139 | - |
37
Facility
37
FL AVG
40
Rank
#788 / 1487 | Kala Fuhrmann | $17.5MFiscal year ending 10/2023
Facility
$17.5MFiscal year ending 10/2023
FL AVG
$15.7M
Rank
#62 / 184 | $7.4MFiscal year ending 10/2023
Facility
$7.4MFiscal year ending 10/2023
FL AVG
$6.1M
Rank
#94 / 184 | 42.1%Fiscal year ending 10/2023
Facility
42.1%Fiscal year ending 10/2023
FL AVG
39.8%
Rank
#147 / 184 | 105571 | ||||
| Park Meadows Health and Rehabilitation Center | NH HOS PC RC SNF | Gainesville (Oak Glade Apartments) | 148
Facility
148
FL AVG
88
Rank
#148 / 1058 |
95.1%
Facility
95.1%
FL AVG
84.4
Rank
#16 / 125 | +13% | 3.99
Facility
3.99
FL AVG
4.04
Rank
#91 / 181 | -7% | -1% | $184.3k
Facility
$184.3k
FL AVG
$78.9k
Rank
#182 / 185 | - | 30
Facility
30
FL AVG
19.7
Rank
#151 / 181 | 6.0
Facility
6.0
FL AVG
4.5
Rank
#144 / 181 | 8 | 141 | - |
51
Facility
51
FL AVG
40
Rank
#503 / 1487 | Park Meadows Snf Holdco LLC | $15.9MFiscal year ending 12/2023
Facility
$15.9MFiscal year ending 12/2023
FL AVG
$15.7M
Rank
#105 / 184 | $8.6MFiscal year ending 12/2023
Facility
$8.6MFiscal year ending 12/2023
FL AVG
$6.1M
Rank
#87 / 184 | 54.4%Fiscal year ending 12/2023
Facility
54.4%Fiscal year ending 12/2023
FL AVG
39.8%
Rank
#65 / 184 | 105193 |
Park Meadows Health and Rehabilitation Center is located in Gainesville, Florida.
Here are the financial assistance programs available to residents in Florida.
Park Meadows Health and Rehabilitation Center is in the Oak Glade Apartments neighborhood of Gainesville.
Park Meadows Health and Rehabilitation Center has a walk score of 51. Moderately walkable. Some errands can be accomplished on foot, with a mix of nearby amenities.
Park Meadows Health and Rehabilitation Center's occupancy is 93.1%.
No, Park Meadows Health and Rehabilitation Center has a no-pet policy.
Park Meadows Health and Rehabilitation Center is registered as a for-profit in FL.
Park Meadows Health and Rehabilitation Center has had 30 reported citations since 2022 according to records from Florida Agency for Health Care Administration (AHCA).
Yes — there are 8 photos of Park Meadows Health and Rehabilitation Center in the photo gallery on this page.
Care Cost Calculator: See Prices in Your Area
Nursing Home Data Explorer
Don’t Wait Too Long: 7 Red Flag Signs Your Parent Needs Assisted Living Now
The True Cost of Assisted Living in 2025 – And How Families Are Paying For It
Understanding Senior Living Costs: Pricing Models, Discounts & Financial Assistance


