


Total health inspections
8
State average 4.4
Last Health inspection on Sep 2025
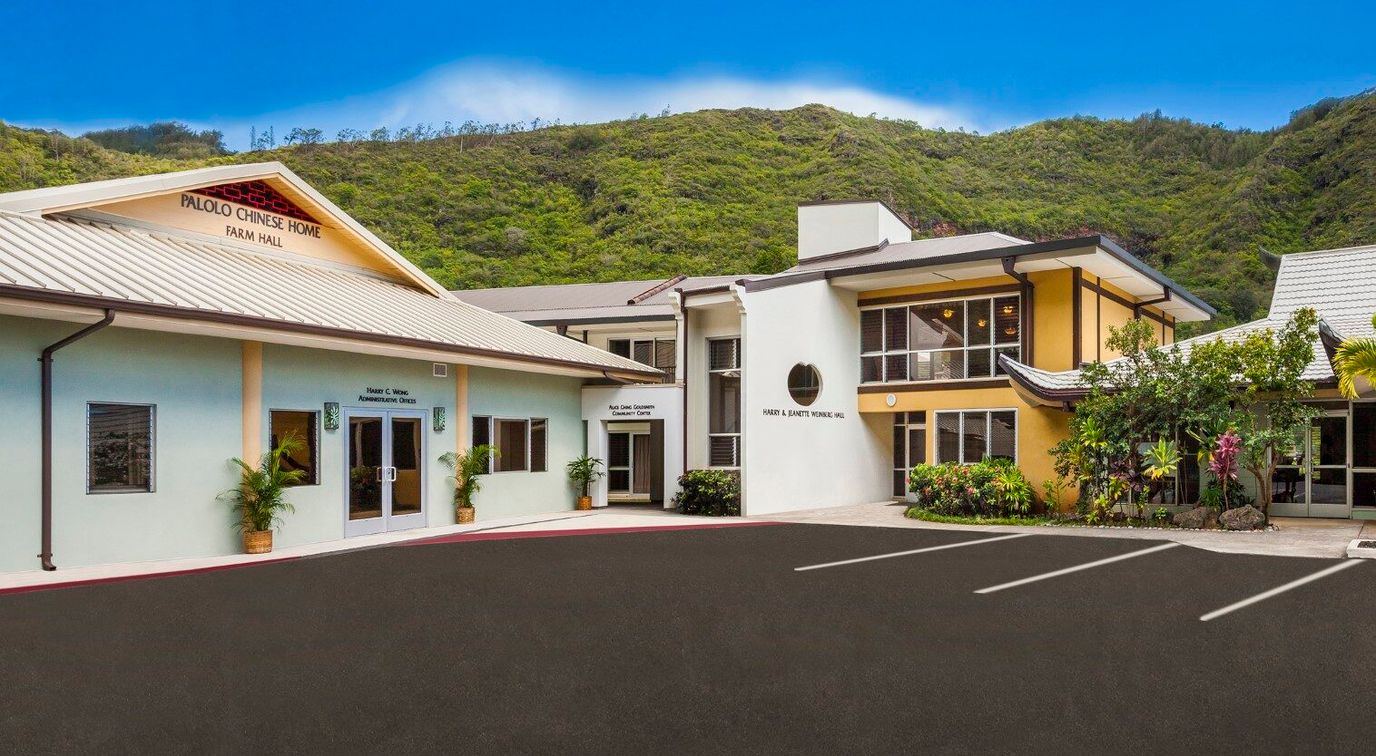
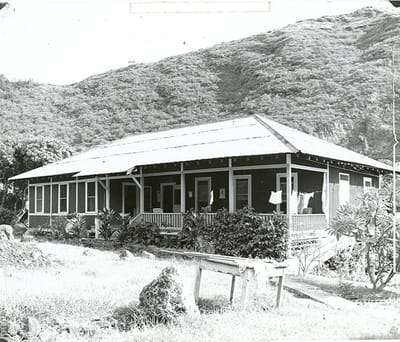

Eighteen beds, more than 120 years in operation. Pālolo Chinese Home is one of the smaller nursing homes in Honolulu, and one of the oldest. Located at 2459 10th Ave in the Pālolo neighborhood, the single-story facility sits about 3.4 miles from the city center in a car-dependent area (Walk Score 10). The intimate scale is the defining physical fact here.
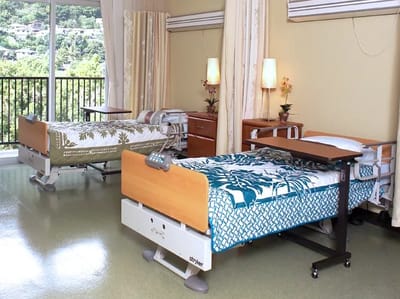
Care options span nursing home, assisted living, hospice, and respite care. The average resident stay runs 82 days, which puts this facility squarely in the transitional and short-term care range rather than long-haul residential placement. Private and semi-private rooms are the available configurations.
Staffing runs around the clock, with total nursing care at 4 hours and 32 minutes per resident per day. Registered nurses account for 1 hour and 23 minutes of that figure. Rehabilitation services and short-term rehab are available on-site, consistent with the facility’s short average stay.
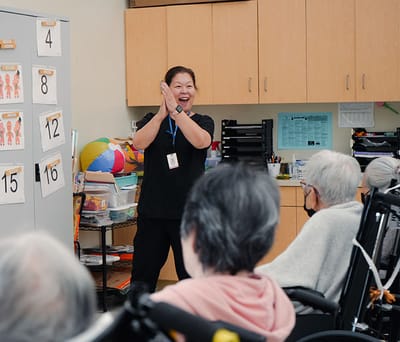
The service model reaches well beyond the building. Alongside residential care, Pālolo Chinese Home operates Senior Day Care, In-Home Services, Home Cleaning, Chore Services, Meals to Go, and an Older Adult Home Modification Program. Overnight Respite Care is available for families who need a temporary bridge. The facility accepts Medicare, Medicaid, and private pay.
Pālolo Chinese Home is a small, deeply rooted institution that has oriented itself toward community-based care as much as residential placement. Families working through a short-term recovery or exploring in-home support alongside nursing care will find more options here than the bed count alone suggests.
| Staff type | Hours / Day / Resident | vs state avg |
|---|---|---|
|
Registered Nurse (RN)
| 1h 23m per day | ▼ 15% State avg: 1h 38m per day · National avg: 41m per day |
|
LPN / LVN
| 4m per day | ▼ 82% State avg: 20m per day · National avg: 52m per day |
|
Nurse Aide
| 2h 31m per day | ▼ 6% State avg: 2h 41m per day · National avg: 2h 20m per day |
|
Weekend Total Nursing
| 3h 35m per day | ▼ 13% State avg: 4h 6m per day · National avg: 3h 27m per day |
|
Physical Therapist
| 2m per day | ▼ 65% State avg: 6m per day · National avg: 4m per day |
|
Weekend RN
| 1h 8m per day | ▼ 9% State avg: 1h 14m per day · National avg: 29m per day |
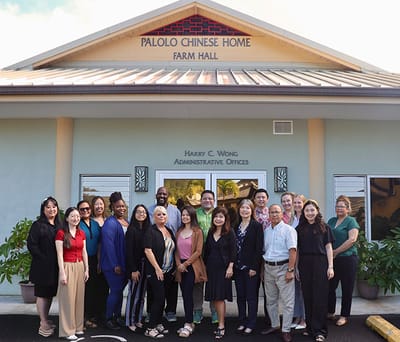
Pālolo Chinese Home is legally operated by Darlene Nakayama.
Key information about the people who lead and staff this community.
State average 4.4
Last Health inspection on Sep 2025
State average 35.5
State average 8.23
Health citations are formal notices following inspections when they fail to comply with safety and care standards.
29 of 45 citations resulted from standard inspections; 12 of 45 resulted from complaint investigations; and 4 of 45 came from combined inspections (standard and complaint).
State average: 0.1
State average: 1
Reporting period: October 1 – December 31, 2025 (Q4 2025). Source: CMS Payroll-Based Journal report.
Manages medical care and health needs.
Assists with medical care and medications.
Helps with daily care and mobility.
Total hours from contractors
11,576 contractor hours this quarter
| Certified Nursing Assistant | 38 | 32 | 70 | 22,052 | 92 | 100% | 8.3 |
| Registered Nurse | 24 | 26 | 50 | 11,064 | 92 | 100% | 8 |
| Other Dietary Services Staff | 3 | 2 | 5 | 1,181 | 90 | 98% | 7.3 |
| Clinical Nurse Specialist | 2 | 0 | 2 | 834 | 62 | 67% | 8.1 |
| Speech Language Pathologist | 0 | 6 | 6 | 777 | 84 | 91% | 7.3 |
| Physical Therapy Aide | 0 | 5 | 5 | 626 | 73 | 79% | 6.4 |
| Dental Services Staff | 2 | 0 | 2 | 592 | 62 | 67% | 8.5 |
| Nurse Practitioner | 2 | 0 | 2 | 556 | 58 | 63% | 7.9 |
| Nurse Aide in Training | 3 | 0 | 3 | 553 | 52 | 57% | 9.7 |
| Administrator | 1 | 0 | 1 | 527 | 52 | 57% | 10.1 |
| RN Director of Nursing | 1 | 0 | 1 | 514 | 67 | 73% | 7.7 |
| Dietitian | 1 | 0 | 1 | 489 | 65 | 71% | 7.5 |
| Qualified Social Worker | 0 | 2 | 2 | 473 | 61 | 66% | 7.6 |
| Occupational Therapy Aide | 1 | 0 | 1 | 384 | 48 | 52% | 8 |
| Respiratory Therapy Technician | 0 | 6 | 6 | 301 | 70 | 76% | 2.8 |
| Mental Health Service Worker | 1 | 0 | 1 | 220 | 48 | 52% | 4.6 |
| Physical Therapy Assistant | 0 | 5 | 5 | 214 | 54 | 59% | 3.6 |
| Licensed Practical Nurse | 0 | 1 | 1 | 41 | 5 | 5% | 8.2 |
| Medical Director | 1 | 0 | 1 | 7 | 5 | 5% | 1.3 |
Includes penalties issued in 2025
Federal penalties imposed by CMS for regulatory violations, including civil money penalties (fines) and denials of payment for new Medicare/Medicaid admissions.
Source: CMS Penalties Database (Data as of Jan 2026)
Hawaii average: $38K
Hawaii average: 1.5
Hawaii average: 0.1
Penalties are imposed by CMS for violations of federal nursing home regulations.
1 penalty in the past 3 years
Sep 5, 2025 · $13K
Last updated: Jan 2026
These measures show how residents usually do over time at this home, based on health outcomes and preventive care.
Hawaii average: 10.2
Hawaii average: 20.0
Hawaii average: 17.6%
Hawaii average: 25.8%
Hawaii average: 18.3%
Hawaii average: 2.1%
Hawaii average: 3.6%
Hawaii average: 2.4%
Hawaii average: 4.7%
Hawaii average: 1.5%
Hawaii average: 10.1%
Hawaii average: 96.3%
Hawaii average: 95.4%
Hawaii average: 83.4%
Hawaii average: 1.2%
Hawaii average: 84.7%
Quality measures are calculated from Minimum Data Set (MDS) assessments. For most measures, lower percentages indicate better care quality.
23% of new residents, usually for short-term rehab.
74% of new residents, often for short stays.
3% of new residents, often for long-term daily care.
Source: CMS Long-Term Care Facility Characteristics (Data as of Jan 2026)
Residents meet regularly to discuss policies, care quality, and activities
Family members meet regularly to discuss policies, care quality, and activities
Organized group of family members that meets regularly to discuss facility policies, resident care, and activities.
Organized group of residents that meets regularly to discuss facility policies, quality of life, and activities.
Data sourced from CMS Long-Term Care Facility Characteristics quarterly report. Payer mix reflects the current resident census by primary payment source.
Historical financial and operational data for Pālolo Chinese Home from 2011–2023, based on CMS SNF Cost Reports.
Key figures below are for fiscal year ending in 12/2023.
Based on CMS SNF Cost Report for fiscal year ending in 12/2023.
No pets allowed
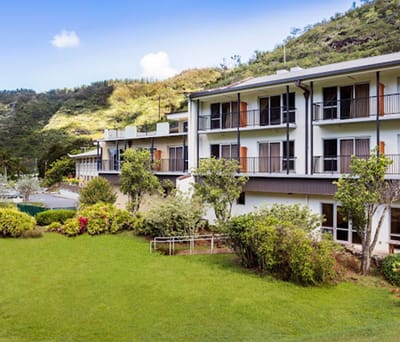
Housing Options: Private / Semi-Private Rooms
Building Type: Single-story
Housekeeping Services
Social and Recreational Activities

On-site Medical Care and Health Services
Residents typically stay for brief periods, with frequent admissions and discharges throughout the year.
Most new residents arrive under private pay (74% of admissions), and a typical private pay stay runs around 2 - 3 months.
Coverage residents most often arrive under.
Coverage residents most often leave under.
![]() 4.6 miles from city center
4.6 miles from city center
![]() Estimated distance in miles from Honolulu's city center to Pālolo Chinese Home's address, calculated via Google Maps.
— 2.35 miles to nearest hospital (Lu0113u02bbahi Hospital)
Estimated distance in miles from Honolulu's city center to Pālolo Chinese Home's address, calculated via Google Maps.
— 2.35 miles to nearest hospital (Lu0113u02bbahi Hospital)
Add your location
Info below is compiled from CMS reports & the HI Dept. of Health, senior community websites & trusted data sources such as Walk Score & BBB.
Communities are listed from highest to lowest based on our ranking methodology.
| Hi’olani Assisted Living Center at Kahala Nui | NH AL IL MC SNF | Honolulu (Waialae - Kahala) | 20
Facility
20
HI AVG
43
Rank
#39 / 84 |
85.5%
Facility
85.5%
HI AVG
84.1
Rank
#13 / 23 | +2% | 5.36
Facility
5.36
HI AVG
4.20
Rank
#2 / 25 | +16% | +28% | $0
Facility
$0
HI AVG
$43.4k
Rank
#1 / 26 | 24
Facility
24
HI AVG
35.5
Rank
#7 / 26 | 8.0
Facility
8.0
HI AVG
8.2
Rank
#16 / 26 | - | 17 | - |
71
Facility
71
HI AVG
49
Rank
#46 / 177 | Craig Courts | $8.2MFiscal year ending 12/2023
Facility
$8.2MFiscal year ending 12/2023
HI AVG
$20.8M
Rank
#2 / 24 | $13.4MFiscal year ending 12/2023
Facility
$13.4MFiscal year ending 12/2023
HI AVG
$7.1M
Rank
#4 / 24 | 163.8%Fiscal year ending 12/2023
Facility
163.8%Fiscal year ending 12/2023
HI AVG
38.9%
Rank
#23 / 24 | 125055 | ||||
| Pālolo Chinese Home | NH AL HOS RESC RC SNF | Honolulu (Palolo) | 18
Facility
18
HI AVG
43
Rank
#41 / 84 | - | - | 4.54
Facility
4.54
HI AVG
4.20
Rank
#10 / 25 | +47% | +8% | $0
Facility
$0
HI AVG
$43.4k
Rank
#1 / 26 | 45
Facility
45
HI AVG
35.5
Rank
#21 / 26 | 5.6
Facility
5.6
HI AVG
8.2
Rank
#3 / 26 | 1 | 98 | A+ |
10
Facility
10
HI AVG
49
Rank
#155 / 177 | Palolo Chinese Home | $15.6MFiscal year ending 12/2023
Facility
$15.6MFiscal year ending 12/2023
HI AVG
$20.8M
Rank
#8 / 24 | $10.3MFiscal year ending 12/2023
Facility
$10.3MFiscal year ending 12/2023
HI AVG
$7.1M
Rank
#9 / 24 | 66.4%Fiscal year ending 12/2023
Facility
66.4%Fiscal year ending 12/2023
HI AVG
38.9%
Rank
#16 / 24 | 125059 | ||||
| Hale Malamalama | NH HOS SNF | Honolulu (Kuliouou - Kalani Iki) | 40
Facility
40
HI AVG
43
Rank
#29 / 84 |
87.3%
Facility
87.3%
HI AVG
84.1
Rank
#11 / 23 | +4% | 3.79
Facility
3.79
HI AVG
4.20
Rank
#18 / 25 | -34% | -10% | $87.0k
Facility
$87.0k
HI AVG
$43.4k
Rank
#24 / 26 | 43
Facility
43
HI AVG
35.5
Rank
#19 / 26 | 10.8
Facility
10.8
HI AVG
8.2
Rank
#23 / 26 | 3 | 35 | - |
23
Facility
23
HI AVG
49
Rank
#131 / 177 | Ono Enterprise Ltd | $4.0M*Fiscal year ending 2013These figures are from this home's most recent complete cost report — an older period than most facilities report. Compare with that in mind.
Facility
$4.0M*Fiscal year ending 2013These figures are from this home's most recent complete cost report — an older period than most facilities report. Compare with that in mind.
HI AVG
$20.8M
Rank
#24 / 24 | $2.6M*Fiscal year ending 2013These figures are from this home's most recent complete cost report — an older period than most facilities report. Compare with that in mind.
Facility
$2.6M*Fiscal year ending 2013These figures are from this home's most recent complete cost report — an older period than most facilities report. Compare with that in mind.
HI AVG
$7.1M
Rank
#24 / 24 | 65.5%*Fiscal year ending 2013These figures are from this home's most recent complete cost report — an older period than most facilities report. Compare with that in mind.
Facility
65.5%*Fiscal year ending 2013These figures are from this home's most recent complete cost report — an older period than most facilities report. Compare with that in mind.
HI AVG
38.9%
Rank
#2 / 24 | 125050 |
Pālolo Chinese Home is in the Palolo neighborhood of Honolulu.
Pālolo Chinese Home is legally operated by Darlene Nakayama.
Pālolo Chinese Home has a walk score of 10. Car-dependent. Most errands require a car, with limited nearby walkable options.
According to HI state health department records, Pālolo Chinese Home's license number is 1563-C.
Pālolo Chinese Home's occupancy is 79.6%.
No, Pālolo Chinese Home has a no-pet policy.
Pālolo Chinese Home is registered as a for-profit in HI.
Care Cost Calculator: See Prices in Your Area
Nursing Home Data Explorer
Don’t Wait Too Long: 7 Red Flag Signs Your Parent Needs Assisted Living Now
The True Cost of Assisted Living in 2025 – And How Families Are Paying For It
Understanding Senior Living Costs: Pricing Models, Discounts & Financial Assistance


