Park View At Ellicott City
Nursing Home & Independent Living · Maryland, MD
CMS overall rating Info The Overall CMS Rating is scored from 1 to 5 stars and combines results from health inspections, staffing levels, and quality measures. Health inspections carry the most weight. Staffing and quality scores can increase or decrease the final rating based on performance compared to state and national standards.

Park View At Ellicott City

Nursing Home & Independent Living · Maryland, MD
CMS overall rating Info The Overall CMS Rating is scored from 1 to 5 stars and combines results from health inspections, staffing levels, and quality measures. Health inspections carry the most weight. Staffing and quality scores can increase or decrease the final rating based on performance compared to state and national standards.
Calculator: See prices in your area
Park View At Ellicott City accepts Medicare and private pay.

Overview of Park View at Ellicott City

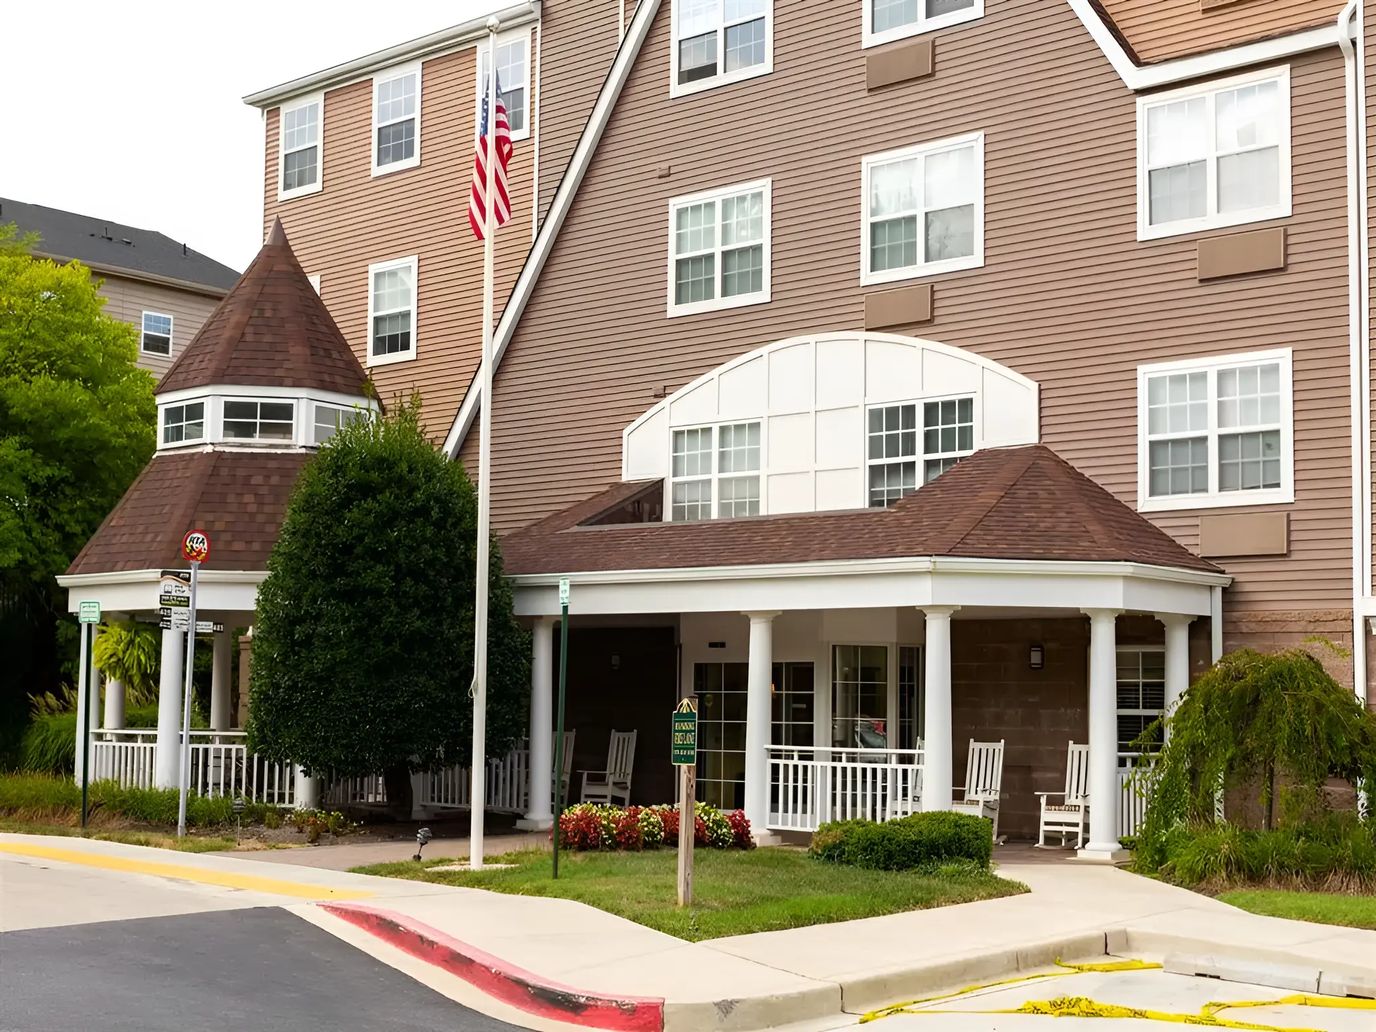
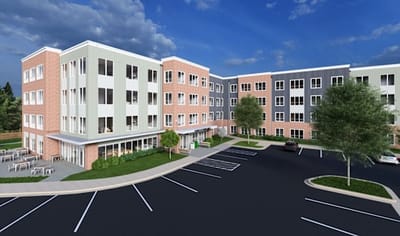
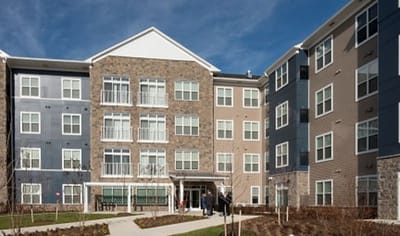
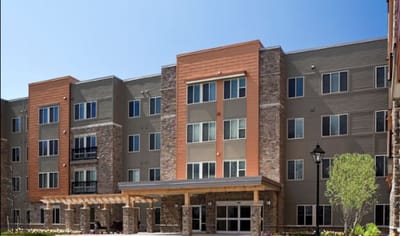
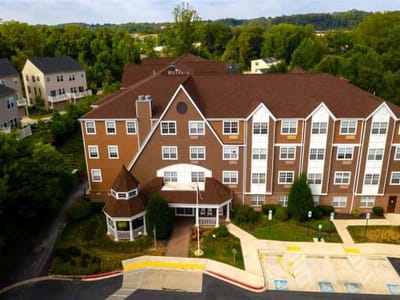
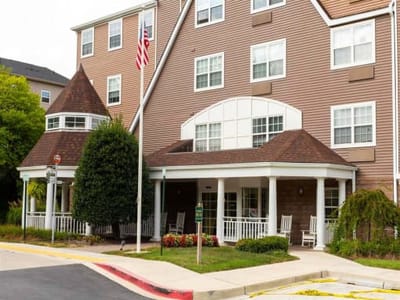
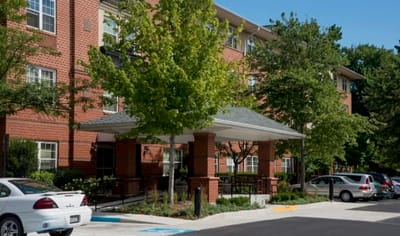
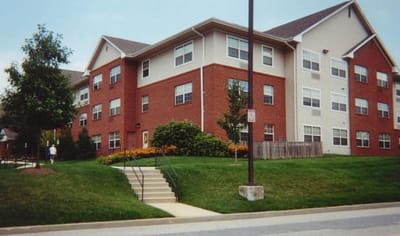
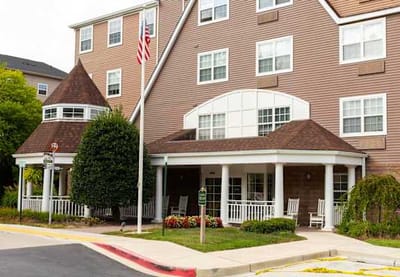
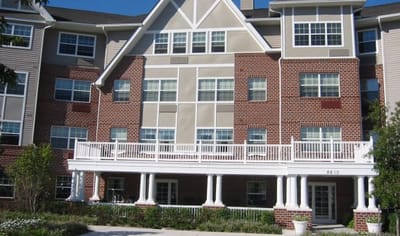
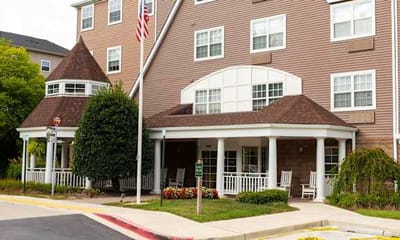
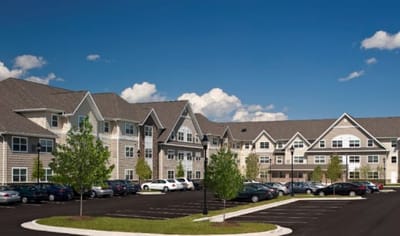
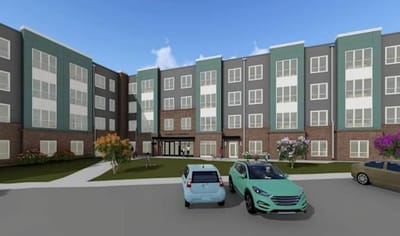
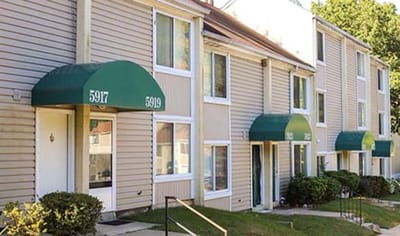
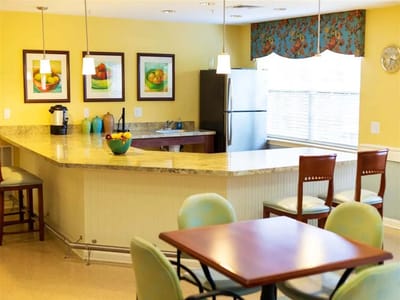
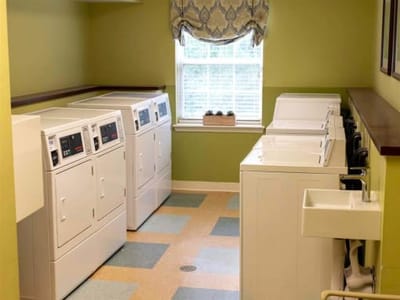
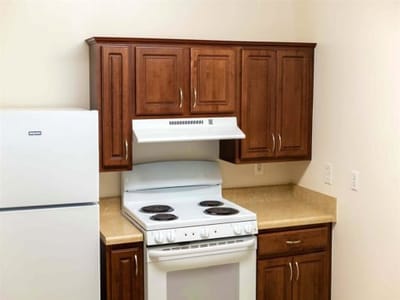
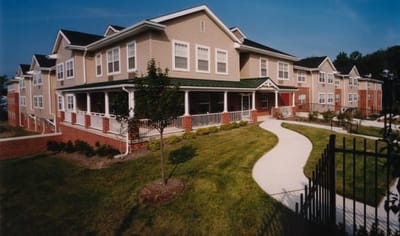
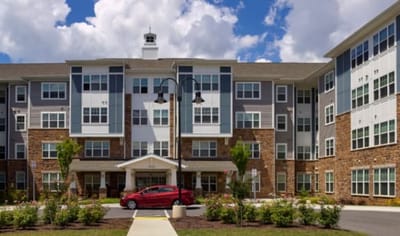
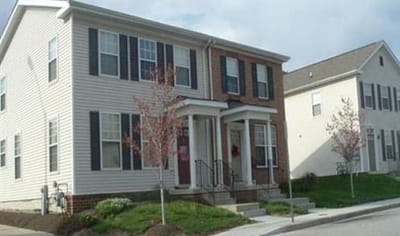
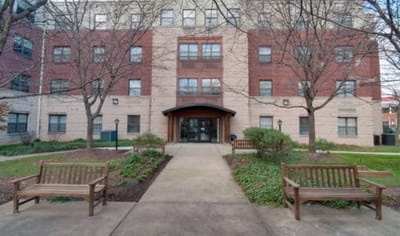
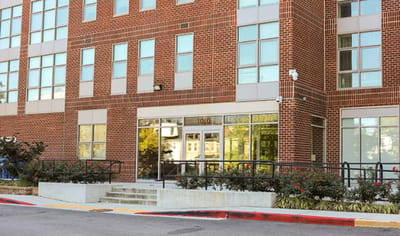
Spend your golden years at Park View at Ellicott City, a blissful haven in Ellicott City, MD, offering independent living. The community is dedicated to enhancing the quality of life of those 62+, providing thoughtfully designed and sophisticated one- and two-bedroom floor plans. Residents can keep their peace of mind with round-the-clock emergency maintenance, management, and laundry spaces.

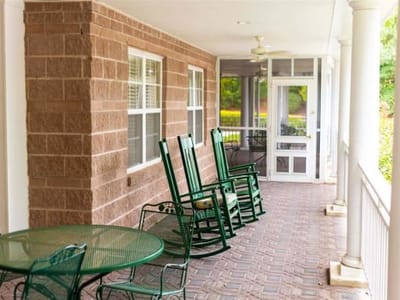
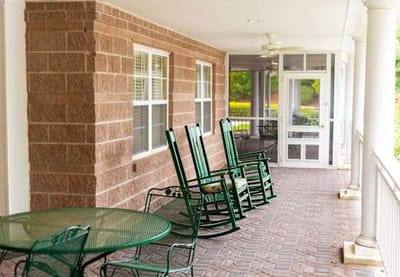
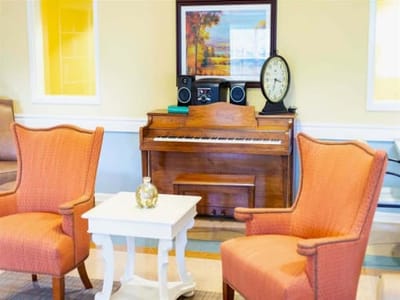
Cozy communal spaces and wellness opportunities are available, ensuring residents can live an active and vibrant lifestyle. Here, residents have easy access to plenty of dining options with restaurants and shops nearby. A library, a fitness center, a game room, a computer center, salon services, and a wellness suite are available, creating the ideal setting for residents to thrive in retirement.

(410) 203-9501

Quality ratings

Measured by Centers for Medicare & Medicaid Services (CMS)

Overall rating Info The Overall CMS Rating combines results from health inspections, staffing levels and quality measures. Health inspections carry the most weight. Staffing and quality scores can increase or decrease the final rating based on performance compared to state and national standards.
▲ 64.4% Above MD avg. ▲ 64.4% Above MD avg.Click the badge to see the full State ranking.Click here to see the full State ranking.
Health Inspection Info Based on the results of the facility's three most recent standard inspections and any complaint investigations. CMS reviews the number, scope, and severity of deficiencies, with more recent findings weighted more heavily.
▲ 42.0% Above MD avg. ▲ 42.0% Above MD avg.Click the badge to see the full State ranking.Click here to see the full State ranking.
Staffing Info Measures average nursing staff hours per resident per day, including Registered Nurses (RNs) and total nursing staff. Ratings are adjusted based on the level of care residents require and are compared to state and national benchmarks.
At MD avg. At MD avg.Click the badge to see the full State ranking.Click here to see the full State ranking.
Quality Measures Info Based on clinical and physical health indicators reported to CMS, such as hospital readmissions, falls, pressure ulcers, and improvements in mobility. These measures reflect how well residents' health needs are being managed.
▲ 35.3% Above MD avg. ▲ 35.3% Above MD avg.Click the badge to see the full State ranking.Click here to see the full State ranking.

Staffing hours breakdown

Info Daily nursing hours per resident by staff type, reported to CMS. Higher is generally better — compare this facility to state and national averages to see where staffing stands.

Hours per resident per day — compared to Maryland state averages

Total nursing care / resident Info This home is ranked 89th out of 144 homes in Maryland. Total adjusted nursing hours per resident per day, combining RN, LPN, and aide time. CMS adjusts this for case-mix so facilities can be fairly compared.
3h 15m per day
Rank #89 / 144Nurse hours — State benchmarkedThis home is ranked 89th out of 144 homes in Maryland. Shows adjusted nurse hours per resident per day benchmarked to the Maryland average, with a ranking across 144 Maryland SNFs. More hours mean more direct care. The national average is about 3.5 hrs; below 3.0 is a red flag.Click the rank badge to see the full State ranking.Click here to see the full State ranking.
This facility Maryland avg (3h 46m per day)
vs Maryland avg
-14%
Staff typeHours / Day / Residentvs state avg
Total Nursing (Weekend) Info Combined nursing hours (RN + LPN + Nurse Aide) per resident per day on weekends. Staffing often drops on weekends — this figure reveals whether the facility maintains adequate coverage outside of weekday hours. 3h 49m per day

Types of Care at Park View At Ellicott City

Independent Living

Capacity and availability

This home usually has limited availability

Occupancy between 85% and 95% suggests balanced demand.

Higher occupancy than the Maryland average: 82.4%
Occupancy rate 89% Rank #44 / 145Occupancy rate — State benchmarkedThis home is ranked 44th out of 145 homes in Maryland. Shows this facility's occupancy rate versus the Maryland average, with its Statewide rank out of 145. Higher occupancy signals strong local demand and financial stability.Click the rank badge to see the full State ranking.Click here to see the full State ranking.
Avg. Length of Stay 231 days
Occupancy rate
89% Rank #44 / 145Occupancy rate — State benchmarkedThis home is ranked 44th out of 145 homes in Maryland. Shows this facility's occupancy rate versus the Maryland average, with its Statewide rank out of 145. Higher occupancy signals strong local demand and financial stability.Click the rank badge to see the full State ranking.Click here to see the full State ranking.
Avg. Length of Stay
231 days
Walk Score
Walk Score: 64 / 100 Rank #37 / 147Walk Score — State benchmarkedThis home is ranked 37th out of 147 homes in Maryland. Shows how walkable this facility's neighborhood is compared to the average Walk Score across Maryland SNFs. Higher scores benefit residents, families, and staff.Click the rank badge to see the full State ranking.Click here to see the full State ranking.
Moderately walkable. Some errands can be accomplished on foot, with a mix of nearby amenities.

Contact Park View At Ellicott City

Staffing Data

Reporting period: October 1 – December 31, 2025 (Q4 2025). Source: CMS Payroll-Based Journal report.

Total staff 276
Employees 236
Contractors 40
Staff to resident ratio 1.67:1
7% worse than Maryland average
Maryland average ratio: 1.81:1 Maryland average ratio: 1.81:1See full Maryland ranking
Avg staff/day 111
Average shift 7.9 hours
0% compared with Maryland average
Maryland average: 8 hours Maryland average shift: 8 hoursSee full Maryland ranking
Total staff hours (quarter) 80,962

Nursing staff breakdown

Q4 2025 · Oct 1 – Dec 31 More info This data comes from the CMS Payroll-Based Journal report covering October 1 – December 31, 2025.
Registered Nurse

Manages medical care and health needs.

Total count 60
Average shift length Info Average shift length. Calculated as total hours divided by days worked and average staff per day. 7.8 hours

This role is partially covered by contractors.

Licensed Practical Nurse

Assists with medical care and medications.

Total count 40
Average shift length Info Average shift length. Calculated as total hours divided by days worked and average staff per day. 7.9 hours

No contractors work on this role.

Certified Nursing Assistant

Helps with daily care and mobility.

Total count 86
Average shift length Info Average shift length. Calculated as total hours divided by days worked and average staff per day. 7.7 hours

No contractors work on this role.

Contractor staffing

Q4 2025 · Oct 1 – Dec 31 More info This data comes from the CMS Payroll-Based Journal report covering October 1 – December 31, 2025.

Total hours from contractors

1.9%

1,515 contractor hours this quarter

Registered Nurse: 20 Qualified Activities Professional: 14 Medical Director: 3 Occupational Therapy Assistant: 2 Feeding Assistant: 1

Staff by category

Q4 2025 · Oct 1 – Dec 31 More info This data comes from the CMS Payroll-Based Journal report covering October 1 – December 31, 2025.
Certified Nursing Assistant8608629,57092100%7.7
Licensed Practical Nurse4004013,55692100%7.9
Registered Nurse40206013,54892100%7.8
Qualified Activities Professional2014349,15692100%10.2
Medication Aide/Technician6062,2669098%8.7
Other Dietary Services Staff5051,7709199%7.9
Clinical Nurse Specialist5051,2966470%8
Respiratory Therapy Technician4041,2146773%7.2
Physical Therapy Assistant5051,1617784%6.3
Dental Services Staff2029887582%7.6
Qualified Social Worker8089716773%6.6
Nurse Practitioner2029606470%8
Occupational Therapy Aide3039316470%7.9
Speech Language Pathologist4049176571%6.3
Physical Therapy Aide2028478087%7.2
Mental Health Service Worker1014966267%8
Administrator1014886166%8
Dietitian1014645863%8
Medical Director0331431314%3.7
Feeding Assistant0111401415%10
Occupational Therapy Assistant022691112%6.3
RN Director of Nursing1011222%6
86 Certified Nursing Assistant
% of Days 100%
40 Licensed Practical Nurse
% of Days 100%
60 Registered Nurse
% of Days 100%
34 Qualified Activities Professional
% of Days 100%
6 Medication Aide/Technician
% of Days 98%
5 Other Dietary Services Staff
% of Days 99%
5 Clinical Nurse Specialist
% of Days 70%
4 Respiratory Therapy Technician
% of Days 73%
5 Physical Therapy Assistant
% of Days 84%
2 Dental Services Staff
% of Days 82%
8 Qualified Social Worker
% of Days 73%
2 Nurse Practitioner
% of Days 70%
3 Occupational Therapy Aide
% of Days 70%
4 Speech Language Pathologist
% of Days 71%
2 Physical Therapy Aide
% of Days 87%
1 Mental Health Service Worker
% of Days 67%
1 Administrator
% of Days 66%
1 Dietitian
% of Days 63%
3 Medical Director
% of Days 14%
1 Feeding Assistant
% of Days 15%
2 Occupational Therapy Assistant
% of Days 12%
1 RN Director of Nursing
% of Days 2%

Penalties and fines

Federal penalties imposed by CMS for regulatory violations, including civil money penalties (fines) and denials of payment for new Medicare/Medicaid admissions.

Source: CMS Penalties Database

No penalties in the past 3 years

No civil money penalties or payment denials were reported in the last 3 years.

Quality of care over time

These measures show how residents usually do over time at this home, based on health outcomes and preventive care.

High-risk clinical events score Info A composite score based on pressure ulcers, falls with injury, weight loss, walking ability decline, and activities of daily living decline. 5.0
61% better than Maryland average

Maryland average: 12.9

Functional decline score Info A composite score based on activities of daily living decline, walking ability decline, and incontinence. 3.3
87% better than Maryland average

Maryland average: 25.7

Long-stay resident measures
Need for Help with Daily Activities Increased Info Percent of long-stay residents whose need for help with daily activities has increased 5.2%
78% better than Maryland average

Maryland average: 23.7%

Walking Ability Worsened Info Percent of long-stay residents whose ability to move independently worsened 2.3%
92% better than Maryland average

Maryland average: 27.7%

Low Risk Residents with Bowel/Bladder Incontinence Info Percent of low risk long-stay residents who lose control of their bowels or bladder 2.5%
90% better than Maryland average

Maryland average: 25.9%

Falls with Major Injury Info Percent of long-stay residents experiencing one or more falls with major injury 0.7%
69% better than Maryland average

Maryland average: 2.3%

High Risk Residents with Pressure Ulcers Info Percent of long-stay high risk residents with pressure ulcers 14.3%
119% worse than Maryland average

Maryland average: 6.5%

Urinary Tract Infection Info Percent of long-stay residents with a urinary tract infection 1.6%
In line with Maryland average

Maryland average: 1.6%

Lost Too Much Weight Info Percent of long-stay residents who lose too much weight 2.7%
53% better than Maryland average

Maryland average: 5.8%

Depressive Symptoms Info Percent of long-stay residents who have depressive symptoms 2.9%
86% better than Maryland average

Maryland average: 20.2%

Antipsychotic Use Info Percent of long-stay residents who received an antipsychotic medication 5.8%
55% better than Maryland average

Maryland average: 12.9%

Pneumococcal Vaccine Info Percent of long-stay residents assessed and appropriately given the pneumococcal vaccine 100.0%
9% better than Maryland average

Maryland average: 92.0%

Influenza Vaccine Info Percent of long-stay residents assessed and appropriately given the seasonal influenza vaccine 100.0%
In line with Maryland average

Maryland average: 96.6%

Short-stay resident measures
Pneumococcal Vaccine Info Percent of short-stay residents assessed and appropriately given the pneumococcal vaccine 98.2%
25% better than Maryland average

Maryland average: 78.4%

Antipsychotic medication increase Info Percent of short-stay residents who newly received an antipsychotic medication 0.9%
33% better than Maryland average

Maryland average: 1.4%

Influenza Vaccine Info Percent of short-stay residents assessed and appropriately given the seasonal influenza vaccine 98.4%
22% better than Maryland average

Maryland average: 80.6%

Breakdown by payment type

Medicare

80% of new residents, usually for short-term rehab.

Typical stay 1 - 2 months

Private pay

20% of new residents, often for short stays.

Typical stay 3 years

Facility Characteristics

Source: CMS Long-Term Care Facility Characteristics (Data as of Jan 2026)

Total residents 165
Medicare
17
10.3% of residents
Medicaid
110
66.7% of residents
Private pay or other
38
23% of residents
Programs & Services
Residents Group

Residents meet regularly to discuss policies, care quality, and activities

Nurse Aide Training

State-approved Nurse Aide Training and Competency Evaluation Program on-site

Active Resident Council

Organized group of residents that meets regularly to discuss facility policies, quality of life, and activities.

Finances and operations

Privately-owned community
Operated by a business corporation.
Home revenue
$29.1M
Operating loss
-$71.9K
Privately-owned community Operated by a business corporation.
Home revenue
$29.1M Rank #29 / 145Revenue — State benchmarkedThis home is ranked 29th out of 145 homes in Maryland. Shows this facility's annual revenue compared to the Maryland SNF average. Higher revenue generally means more resources for staffing and capital — read alongside Payroll %.Click the rank badge to see the full State ranking.Click here to see the full State ranking.
Operating loss
-$71.9K
Payroll costs Info The portion of the home's budget spent on staff, including nurses, caregivers, and other employees who support care and operations. Rank #17 / 145Payroll — State benchmarkedThis home is ranked 17th out of 145 homes in Maryland. Shows total annual staff payroll benchmarked to the Maryland average. Higher payroll investment relative to peers often signals better staffing and less reliance on cheaper contract labor.Click the rank badge to see the full State ranking.Click here to see the full State ranking.
$16.0M
54.9% of revenue Rank #22 / 145Payroll % — State benchmarkedThis home is ranked 22nd out of 145 homes in Maryland. Shows payroll as a percentage of revenue versus the Maryland average. Well-run Maryland SNFs typically land around 49–57% — the top third Statewide. Below 25% may signal understaffing or heavy agency use — read with Staffing ratings.Click the rank badge to see the full State ranking.Click here to see the full State ranking.
Other operating costs Info All remaining costs needed to run the home, such as food, utilities, building maintenance, supplies and administrative expenses.
$13.2M
Total costs $29.2M

What does this home offer?

Minimum age icon
Minimum age icon

Minimum Age: 62 Years Old

Pets allowed icon
Pets allowed icon

Pets Allowed

Room sizes icon
Room sizes icon

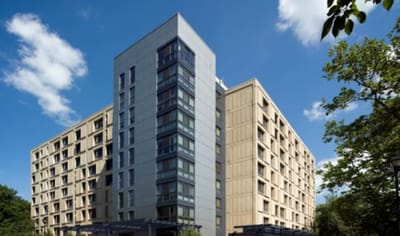
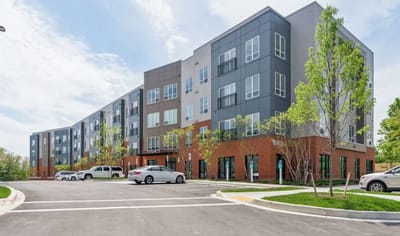
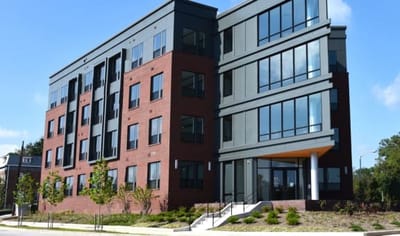
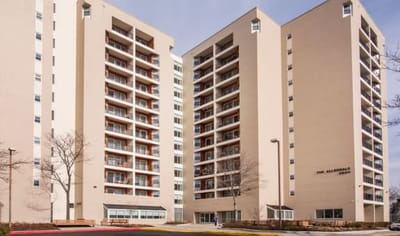
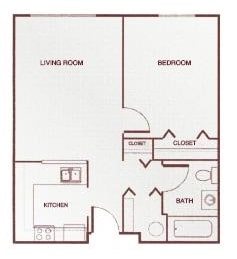
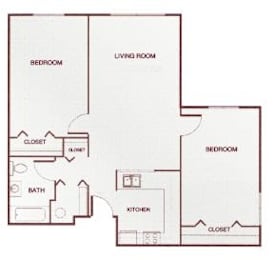
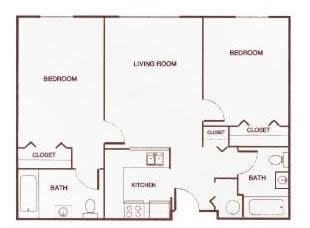
Room Sizes: 562 / 827 / 900 sq. ft

Housing options icon

Housing Options: 1 Bed / 2 Bed

Building type icon
Building type icon

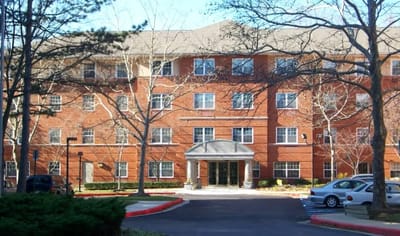
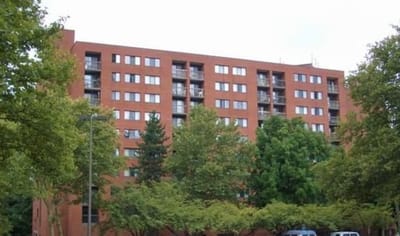
Building Type: Mid-rise

Beauty services icon

Beauty Services

Social and recreational activities icon

Social and Recreational Activities

Exercise program icon

Exercise Programs

Parking Available icon

Parking Available

Who this home usually serves

TYPE OF STAY

Mostly short-term rehab stays

Most residents typically stay for a few weeks or months before returning home or moving on.

Places of interest near Park View At Ellicott City

Address 1.6 miles from city center Info Estimated distance in miles from Ellicott City's city center to Park View At Ellicott City's address, calculated via Google Maps.

Calculate Travel Distance to Park View At Ellicott City

Add your location

Address

Financial Assistance for
Nursing Home in Maryland

Park View At Ellicott City is located in Ellicott City, Maryland.
Here are the financial assistance programs available to residents in Maryland.

Get Financial aid guidance

Community Options Waiver

Maryland Medicaid Community Options Waiver

Age 65+ or disabled
General Maryland resident, Medicaid- eligible, nursing home-level care need.
Income Limits (2025) ~$2,829/month 300% FBR, individual
Asset Limits $2,000 (individual), $3,000 (couple) (excludes home, car).
MD

High urban demand; rural outreach efforts.

Benefits
Personal care (5-7 hours/day, e.g., bathing, dressing) Respite care (up to 240 hours/year) Adult day care ($70/day) Home modifications ($1,500 avg.)

Senior Care Program

Maryland Senior Care

Age 65+
General Maryland resident, at risk of nursing home placement.
Income Limits ~$2,000/month individual, varies by county
Asset Limits $11,000 individual
MD

Limited funding; waitlists common in high-demand areas.

Benefits
In-home care (3-5 hours/week) Respite care (up to 10 days/year) Meals (~$6/meal) Transportation (~5 trips/month) Case management

Maryland Nursing Home Medicaid

Maryland Medical Assistance (Medicaid) Nursing Home Program

Age 65+
General Maryland resident, Medicaid-eligible, requires nursing home-level care.
Income Limits (2025) $943/month (individual); most income applied to care costs.
Asset Limits $2,500 (individual), $3,000 (couple); spousal protections up to $155,356.
MD

Home equity limit $636,000; estate recovery applies post-55.

Benefits
24/7 nursing care Meals Therapy Medications (unlimited per medical need)

Senior Assisted Living Subsidy Program

Maryland Senior Assisted Living Group Home Subsidy

Age 62+
General Maryland resident, in or moving to approved assisted living, low/moderate income.
Income Limits (2025) ~$34,000/year individual, varies by county
Asset Limits Not strict; prioritizes low-income.
MD

Not available statewide; facility must be licensed by MDH.

Benefits
Personal care Meals 24-hour supervision (up to $1,500/month subsidy typical)

Veterans Aid and Attendance (A&A) Benefit

Maryland VA Aid and Attendance

Age
General Wartime veteran/spouse, age 65+ or disabled, needs ADL help, Maryland resident.
Income Limits (2025) Net income minus medical expenses < $1,984/month individual with A&A
Asset Limits $155,356 net worth limit
MD

High veteran population in suburban/rural areas.

Benefits
Cash benefit ($1,478-$2,471/month, varies by status) for care costs

Senior Prescription Drug Assistance Program (SPDAP)

Maryland Senior Prescription Drug Assistance Program

Age 65+
General Maryland resident (6+ months), Medicare Part D enrolled.
Income Limits (2025) $48,560/year individual, 300% FPL
Asset Limits None specified.
MD

Supplements Medicare Part D; annual enrollment required.

Benefits
Up to $40/month premium subsidy Reducing drug costs

Medicare Savings Programs (MSP)

Maryland Medicare Savings Programs

Age 65+
General Maryland resident, Medicare Part A/B enrollee.
Income Limits (2025) $2,014/month (QMB), $2,706/month (SLMB/QI, individual).
Asset Limits $9,090 (individual), $13,630 (couple).
MD

Includes QMB, SLMB, QI categories.

Benefits
Covers premiums (up to $174.70/month Part B) Co-pays Deductibles

Community Personal Assistance Services (CPAS)

Maryland Medicaid Community Personal Assistance Services

Age 65+
General Maryland resident, Medicaid-eligible, needs ADL assistance.
Income Limits (2025) $943/month (individual); spend-down available.
Asset Limits $2,500 (individual), $3,000 (couple).
MD

Consumer-directed option allows hiring family caregivers.

Benefits
Personal care (hours vary, typically 20-30/week) Chores Nurse supervision

Compare Nursing Home around Ellicott City

2 facilities compared · CMS & MD Dept. of Health data

Filter by care type
Lutheran Village at Miller’s Grant
NH

Nursing Home Licensed facility providing 24/7 skilled nursing care for residents with complex, ongoing medical needs. Staffed by RNs, LPNs, and CNAs. Inspected and star-rated annually by CMS. Accepts Medicare (short-term rehab) and Medicaid (long-term care).

IL

Independent Living Lifestyle-focused communities for older adults offering dining, activities, and transportation with minimal personal care. Best for active, independent seniors who want community without medical support.

Ellicott City (Lutheran Village At Miller’s Grant)36 59.5% -28%6.58 -11%+74%$0147.0-9A+ 19 Geary Milliken$30.7M$7.0M22.7%215363
Park View At Ellicott City
NH

Nursing Home Licensed facility providing 24/7 skilled nursing care for residents with complex, ongoing medical needs. Staffed by RNs, LPNs, and CNAs. Inspected and star-rated annually by CMS. Accepts Medicare (short-term rehab) and Medicaid (long-term care).

IL

Independent Living Lifestyle-focused communities for older adults offering dining, activities, and transportation with minimal personal care. Best for active, independent seniors who want community without medical support.

Ellicott City180 89.0% +8%3.26 +64%-14%$0338.3-165- 64 Future Care Health & Management Of Pineview Inc$29.1M$16.0M54.9%215328

Frequently Asked Questions about Park View At Ellicott City

Is Park View At Ellicott City in a walkable area?

Park View At Ellicott City has a walk score of 64. Moderately walkable. Some errands can be accomplished on foot, with a mix of nearby amenities.

What is the address of Park View At Ellicott City?

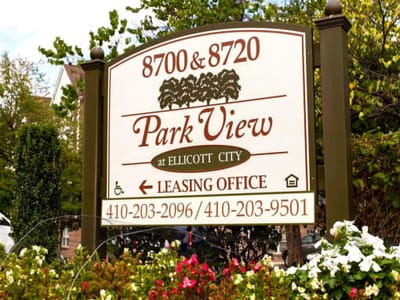
Park View At Ellicott City is located at Park View at, 8720 Ridge Rd, Ellicott City, MD 21043.

What is the phone number of Park View At Ellicott City?

(410) 203-9501 will put you in contact with the team at Park View At Ellicott City.

Is Park View At Ellicott City Medicare or Medicaid certified?

Yes — Park View At Ellicott City is a CMS-certified provider of Medicare and Medicaid.

Guides for Better Senior Living

Care Cost Calculator: See Prices in Your Area

Nursing Home Data Explorer

Don’t Wait Too Long: 7 Red Flag Signs Your Parent Needs Assisted Living Now

The True Cost of Assisted Living in 2025 – And How Families Are Paying For It

Understanding Senior Living Costs: Pricing Models, Discounts & Financial Assistance

Explore Open Rooms
1 Contact details
2 What type of senior care service are you looking for?
3 What budget do you have in mind for senior care?
4 How soon do you need to find care?
5 Additional details

Thank you for your interest!

Our team will be in touch shortly to help with next steps.