Explore Open Rooms
1 Contact details
2 What type of senior care service are you looking for?
3 What budget do you have in mind for senior care?
4 How soon do you need to find care?
5 Additional details

Thank you for your interest!

Our team will be in touch shortly to help with next steps.

Nursing Home in Lockhart

CMS overall rating Info The Overall CMS Rating combines results from health inspections, staffing levels and quality measures. Health inspections carry the most weight. Staffing and quality scores can increase or decrease the final rating based on performance compared to state and national standards.

Parkview Nursing and Rehabilitation Center

Overview of Parkview Nursing and Rehabilitation Center

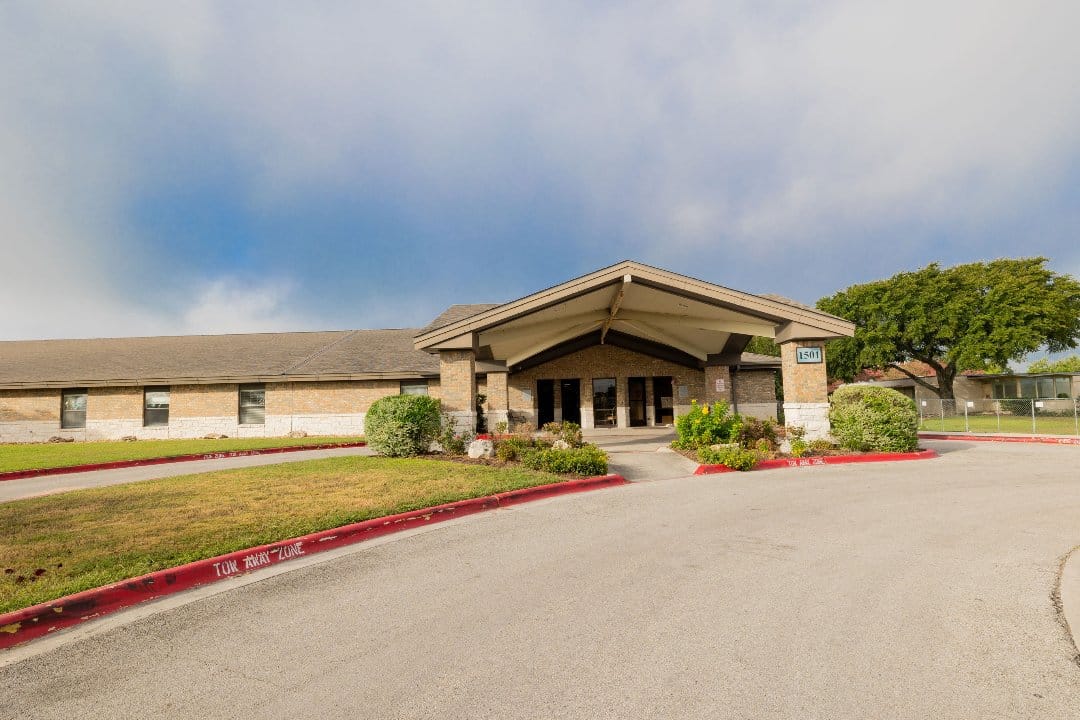
Located in Lockhart, TX, Parkview Nursing and Rehabilitation Center is a skilled nursing facility that focuses on providing compassionate and comfortable care to its residents. The center recognizes the importance of a healing environment and customizes its care and therapy plans to meet the individual needs of each guest. With a holistic approach to healing, Parkview offers skilled nursing, short-term rehabilitation, and long-term care services. The facility’s rehabilitation services include physical, occupational, and speech therapy, catering to a wide range of needs such as post-operative care, stroke recovery, and wound management.

Parkview Nursing and Rehabilitation Center – Lockhart has an average short-term rehabilitation rating and an average long-term care rating. As a medium-sized facility with 108 beds and for-profit, llc ownership, the center prioritizes individualized care plans, social services, and care coordination to ensure the well-being of its residents. During the COVID-19 pandemic, Parkview has taken steps to keep its residents, families, and community informed and safe from the spread of the virus, demonstrating its commitment to providing a safe and supportive environment for all.

(270) 443-6543

Managed by Eric Toma

Administrator

Eric Toma serves as the Administrator at Parkview Nursing and Rehabilitation Center, leading a team dedicated to personalized care and holistic healing. Under his leadership, the community focuses on customized therapy plans and maintaining a safe environment, especially during the COVID-19 pandemic, ensuring residents and families are well-informed and supported.

Quality ratings

Measured by Centers for Medicare & Medicaid Services (CMS)

Overall rating Info The Overall CMS Rating combines results from health inspections, staffing levels and quality measures. Health inspections carry the most weight. Staffing and quality scores can increase or decrease the final rating based on performance compared to state and national standards.
2/5
Texas average: 3.0/5
Health Inspection Info Based on the results of the facility's three most recent standard inspections and any complaint investigations. CMS reviews the number, scope, and severity of deficiencies, with more recent findings weighted more heavily.
3/5
Texas average: 2.9/5
Staffing Info Measures average nursing staff hours per resident per day, including Registered Nurses (RNs) and total nursing staff. Ratings are adjusted based on the level of care residents require and are compared to state and national benchmarks.
1/5
Texas average: 2.4/5
Quality Measures Info Based on clinical and physical health indicators reported to CMS, such as hospital readmissions, falls, pressure ulcers, and improvements in mobility. These measures reflect how well residents' health needs are being managed.
4/5
Texas average: 4.0/5

Nursing care per resident

Info This shows how many total hours of nursing staff time are available per resident each day. Higher numbers usually mean more staff support.
2h 53m per day

This home provides 24% less nursing time per resident than the Texas average.

Texas average: 3h 47m per day

Staffing hours breakdown

Info Hours of care per resident per day, broken down by staff type. Data from CMS Medicare.
Staff type Facility State avg National avg
Registered Nurse (RN) Info Registered nurse hours per resident per day. 32m per day 26m per day 41m per day
Nurse Aide Info Nurse aide hours per resident per day. 1h 48m per day 2h 1m per day 2h 21m per day
Total Nursing (Weekend) Info Total number of nurse staff hours per resident per day on weekends. 2h 25m per day 2h 59m per day 3h 26m per day
Physical Therapist Info Physical therapist staff hours per resident per day. 7m per day 4m per day 4m per day
RN (Weekend) Info Registered nurse hours per resident per day on weekends. 12m per day 21m per day 29m per day

Capacity and availability

Medium-capacity home

Offers a balance of services and community atmosphere.

Total beds 118

This home usually has availability

Lower occupancy suggests more openings may be available.

Lower demand than the Texas average
Occupancy rate 55.7%
Residents per day (avg) 84
Occupancy rate
55.7%
Residents per day (avg)
84

Who this home usually serves

TYPE OF STAY

Mostly short-term rehab stays

Most residents typically stay for a few weeks or months before returning home or moving on.

Might be optimal for
Short stays Recovery Medicare-covered care

Breakdown by payment type

Medicare

42% of new residents, usually for short-term rehab.

Typical stay 2 - 3 months

Private pay

41% of new residents, often for short stays.

Typical stay 6 - 7 months

Medicaid

17% of new residents, often for long-term daily care.

Typical stay 3 - 4 years

Finances and operations

Governmental community
Operated by state authorities.
Home revenue
$7.4M
Surplus of revenue
$0
Governmental community Operated by state authorities.
Home revenue
$7.4M
Surplus of revenue
$0
Payroll costs Info The portion of the home's budget spent on staff, including nurses, caregivers, and other employees who support care and operations.
$1
0% of revenue
Other operating costs Info All remaining costs needed to run the home, such as food, utilities, building maintenance, supplies and administrative expenses.
$7.4M
Total costs $7.4M
Bed community size
118-bed community
A larger shared setting that may offer more common spaces and organized community services.
Years in operation
53 years in operation
A longer operating history, which may indicate experience navigating regulations and delivering ongoing care.
Walk Score
Walk Score: 43 / 100
Somewhat walkable. A few nearby services may be reachable on foot, but most trips require transportation.

Services

Medicare/medicaid

About this community

License Details

Facility TypeNursing
StatusActive
IssuanceJanuary 6, 2025
ExpirationJanuary 6, 2028
CountyCALDWELL

Additional Licensing Details

License Number308641
Year Opened9/1/1972

Ownership & Operating Entity

Parkview Nursing and Rehabilitation Center is administrated by Sandra K Lantz.

Management CompanyLOCKHART NURSING AND REHAB CENTER LLC
OwnerMAVERICK COUNTY HOSPITAL BOARD
Ownership TypeHOSPITAL DISTRICT/AUTHORITY

Type Of Units

Medicare
2 units
Medicaid and Medicare
106 units
Total beds
118 units

Staffing

Key information about the people who lead and staff this community.

Leadership

Payment & Insurance

2 services
Accept Medicaid
Accept Medicare

Therapy & Rehabilitation

2 services
Rehabilitation Services
Short-Term Rehab

Staffing & Medical

2 services
Skilled Nursing
24-Hour Staffing

Additional Services

2 services
Rehabilitation Therapy
Long & Short Term Care

Amenities & Lifestyle

3 amenities
Licensed Professional Staff
Social Activities
And Other Specialized Services
Specific ProgramsSkilled Nursing, Rehabilitation Therapy, Long & Short Term Care, 24-hour licensed nursing care, Fall Recovery and Prevention skills, Medical Management, Physical Therapy, Occupational Therapy, Speech Therapy, Respiratory Therapy, Post Operative Rehab, Stroke Recovery, Cardiac Care, Prosthetics and Orthotics, Wound Care, Tracheostomy Care, Pain Management, Disease Management, Incontinence Management, Advanced Therapy Modalities, Nutrition & Hydration Management, Assistance with Activities of Daily Living

Pricing & Financial Information

What does this home offer?

Accepts Medicaid icon

Accept Medicaid: Yes

Building type icon
Building type icon

Building Type: Single-story

Care cost icon
Care cost icon

Care Cost

Types of Care at Parkview Nursing and Rehabilitation Center

Nursing Home

Access & Eligibility

Ways to qualify for care at this community, including accepted programs and payment options.

Medicaid Accepted

This facility is certified for eligible Medicaid services.

Medicare Accepted

This facility is certified for eligible Medicare services.

Payment & Funding Options

Medicaid Medicare Long-term care insurance

Inspection History

In Texas, the Health and Human Services Commission (HHSC) is the primary regulatory body that conducts unannounced inspections and publishes quality reports for all long-term care homes.

12 visits/inspections

Latest inspection

Date November 20, 2025
Complaint Investigation

22 deficiencies

Deficiencies indicate regulatory issues. A higher number implies the facility had several areas requiring improvement.

Texas average: 32 deficiencies

Inspection Report Summary for Parkview Nursing and Rehabilitation Center

The most recent inspection on November 20, 2025, found deficiencies related to failure to protect a resident from physical abuse by another resident and inadequate supervision to prevent accidents, which the facility corrected before the survey. Earlier inspections showed a pattern of issues including care planning, medication management, food safety, resident supervision, and confidentiality breaches. Complaint investigations substantiated failures in abuse prevention, discharge notification, medication administration, and timely laboratory services, but enforcement actions such as fines or license suspensions were not listed in the available reports. Most complaints were substantiated, with notable cases involving resident-to-resident abuse and delayed medication or lab services. The inspection history indicates ongoing challenges with resident safety and care processes, with corrective actions taken promptly after deficiencies were identified.

Health Inspection History

Inspections
Total health inspections 9

Texas average 7.4


Last Health inspection on May 2025

Total health citations 18

Texas average 25.9

Citations per inspection
2

Texas average 3.67


Health citations are formal notices following inspections when they fail to comply with safety and care standards.

10 of 18 citations resulted from standard inspections; 7 of 18 resulted from complaint investigations; and 1 of 18 came from combined inspections (standard and complaint).

Breakdown of citation severity (last 3 years)
Critical Health citations More info 1
50% better than Texas average

Texas average: 2


Serious Health citations More info 1
150% worse than Texas average

Texas average: 0.4

1 critical citation More info Texas average: 2

1 serious citation More info Texas average: 0.4

16 moderate citations More info Texas average: 23

0 minor citations More info Texas average: 0.4
Citations history (last 3 years)
Quality of Care critical citation Info Issues related to how well residents receive appropriate treatment and support for their medical and daily care needs. May 07, 2025
Corrected

Resident Rights moderate citation Info Issues related to resident's rights, including dignity, privacy, and the ability to make decisions about their care. Mar 03, 2025
Corrected

Nutrition moderate citation Info Issues related to food quality, meal service, and resident's nutritional needs. Jul 31, 2024
Corrected

Administration moderate citation Info Issues related to how the facility is managed, including policies, procedures, and compliance with regulations. Jun 27, 2024
Corrected

Compare Nursing Homes around Lockhart The information below is reported by the Texas Health and Human Services Commission.

1 facility compared · CMS & TX Dept. of Health data · Updated Apr 2026

Filter by care type
Parkview Nursing and Rehabilitation Center
NH

Nursing Home Licensed facility providing 24/7 skilled nursing care for residents with complex, ongoing medical needs. Staffed by RNs, LPNs, and CNAs. Inspected and star-rated annually by CMS. Accepts Medicare (short-term rehab) and Medicaid (long-term care).

Lockhart
108
55.7%
-12%
2.88
-23%
-21%
2
18
2.0
2
84
-
43
Lockhart Nursing And Rehab Center Llc
$7.0M
$0.0M
0%
675458

Places of interest near Parkview Nursing and Rehabilitation Center

Address 1.3 miles from city center — 14.75 miles to nearest hospital (Ascension Seton Hays)

Calculate Travel Distance to Parkview Nursing and Rehabilitation Center

Add your location

Address

Staffing Data (Q2 2025)

This data corresponds to Q2 2025 and is based on CMS Payroll-Based Journal.

Total staff 121
Employees 92
Contractors 29
Staff to resident ratio 1.98:1
32% better than Texas average

Texas average ratio: 1.51:1

Avg staff/day 39
Average shift 8.2 hours
0% compared with Texas average

Texas average: 8.1 hours

Total staff hours (quarter) 29,125
Nursing staff breakdown
Registered Nurse

Manages medical care and health needs.

Total count 7
Average shift length Info Average shift length. Calculated as total hours divided by days worked and average staff per day. 9.4 hours

This role is partially covered by contractors.

Licensed Practical Nurse

Assists with medical care and medications.

Total count 43
Average shift length Info Average shift length. Calculated as total hours divided by days worked and average staff per day. 9.1 hours

This role is partially covered by contractors.

Certified Nursing Assistant

Helps with daily care and mobility.

Total count 28
Average shift length Info Average shift length. Calculated as total hours divided by days worked and average staff per day. 8.1 hours

No contractors work on this role.

Contractor staffing

Total hours from contractors

3.4%

987 contractor hours this quarter

Licensed Practical Nurse: 25 Speech Language Pathologist: 1 Registered Nurse: 1 Occupational Therapy Assistant: 1 Physical Therapy Assistant: 1
Staff by category
Certified Nursing Assistant2802810,04591100%8.1
Licensed Practical Nurse1825434,38491100%9.1
Medication Aide/Technician9093,64991100%10.6
Physical Therapy Aide100102,2787886%7.1
Registered Nurse6171,96791100%9.4
Speech Language Pathologist4151,6986976%7.1
Respiratory Therapy Technician4041,5016673%7.4
Clinical Nurse Specialist3031,0326470%8
Qualified Social Worker4045477684%3.4
Administrator1015126470%8
Nurse Practitioner1015126470%8
Other Dietary Services Staff1014856167%8
Mental Health Service Worker1013123943%8
Physical Therapy Assistant0111181618%7.4
Occupational Therapy Aide10164910%7.1
Other Physician1011333%4.2
Occupational Therapy Assistant0111022%5
28 Certified Nursing Assistant
% of Days 100%
43 Licensed Practical Nurse
% of Days 100%
9 Medication Aide/Technician
% of Days 100%
10 Physical Therapy Aide
% of Days 86%
7 Registered Nurse
% of Days 100%
5 Speech Language Pathologist
% of Days 76%
4 Respiratory Therapy Technician
% of Days 73%
3 Clinical Nurse Specialist
% of Days 70%
4 Qualified Social Worker
% of Days 84%
1 Administrator
% of Days 70%
1 Nurse Practitioner
% of Days 70%
1 Other Dietary Services Staff
% of Days 67%
1 Mental Health Service Worker
% of Days 43%
1 Physical Therapy Assistant
% of Days 18%
1 Occupational Therapy Aide
% of Days 10%
1 Other Physician
% of Days 3%
1 Occupational Therapy Assistant
% of Days 2%

Facility Characteristics

Source: CMS Long-Term Care Facility Characteristics (Data as of Jan 2026)

Total census
61 residents
Residents by payment source
Medicare
4 residents (6.6%)
Medicaid
57 residents (93.4%)
Programs & Services
Residents' Group

Residents meet regularly to discuss policies, care quality, and activities

Nurse Aide Training

State-approved Nurse Aide Training and Competency Evaluation Program on-site

Active Resident Council

Organized group of residents that meets regularly to discuss facility policies, quality of life, and activities.

Quality of care over time

These measures show how residents usually do over time at this home, based on health outcomes and preventive care.

High-risk clinical events score Info A composite score based on pressure ulcers, falls with injury, weight loss, walking ability decline, and activities of daily living decline. 9.5
10% worse than Texas average

Texas average: 8.6

Functional decline score Info A composite score based on activities of daily living decline, walking ability decline, and incontinence. 19.0
19% worse than Texas average

Texas average: 16.0

Long-stay resident measures
Above average Texas avg: 4.2 Info CMS star rating based on long-stay quality measure performance. 5 stars = significantly above average, 1 star = significantly below average.
Need for Help with Daily Activities Increased Info Percent of long-stay residents whose need for help with daily activities has increased 20.4%
26% worse than Texas average

Texas average: 16.2%

Walking Ability Worsened Info Percent of long-stay residents whose ability to move independently worsened 12.0%
26% better than Texas average

Texas average: 16.2%

Low Risk Residents with Bowel/Bladder Incontinence Info Percent of low risk long-stay residents who lose control of their bowels or bladder 24.7%
58% worse than Texas average

Texas average: 15.7%

Falls with Major Injury Info Percent of long-stay residents experiencing one or more falls with major injury 3.9%
21% worse than Texas average

Texas average: 3.2%

High Risk Residents with Pressure Ulcers Info Percent of long-stay high risk residents with pressure ulcers 3.8%
14% better than Texas average

Texas average: 4.4%

Urinary Tract Infection Info Percent of long-stay residents with a urinary tract infection 2.0%
152% worse than Texas average

Texas average: 0.8%

Lost Too Much Weight Info Percent of long-stay residents who lose too much weight 7.3%
110% worse than Texas average

Texas average: 3.5%

Depressive Symptoms Info Percent of long-stay residents who have depressive symptoms 5.5%
93% worse than Texas average

Texas average: 2.9%

Antipsychotic Use Info Percent of long-stay residents who received an antipsychotic medication 3.6%
54% better than Texas average

Texas average: 7.9%

Pneumococcal Vaccine Info Percent of long-stay residents assessed and appropriately given the pneumococcal vaccine 98.4%
In line with Texas average

Texas average: 97.3%

Influenza Vaccine Info Percent of long-stay residents assessed and appropriately given the seasonal influenza vaccine 100.0%
In line with Texas average

Texas average: 97.9%

Hospitalizations per 1,000 days Info Number of hospitalizations per 1,000 long-stay resident days. 2.44
15% worse than Texas average

Texas average: 2.13

ED visits per 1,000 days Info Number of outpatient emergency department visits per 1,000 long-stay resident days. 1.81
13% better than Texas average

Texas average: 2.07

Short-stay resident measures
Above average Texas avg: 2.9 Info CMS star rating based on short-stay quality measure performance. 5 stars = much above average, 1 star = much below average.
Pneumococcal Vaccine Info Percent of short-stay residents assessed and appropriately given the pneumococcal vaccine 89.2%
In line with Texas average

Texas average: 90.4%

Antipsychotic medication increase Info Percent of short-stay residents who newly received an antipsychotic medication 0.8%
46% better than Texas average

Texas average: 1.4%

Influenza Vaccine Info Percent of short-stay residents assessed and appropriately given the seasonal influenza vaccine 96.8%
10% better than Texas average

Texas average: 88.0%

Re-hospitalized after SNF stay Info Percentage of short-stay residents who were re-hospitalized after their nursing home admission. 13.6%
47% better than Texas average

Texas average: 25.9%

Emergency department visits Info Percentage of short-stay residents who had an outpatient emergency department visit. 3.3%
73% better than Texas average

Texas average: 12.0%

Falls with major injury Info Percentage of SNF residents who experience falls with major injury during their stay. 0.0%
100% better than Texas average

Texas average: 0.8%

Ability to care for self at discharge Info Percentage of residents at or above expected ability to care for themselves at discharge. 24.2%
55% worse than Texas average

Texas average: 53.7%

Successful return to home or community Info Rate of successful return to home or community from a skilled nursing facility. 47.3%
7% worse than Texas average

Texas average: 50.6%

Penalties and fines

Federal penalties imposed by CMS for regulatory violations, including civil money penalties (fines) and denials of payment for new Medicare/Medicaid admissions.

Source: CMS Penalties Database (Data as of Jan 2026)

Total fines amount $40K
50% lower than Texas average

Texas average: $80K

Number of fines 2
20% fewer fines than Texas average

Texas average: 2.5

Payment Denials Info Serious action where Medicare and/or Medicaid temporarily stops payments for new residents until issues are fixed. 0
100% fewer payment denials than Texas average

Texas average: 0.2

Fines amount comparison
This facility $40K
Texas average $80K
Penalty History

Penalties are imposed by CMS for violations of federal nursing home regulations.

Civil Money Penalty Info Fines imposed for noncompliance, which can be assessed per day or per instance of violation. May 7, 2025
$10K
Civil Money Penalty Info Fines imposed for noncompliance, which can be assessed per day or per instance of violation. Feb 5, 2024
$30K

Last updated: Jan 2026

Guides for Better Senior Living

Care Cost Calculator: See Prices in Your Area

Nursing Home Data Explorer

Don’t Wait Too Long: 7 Red Flag Signs Your Parent Needs Assisted Living Now

The True Cost of Assisted Living in 2025 – And How Families Are Paying For It

Understanding Senior Living Costs: Pricing Models, Discounts & Financial Assistance

Financial Aid for Texas Seniors

Get financial aid guidance

Community Care for the Aged and Disabled (CCAD)

TX Medicaid CCAD

Age 65+ or disabled, Texas resident, Medicaid-eligible, care need (not always nursing home level).

~$2,829/month (300% FBR, individual).

$2,000 (individual), $3,000 (couple).

Large state; rural access challenges.

Texas Community Care Services

TX CCS

Age 60+, Texas resident, at risk of decline.

~$2,000/month (individual, varies).

$5,000 (individual).

Limited funding; high demand in urban areas.

Area Agency on Aging (AAA) Services

Texas AAA Services

Age 60+, TX resident; no income/asset limits.

None; donations encouraged.

Not assessed.

28 AAAs; includes Meals on Wheels in some areas.

Medicare Savings Program (MSP)

Texas Medicare Savings Program

Age 65+ or disabled, TX resident, Medicare Part A/B.

~$2,510/month (QMB), ~$3,380/month (SLMB), ~$3,598/month (QI)—individual.

$9,430 (individual), $14,130 (couple).

Includes Extra Help for Part D; no waitlist.

Low-Income Home Energy Assistance Program (LIHEAP)

Texas Comprehensive Energy Assistance Program (CEAP)

Age 60+ prioritized, TX resident, low-income.

~$3,970/month (185% FPL).

Not assessed.

Priority for elderly/disabled; covers gas, electric, propane.

Family Caregiver Support Program (FCSP)

Texas Family Caregiver Support Program

Caregivers of 60+ needing care or 55+ caregivers of others; TX resident; 2+ ADLs.

No strict cap; prioritizes low-income (~$24,980/year).

Not assessed.

High rural demand; includes grandparent caregivers.

Senior Community Service Employment Program (SCSEP)

Texas SCSEP

Age 55+, unemployed, low-income, TX resident.

~$1,983/month (125% FPL).

Not specified.

Priority for veterans, rural residents; AARP partnership.

VA Aid and Attendance (A&A) and Housebound Benefits

Texas VA Aid and Attendance/Housebound

Age 65+ or disabled veteran/spouse, TX resident, wartime service, ADL help (A&A) or homebound.

Net income < ~$1,984/month (veteran with dependent, A&A); pension offsets income.

~$155,356 (net worth).

High veteran population; supports rural/urban needs.

Property Tax Exemption for Seniors

Texas Senior Property Tax Exemption

Age 65+, TX resident, homeowner (homestead).

None; tax-based eligibility.

Not assessed.

$25,000+ exemption; optional freeze in some counties; saves ~$500-$1,000/year.

Senior Farmers’ Market Nutrition Program (SFMNP)

Texas SFMNP

Age 60+, TX resident, low-income.

~$2,322/month (185% FPL).

Not assessed.

Vouchers (~$50/season); serves ~20,000 via 28 AAAs.