Explore Open Rooms

1 Contact details
2 What type of senior care service are you looking for?
3 What budget do you have in mind for senior care?
4 How soon do you need to find care?
5 Additional details

Thank you for your interest!

Our team will be in touch shortly to help with next steps.

Nursing Home in Chicago

CMS overall rating Info The Overall CMS Rating combines results from health inspections, staffing levels and quality measures. Health inspections carry the most weight. Staffing and quality scores can increase or decrease the final rating based on performance compared to state and national standards.

Paul House and Healthcare Center

3800 N California Ave, Chicago, IL 60618 View map
Overview of Paul House and Healthcare Center

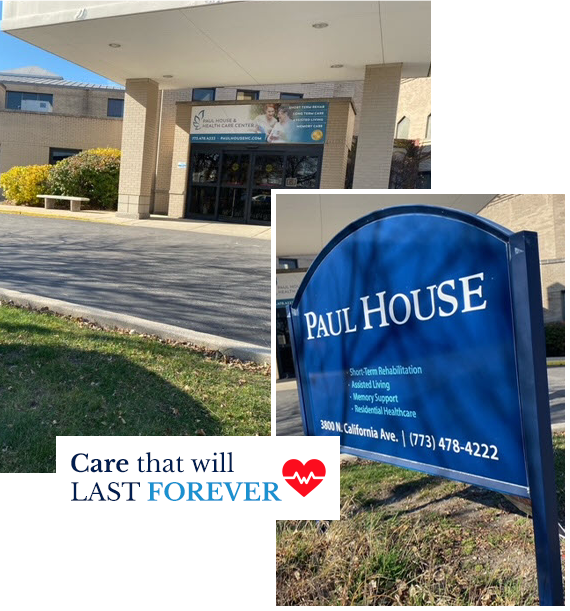
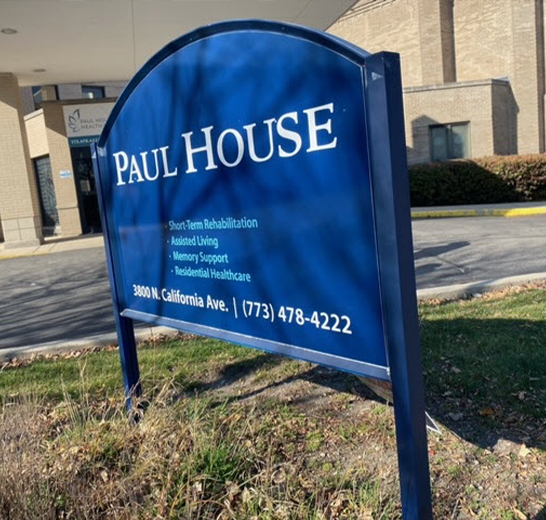
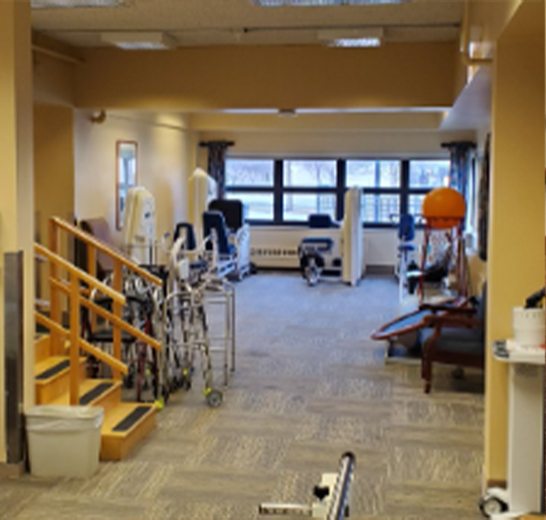
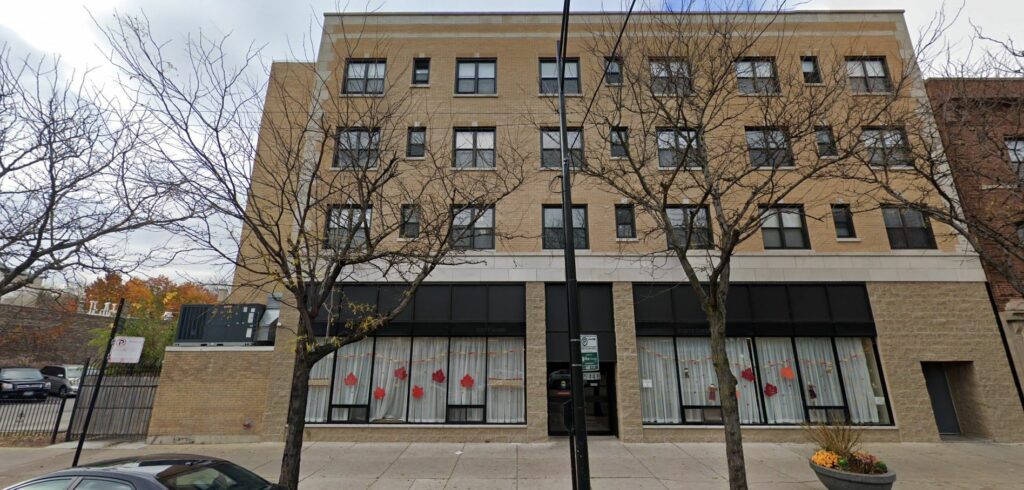
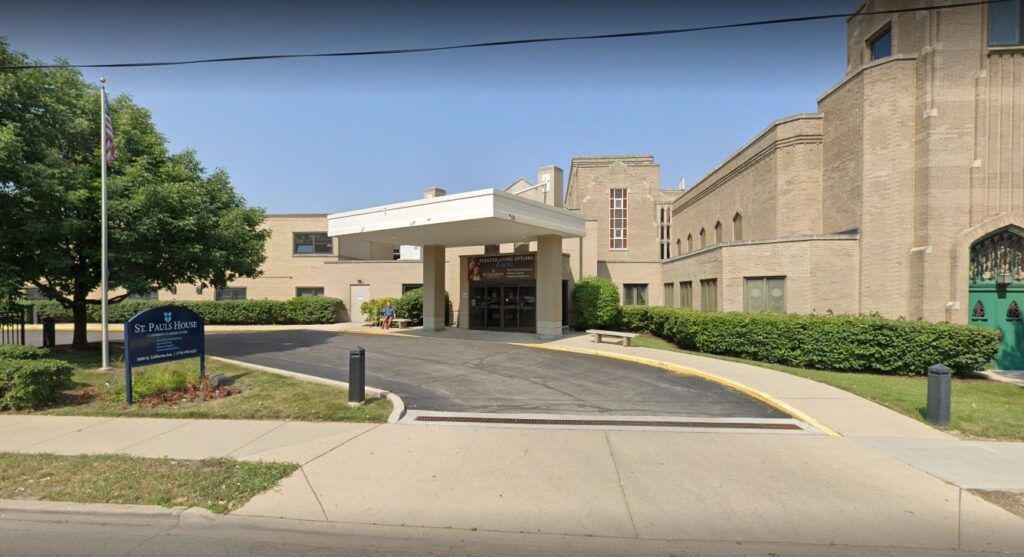
Paul House and Health Care Center is located in the charming Irving Park area on the northside of Chicago. This healthcare center has been providing top-quality services for over a century to those in need. Their range of services includes post-acute rehabilitation, long-term skilled nursing, assisted living, memory care, and respite care. The staff at Paul House and Health Care Center work in harmony to ensure that the residents receive the utmost care and attention.

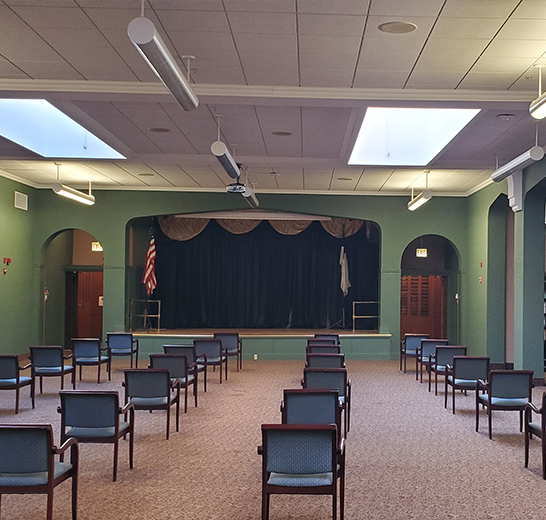
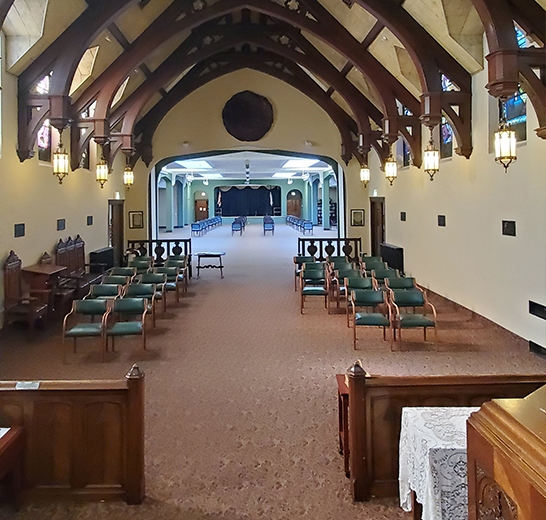
The atmosphere at this healthcare center is active and lively, with social groups and a pleasant environment. They have a steady flow of competitive volunteers and provide 24-hour assistance to their residents. Moreover, this home boasts exceptional housekeeping, amazing cuisine, good communication among the team, and studio to one-bedroom apartments. They provide monthly outings, an on-site salon, activity spaces, library, and restaurant-style meals. It is amazing how they encourage the freedom of its residents to follow their interests and passions. No wonder why they have stood the test of time and continue to be a cherished institution in one of the largest cities in the US. 

(773) 478-4222

Quality ratings

Measured by Centers for Medicare & Medicaid Services (CMS)

Overall rating Info The Overall CMS Rating combines results from health inspections, staffing levels and quality measures. Health inspections carry the most weight. Staffing and quality scores can increase or decrease the final rating based on performance compared to state and national standards.
1/5
Illinois average: 2.5/5
Health Inspection Info Based on the results of the facility's three most recent standard inspections and any complaint investigations. CMS reviews the number, scope, and severity of deficiencies, with more recent findings weighted more heavily.
1/5
Illinois average: 2.8/5
Staffing Info Measures average nursing staff hours per resident per day, including Registered Nurses (RNs) and total nursing staff. Ratings are adjusted based on the level of care residents require and are compared to state and national benchmarks.
1/5
Illinois average: 2.1/5
Quality Measures Info Based on clinical and physical health indicators reported to CMS, such as hospital readmissions, falls, pressure ulcers, and improvements in mobility. These measures reflect how well residents' health needs are being managed.
2/5
Illinois average: 2.8/5

Nursing care per resident

Info This shows how many total hours of nursing staff time are available per resident each day. Higher numbers usually mean more staff support.
2h 42m per day

This home provides 13% less nursing time per resident than the Illinois average.

Illinois average: 3h 6m per day

Staffing hours breakdown

Info Hours of care per resident per day, broken down by staff type. Data from CMS Medicare.
Staff type Facility State avg National avg
Registered Nurse (RN) Info Registered nurse hours per resident per day. 25m per day 44m per day 41m per day
Nurse Aide Info Nurse aide hours per resident per day. 2h 19m per day 2h 8m per day 2h 21m per day
Total Nursing (Weekend) Info Total number of nurse staff hours per resident per day on weekends. 3h 28m per day 3h 5m per day 3h 26m per day
Physical Therapist Info Physical therapist staff hours per resident per day. 3m per day 3m per day 4m per day
RN (Weekend) Info Registered nurse hours per resident per day on weekends. 20m per day 34m per day 29m per day

Capacity and availability

Medium-capacity home

Offers a balance of services and community atmosphere.

Total beds 110

This home usually has limited availability

Occupancy is moderate, suggesting balanced demand.

Similar demand to the Illinois average
Occupancy rate 89.5%
Residents per day (avg) 98
Occupancy rate
89.5%
Residents per day (avg)
98

Who this home usually serves

TYPE OF STAY

Mostly long-term care residents

Most residents stay for extended periods and receive ongoing daily care.

Might be optimal for
Long-term daily care Ongoing support needs

Breakdown by payment type

Medicare

46% of new residents, usually for short-term rehab.

Typical stay 10 - 11 months

Medicaid

54% of new residents, often for long-term daily care.

Typical stay 1 - 2 months

Finances and operations

Privately-owned community
Operated by a business corporation.
Home revenue
$12.4M
Operating loss
-$24.9M
Privately-owned community Operated by a business corporation.
Home revenue
$12,362,369.00
Operating loss
$-24,860,723.00
Payroll costs Info The portion of the home's budget spent on staff, including nurses, caregivers, and other employees who support care and operations.
$3.7M
30% of revenue
Other operating costs Info All remaining costs needed to run the home, such as food, utilities, building maintenance, supplies and administrative expenses.
$21.1M
Total costs $24.9M
Walk Score
Walk Score: 78 / 100
Very walkable. Most errands can be accomplished on foot, and many essentials are within a short walk.

About this community

Therapy & Rehabilitation

2 services
Rehabilitation Services
Respite Care

Staffing & Medical

3 services
Doctor on Staff
Skilled Nursing
24-Hour Staffing

Amenities & Lifestyle

0 amenities
Specific ProgramsAssisted Living, Memory Care, Long Term Skilled Nursing, Post Acute Rehabilitation, Respite Care, Palliative Care and Hospice
Volunteer ProgramsYes

Dining & Nutrition

Food DescriptionExcellent cuisine provided.

Types of Care at Paul House and Healthcare Center

Assisted Living Memory Care Skilled Nursing Respite Care
Contact Paul House and Healthcare Center

Health Inspection History

Inspections
Total health inspections 10

Illinois average 10.4


Last Health inspection on Jun 2025

Total health citations 61

Illinois average 36.8

Citations per inspection
6.1

Illinois average 3.68


Health citations are formal notices following inspections when they fail to comply with safety and care standards.

49 of 61 citations resulted from standard inspections; and 12 of 61 resulted from complaint investigations.

Breakdown of citation severity (last 3 years)
Critical Health citations More info 0
100% better than Illinois average

Illinois average: 0.7


Serious Health citations More info 4
11% worse than Illinois average

Illinois average: 3.6

0 critical citations More info Illinois average: 0.7

4 serious citations More info Illinois average: 3.6

57 moderate citations More info Illinois average: 32

0 minor citations More info Illinois average: 0.5
Citations history (last 3 years)
Administration moderate citation Info Issues related to how the facility is managed, including policies, procedures, and compliance with regulations. Jun 05, 2025
Corrected

Administration moderate citation Info Issues related to how the facility is managed, including policies, procedures, and compliance with regulations. Jun 05, 2025
Corrected

Administration moderate citation Info Issues related to how the facility is managed, including policies, procedures, and compliance with regulations. Jun 05, 2025
Corrected

Administration moderate citation Info Issues related to how the facility is managed, including policies, procedures, and compliance with regulations. Jun 05, 2025
Corrected

Compare Nursing Homes around Chicago The information below is reported by the Illinois Department of Public Health, Office of Health Care Regulation.

5 facilities compared · CMS & IL Dept. of Health data · Updated Apr 2026

Filter by care type
Astoria Place
NH

Nursing Home Licensed facility providing 24/7 skilled nursing care for residents with complex, ongoing medical needs. Staffed by RNs, LPNs, and CNAs. Inspected and star-rated annually by CMS. Accepts Medicare (short-term rehab) and Medicaid (long-term care).

Chicago (West Ridge)
164
90.1%
+30%
2.37
+35%
-23%
1
31
3.1
2
149
92
Davis, Patricia
$23.3M
$5.2M
22.1%
145634
All American Village Nursing and Rehabilitation Center
NH

Nursing Home Licensed facility providing 24/7 skilled nursing care for residents with complex, ongoing medical needs. Staffed by RNs, LPNs, and CNAs. Inspected and star-rated annually by CMS. Accepts Medicare (short-term rehab) and Medicaid (long-term care).

Chicago (Edgewater)
145
95.2%
+37%
1.51
-64%
-51%
0
32
3.2
0
138
95
-
$10.5M
$5.5M
52.6%
146198
Avantara Evergreen Park
NH

Nursing Home Licensed facility providing 24/7 skilled nursing care for residents with complex, ongoing medical needs. Staffed by RNs, LPNs, and CNAs. Inspected and star-rated annually by CMS. Accepts Medicare (short-term rehab) and Medicaid (long-term care).

Evergreen Park
242
61.6%
-11%
2.67
+71%
-14%
7
65
3.4
13
174
67
Berger, Menachem
$35.1M
$6.1M
17.5%
145734
Paul House and Healthcare Center
AL

Assisted Living A licensed, long-term care setting for seniors or individuals with disabilities who need help with daily activities — like bathing, dressing, and medication management — but not 24-hour skilled nursing. Offers housing, meals, and around-the-clock support while aiming to maximize resident independence.

MC

Memory Care Secured, specialized care for people living with Alzheimer's or dementia. Staff trained in cognitive impairment, with higher staff-to-resident ratios and an environment designed to reduce confusion and wandering risk.

NH

Nursing Home Licensed facility providing 24/7 skilled nursing care for residents with complex, ongoing medical needs. Staffed by RNs, LPNs, and CNAs. Inspected and star-rated annually by CMS. Accepts Medicare (short-term rehab) and Medicaid (long-term care).

RC

Respite Care Short-term temporary care — days to weeks — to give family caregivers a break. Full care provided during the stay. Often used after hospitalization or to trial a facility before a permanent placement decision.

Chicago (Irving Park)
110
89.5%
+29%
2.70
-41%
-13%
1
61
6.1
4
98
78
Mermelstein, Jacob
$12.4M
$3.7M
30%
145767
Buckingham Pavilion Nursing and Rehabilitation
-
AL

Assisted Living A licensed, long-term care setting for seniors or individuals with disabilities who need help with daily activities — like bathing, dressing, and medication management — but not 24-hour skilled nursing. Offers housing, meals, and around-the-clock support while aiming to maximize resident independence.

IL

Independent Living Lifestyle-focused communities for older adults offering dining, activities, and transportation with minimal personal care. Best for active, independent seniors who want community without medical support.

MC

Memory Care Secured, specialized care for people living with Alzheimer's or dementia. Staff trained in cognitive impairment, with higher staff-to-resident ratios and an environment designed to reduce confusion and wandering risk.

NH

Nursing Home Licensed facility providing 24/7 skilled nursing care for residents with complex, ongoing medical needs. Staffed by RNs, LPNs, and CNAs. Inspected and star-rated annually by CMS. Accepts Medicare (short-term rehab) and Medicaid (long-term care).

Chicago (West Ridge)
235
-
-
-
-
-
-
-
-
0
0
0.0
0
-
83
-
-
-
-
-

Places of interest near Paul House and Healthcare Center

Address 7.3 miles from city center — 3.37 miles to nearest hospital (Ascension Saint Joseph - Chicago)

Address 3800 N California Ave, Chicago, IL 60618

Calculate Travel Distance to Paul House and Healthcare Center

Add your location

Address

Staffing Data (Q2 2025)

This data corresponds to Q2 2025 and is based on CMS Payroll-Based Journal.

Total staff 325
Employees 92
Contractors 233
Staff to resident ratio 3.57:1
88% better than Illinois average

Illinois average ratio: 1.90:1

Avg staff/day 48
Average shift 8.5 hours
12% better than Illinois average

Illinois average: 7.6 hours

Total staff hours (quarter) 37,257
Nursing staff breakdown
Registered Nurse

Manages medical care and health needs.

Total count 27
Average shift length Info Average shift length. Calculated as total hours divided by days worked and average staff per day. 9.7 hours

This role is partially covered by contractors.

Licensed Practical Nurse

Assists with medical care and medications.

Total count 98
Average shift length Info Average shift length. Calculated as total hours divided by days worked and average staff per day. 9.2 hours

This role is partially covered by contractors.

Certified Nursing Assistant

Helps with daily care and mobility.

Total count 169
Average shift length Info Average shift length. Calculated as total hours divided by days worked and average staff per day. 9 hours

This role is partially covered by contractors.

Contractor staffing

Total hours from contractors

24.5%

9,145 contractor hours this quarter

Certified Nursing Assistant: 114 Licensed Practical Nurse: 78 Registered Nurse: 19 Physical Therapy Assistant: 5 Speech Language Pathologist: 4 Respiratory Therapy Technician: 4 Physical Therapy Aide: 3 Qualified Social Worker: 2 Medical Director: 1 Occupational Therapy Aide: 1 Mental Health Service Worker: 1 Dietitian: 1
Staff by category
Certified Nursing Assistant5511416919,97291100%9
Licensed Practical Nurse2078989,04991100%9.2
Registered Nurse819272,2038897%9.7
Physical Therapy Aide0338837785%7.1
Other Dietary Services Staff2028696673%7.8
Speech Language Pathologist0446516976%6
Diagnostic X-ray Services Staff2025415763%8.9
Administrator1015206571%8
Clinical Nurse Specialist1014995864%8.6
Physical Therapy Assistant0554526673%6.7
Respiratory Therapy Technician0443887077%5.5
Qualified Social Worker0223696268%6
Nurse Practitioner1012852629%11
Mental Health Service Worker1122463235%7.2
RN Director of Nursing1012082629%8
Occupational Therapy Aide011662123%3.1
Medical Director011526571%0.8
Dietitian011511%5.3
169 Certified Nursing Assistant
% of Days 100%
98 Licensed Practical Nurse
% of Days 100%
27 Registered Nurse
% of Days 97%
3 Physical Therapy Aide
% of Days 85%
2 Other Dietary Services Staff
% of Days 73%
4 Speech Language Pathologist
% of Days 76%
2 Diagnostic X-ray Services Staff
% of Days 63%
1 Administrator
% of Days 71%
1 Clinical Nurse Specialist
% of Days 64%
5 Physical Therapy Assistant
% of Days 73%
4 Respiratory Therapy Technician
% of Days 77%
2 Qualified Social Worker
% of Days 68%
1 Nurse Practitioner
% of Days 29%
2 Mental Health Service Worker
% of Days 35%
1 RN Director of Nursing
% of Days 29%
1 Occupational Therapy Aide
% of Days 23%
1 Medical Director
% of Days 71%
1 Dietitian
% of Days 1%

Facility Characteristics

Source: CMS Long-Term Care Facility Characteristics (Data as of Jan 2026)

Total census
91 residents
Residents by payment source
Medicare
15 residents (16.5%)
Medicaid
68 residents (74.7%)
Private pay or other
8 residents (8.8%)
Programs & Services
Residents' Group

Residents meet regularly to discuss policies, care quality, and activities

Active Resident Council

Organized group of residents that meets regularly to discuss facility policies, quality of life, and activities.

Quality of care over time

These measures show how residents usually do over time at this home, based on health outcomes and preventive care.

High-risk clinical events score Info A composite score based on pressure ulcers, falls with injury, weight loss, walking ability decline, and activities of daily living decline. 13.6
40% worse than Illinois average

Illinois average: 9.7

Functional decline score Info A composite score based on activities of daily living decline, walking ability decline, and incontinence. 20.3
9% worse than Illinois average

Illinois average: 18.6

Long-stay resident measures
Average Illinois avg: 3.6 Info CMS star rating based on long-stay quality measure performance. 5 stars = significantly above average, 1 star = significantly below average.
Need for Help with Daily Activities Increased Info Percent of long-stay residents whose need for help with daily activities has increased 21.0%
36% worse than Illinois average

Illinois average: 15.5%

Walking Ability Worsened Info Percent of long-stay residents whose ability to move independently worsened 24.5%
33% worse than Illinois average

Illinois average: 18.4%

Low Risk Residents with Bowel/Bladder Incontinence Info Percent of low risk long-stay residents who lose control of their bowels or bladder 15.3%
29% better than Illinois average

Illinois average: 21.6%

Falls with Major Injury Info Percent of long-stay residents experiencing one or more falls with major injury 1.2%
63% better than Illinois average

Illinois average: 3.4%

High Risk Residents with Pressure Ulcers Info Percent of long-stay high risk residents with pressure ulcers 7.9%
49% worse than Illinois average

Illinois average: 5.3%

Urinary Tract Infection Info Percent of long-stay residents with a urinary tract infection 2.2%
21% worse than Illinois average

Illinois average: 1.8%

Lost Too Much Weight Info Percent of long-stay residents who lose too much weight 13.2%
102% worse than Illinois average

Illinois average: 6.5%

Depressive Symptoms Info Percent of long-stay residents who have depressive symptoms 98.6%
105% worse than Illinois average

Illinois average: 48.1%

Antipsychotic Use Info Percent of long-stay residents who received an antipsychotic medication 11.1%
45% better than Illinois average

Illinois average: 20.2%

Pneumococcal Vaccine Info Percent of long-stay residents assessed and appropriately given the pneumococcal vaccine 97.9%
10% better than Illinois average

Illinois average: 89.2%

Influenza Vaccine Info Percent of long-stay residents assessed and appropriately given the seasonal influenza vaccine 80.4%
12% worse than Illinois average

Illinois average: 91.6%

Hospitalizations per 1,000 days Info Number of hospitalizations per 1,000 long-stay resident days. 2.78
36% worse than Illinois average

Illinois average: 2.05

ED visits per 1,000 days Info Number of outpatient emergency department visits per 1,000 long-stay resident days. 3.66
63% worse than Illinois average

Illinois average: 2.25

Short-stay resident measures
Average Illinois avg: 2.0 Info CMS star rating based on short-stay quality measure performance. 5 stars = much above average, 1 star = much below average.
Pneumococcal Vaccine Info Percent of short-stay residents assessed and appropriately given the pneumococcal vaccine 71.1%
In line with Illinois average

Illinois average: 68.3%

Antipsychotic medication increase Info Percent of short-stay residents who newly received an antipsychotic medication 1.5%
34% better than Illinois average

Illinois average: 2.3%

Influenza Vaccine Info Percent of short-stay residents assessed and appropriately given the seasonal influenza vaccine 57.4%
9% worse than Illinois average

Illinois average: 63.0%

Re-hospitalized after SNF stay Info Percentage of short-stay residents who were re-hospitalized after their nursing home admission. 38.7%
48% worse than Illinois average

Illinois average: 26.2%

Emergency department visits Info Percentage of short-stay residents who had an outpatient emergency department visit. 14.7%
5% worse than Illinois average

Illinois average: 14.0%

Falls with major injury Info Percentage of SNF residents who experience falls with major injury during their stay. 0.0%
100% better than Illinois average

Illinois average: 0.8%

Ability to care for self at discharge Info Percentage of residents at or above expected ability to care for themselves at discharge. 58.0%
8% better than Illinois average

Illinois average: 53.7%

Successful return to home or community Info Rate of successful return to home or community from a skilled nursing facility. 52.5%
In line with Illinois average

Illinois average: 50.6%

Penalties and fines

Federal penalties imposed by CMS for regulatory violations, including civil money penalties (fines) and denials of payment for new Medicare/Medicaid admissions.

Source: CMS Penalties Database (Data as of Jan 2026)

Total fines amount $68K
52% lower than Illinois average

Illinois average: $143K

Number of fines 1
66% fewer fines than Illinois average

Illinois average: 3.0

Payment Denials Info Serious action where Medicare and/or Medicaid temporarily stops payments for new residents until issues are fixed. 2
89% more payment denials than Illinois average

Illinois average: 1.1

Fines amount comparison
This facility $68K
Illinois average $143K
Penalty History

Penalties are imposed by CMS for violations of federal nursing home regulations.

Payment Denial Info Serious action where Medicare and/or Medicaid temporarily stops payments for new residents until issues are fixed. Jun 5, 2025
5 days
Civil Money Penalty Info Fines imposed for noncompliance, which can be assessed per day or per instance of violation. Jul 3, 2024
$68K
Payment Denial Info Serious action where Medicare and/or Medicaid temporarily stops payments for new residents until issues are fixed. Jul 3, 2024
5 days

Last updated: Jan 2026

Guides for Better Senior Living

Care Cost Calculator: See Prices in Your Area

Nursing Home Data Explorer

Don’t Wait Too Long: 7 Red Flag Signs Your Parent Needs Assisted Living Now

The True Cost of Assisted Living in 2025 – And How Families Are Paying For It

Understanding Senior Living Costs: Pricing Models, Discounts & Financial Assistance

Financial Aid for Illinois Seniors

Get financial aid guidance

Community Care Program

Illinois CCP

Age 60+, Illinois resident, at risk of nursing home placement.

~$1,215/month (individual).

$17,500 (individual, excludes home, car).

High demand in urban areas; waitlists possible.

Illinois Respite Program

IL Respite (via NFCSP)

Caregiver of someone 60+ (or with dementia), Illinois resident.

No strict limit; prioritizes low-income.

Not applicable.

Limited slots; urban/rural balance.

Supportive Living Program (SLP)

Illinois Medicaid Supportive Living Program

Age 65+ or 22-64 with disability, Illinois resident, Medicaid-eligible, needs moderate assistance (not nursing home-level).

~$2,829/month (300% FBR, individual); QIT allowed.

$2,000 (individual), $3,000 (couple) (excludes home, car).

~200 SLP sites statewide; room/board not covered.

Persons Who Are Elderly Waiver

Illinois Medicaid Elderly Waiver

Age 65+, Illinois resident, Medicaid-eligible, nursing home-level care need.

~$2,829/month (300% FBR, individual).

$2,000 (individual), $3,000 (couple).

Part of HealthChoice Illinois; consumer-directed options available.

Medicare Savings Program (MSP)

Illinois Medicare Savings Program

Age 65+ or disabled, Illinois resident, Medicare Part A/B.

~$2,510/month (QMB), ~$3,380/month (SLMB), ~$3,598/month (QI)—individual.

$9,430 (individual), $14,130 (couple).

Three tiers; no waitlist.

Senior Community Service Employment Program (SCSEP)

Illinois SCSEP

Age 55+, unemployed, low-income, Illinois resident.

~$1,983/month (125% FPL).

Not specified; income-focused.

Priority for veterans, rural residents.

Optional State Supplementation (OSS)

Illinois Optional State Supplementation

Age 65+ or disabled, Illinois resident, in approved facility, SSI recipient or low-income.

~$1,004/month (including SSI).

$2,000 (individual), $3,000 (couple).

~$50-$500/month based on facility type.

VA Aid and Attendance (A&A) and Housebound Benefits

Illinois VA Aid and Attendance/Housebound

Age 65+ or disabled veteran/spouse, Illinois resident, wartime service, need for ADL help (A&A) or homebound.

Net income < ~$1,984/month (veteran with dependent, A&A); pension offsets income.

~$155,356 (net worth limit).

High veteran demand in urban/rural areas.