


Total health inspections
6
North Carolina average 4
Last Health inspection on Jun 2025
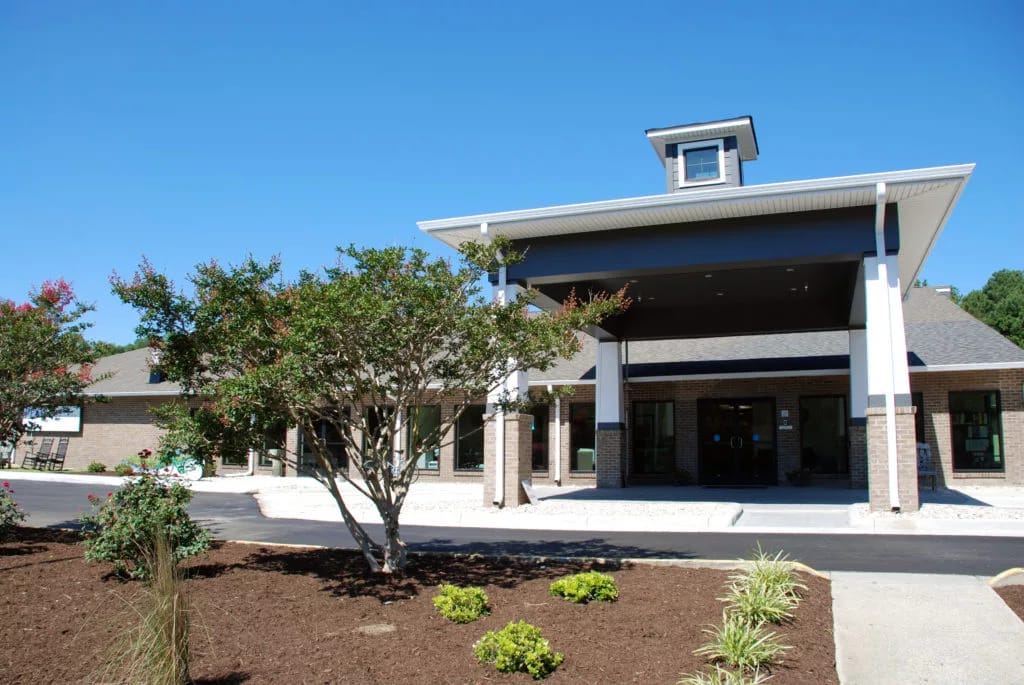
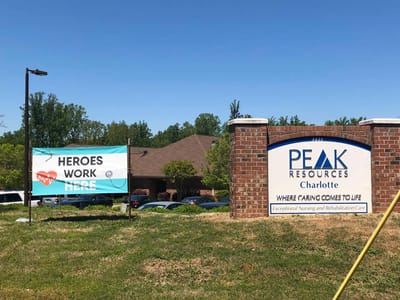
Located in Charlotte, North Carolina, Peak Resources Charlotte is an assisted living and nursing home community offering both short-term rehabilitation and long-term care services.
With 142 beds, it is a sizable facility dedicated to providing quality care to its residents. The community proudly participates in Medicare and Medicaid, ensuring that residents have access to comprehensive healthcare services.
| Staff type | Hours / Day / Resident | vs state avg |
|---|---|---|
|
Registered Nurse (RN)
| 13m per day | ▼ 63% State avg: 35m per day · National avg: 41m per day |
|
LPN / LVN
| 1h 2m per day | ▲ 19% State avg: 52m per day · National avg: 52m per day |
|
Nurse Aide
| 2h 4m per day | ▼ 11% State avg: 2h 19m per day · National avg: 2h 21m per day |
|
Weekend Total Nursing
| 3h 11m per day | ▼ 5% State avg: 3h 20m per day · National avg: 3h 26m per day |
|
Physical Therapist
| 3m per day | ▼ 43% State avg: 5m per day · National avg: 4m per day |
|
Weekend RN
| 7m per day | ▼ 70% State avg: 23m per day · National avg: 29m per day |
Key information about the people who lead and staff this community.
In North Carolina, the Department of Health and Human Services, Division of Health Service Regulation conducts unannounced surveys to ensure nursing and adult care homes meet safety standards.
Deficiencies
| This Facility | NC Average | vs. NC Avg |
|---|---|---|---|
|
Total deficiencies
| 30 | 46 | This facility has 35% fewer total deficiencies than a typical North Carolina nursing home (30 vs. NC avg 46).↓ 35% better |
North Carolina average 4
Last Health inspection on Jun 2025
North Carolina average 20.9
North Carolina average 4.99
Health citations are formal notices following inspections when they fail to comply with safety and care standards.
6 of 23 citations resulted from standard inspections; 7 of 23 resulted from complaint investigations; and 10 of 23 came from combined inspections (standard and complaint).
North Carolina average: 1.3
North Carolina average: 0.9
Reporting period: October 1 – December 31, 2025 (Q4 2025). Source: CMS Payroll-Based Journal report.
Manages medical care and health needs.
Assists with medical care and medications.
Helps with daily care and mobility.
Total hours from contractors
5,655 contractor hours this quarter
| Certified Nursing Assistant | 75 | 38 | 113 | 19,844 | 92 | 100% | 7.4 |
| Licensed Practical Nurse | 26 | 43 | 69 | 9,020 | 92 | 100% | 9.2 |
| Medication Aide/Technician | 5 | 0 | 5 | 2,912 | 92 | 100% | 10.1 |
| RN Director of Nursing | 6 | 0 | 6 | 2,348 | 92 | 100% | 8.2 |
| Clinical Nurse Specialist | 5 | 0 | 5 | 1,091 | 87 | 95% | 8 |
| Mental Health Service Worker | 2 | 0 | 2 | 929 | 64 | 70% | 7.9 |
| Registered Nurse | 5 | 3 | 8 | 741 | 72 | 78% | 8 |
| Respiratory Therapy Technician | 0 | 1 | 1 | 523 | 65 | 71% | 8.1 |
| Nurse Practitioner | 1 | 0 | 1 | 520 | 65 | 71% | 8 |
| Dietitian | 1 | 0 | 1 | 512 | 61 | 66% | 8.4 |
| Other Dietary Services Staff | 1 | 0 | 1 | 495 | 62 | 67% | 8 |
| Speech Language Pathologist | 0 | 3 | 3 | 495 | 69 | 75% | 7.2 |
| Physical Therapy Assistant | 0 | 1 | 1 | 483 | 64 | 70% | 7.5 |
| Physical Therapy Aide | 0 | 4 | 4 | 470 | 65 | 71% | 6.6 |
| Administrator | 1 | 0 | 1 | 458 | 59 | 64% | 7.8 |
| Qualified Social Worker | 0 | 5 | 5 | 437 | 67 | 73% | 6.3 |
| Occupational Therapy Aide | 0 | 2 | 2 | 188 | 44 | 48% | 4.3 |
| Occupational Therapy Assistant | 0 | 1 | 1 | 62 | 10 | 11% | 6.2 |
Includes penalties issued in 2024
Federal penalties imposed by CMS for regulatory violations, including civil money penalties (fines) and denials of payment for new Medicare/Medicaid admissions.
Source: CMS Penalties Database (Data as of Jan 2026)
North Carolina average: $76K
North Carolina average: 2.3
North Carolina average: 0.4
Penalties are imposed by CMS for violations of federal nursing home regulations.
1 penalty in the past 3 years
Mar 21, 2024 · $14K
Last updated: Jan 2026
These measures show how residents usually do over time at this home, based on health outcomes and preventive care.
North Carolina average: 11.5
North Carolina average: 20.6
North Carolina average: 17.5%
North Carolina average: 23.3%
North Carolina average: 21.4%
North Carolina average: 3.6%
North Carolina average: 6.3%
North Carolina average: 2.6%
North Carolina average: 7.4%
North Carolina average: 4.4%
North Carolina average: 13.4%
North Carolina average: 91.6%
North Carolina average: 94.1%
North Carolina average: 1.77
North Carolina average: 1.82
North Carolina average: 79.9%
North Carolina average: 1.5%
North Carolina average: 78.1%
North Carolina average: 22.9%
North Carolina average: 13.2%
North Carolina average: 0.8%
North Carolina average: 50.6%
Quality measures are calculated from Minimum Data Set (MDS) assessments. For most measures, lower percentages indicate better care quality.
12% of new residents, usually for short-term rehab.
40% of new residents, often for short stays.
48% of new residents, often for long-term daily care.
Source: CMS Long-Term Care Facility Characteristics (Data as of Jan 2026)
Residents meet regularly to discuss policies, care quality, and activities
Organized group of residents that meets regularly to discuss facility policies, quality of life, and activities.
Data sourced from CMS Long-Term Care Facility Characteristics quarterly report. Payer mix reflects the current resident census by primary payment source.
Historical financial and operational data for Peak Resources Charlotte from 2012–2023, based on CMS SNF Cost Reports.
Key figures below are for fiscal year ending in 09/2023.
Based on CMS SNF Cost Report for fiscal year ending in 09/2023.
Most residents stay for extended periods and receive ongoing daily care.
New residents most often arrive under Medicaid (48% of admissions), and a typical Medicaid stay runs around 6 - 7 months.
Coverage residents most often arrive under.
Coverage residents most often leave under.
![]() 3.0 miles from city center
3.0 miles from city center
![]() Estimated distance in miles from Charlotte's city center to Peak Resources Charlotte's address, calculated via Google Maps.
— 1.98 miles to nearest hospital (Novant Health Presbyterian Medical Center : Cancer Center)
Estimated distance in miles from Charlotte's city center to Peak Resources Charlotte's address, calculated via Google Maps.
— 1.98 miles to nearest hospital (Novant Health Presbyterian Medical Center : Cancer Center)
Add your location
The information below is reported by the North Carolina Department of Health and Human Services, Division of Health Service Regulation.
| Brookdale Carriage Club Providence | NH AL IL MC SNF | Charlotte (Olde Providence North) | 77
Facility
77
NC AVG
72
Rank
#166 / 388 | - | - | 8.12
Facility
8.12
NC AVG
3.98
Rank
#4 / 97 | +78% | +104% | $0
Facility
$0
NC AVG
$74.6k
Rank
#1 / 105 | 11
Facility
11
NC AVG
20.9
Rank
#39 / 101 | 3.7
Facility
3.7
NC AVG
5.0
Rank
#43 / 101 | - | 7 | A+ |
12
Facility
12
NC AVG
33
Rank
#441 / 573 | Bkd Fm Holding Company LLC | $19.6MFiscal year ending 12/2023
Facility
$19.6MFiscal year ending 12/2023
NC AVG
$13.2M
Rank
#100 / 104 | $8.1MFiscal year ending 12/2023
Facility
$8.1MFiscal year ending 12/2023
NC AVG
$4.9M
Rank
#39 / 104 | 41.6%Fiscal year ending 12/2023
Facility
41.6%Fiscal year ending 12/2023
NC AVG
39.8%
Rank
#1 / 104 | 345482 | ||||
| The Sharon at SouthPark | NH AL IL MC SNF | Charlotte (Beverly Woods) | 19
Facility
19
NC AVG
72
Rank
#334 / 388 |
25.3%
Facility
25.3%
NC AVG
68
Rank
#220 / 240 | -63% | - | - | - | $0
Facility
$0
NC AVG
$74.6k
Rank
#1 / 105 | 10
Facility
10
NC AVG
20.9
Rank
#37 / 101 | 5.0
Facility
5.0
NC AVG
5.0
Rank
#67 / 101 | - | 5 | - |
49
Facility
49
NC AVG
33
Rank
#162 / 573 | Katherine Richards | $10.6MFiscal year ending 12/2023
Facility
$10.6MFiscal year ending 12/2023
NC AVG
$13.2M
Rank
#12 / 104 | $13.4MFiscal year ending 12/2023
Facility
$13.4MFiscal year ending 12/2023
NC AVG
$4.9M
Rank
#16 / 104 | 127%Fiscal year ending 12/2023
Facility
127%Fiscal year ending 12/2023
NC AVG
39.8%
Rank
#80 / 104 | 345564 | ||||
| Briar Creek Health Center at The Barclay at SouthPark | NH AL IL MC RC SNF | S Charlotte (Beverly Woods) | 6
Facility
6
NC AVG
72
Rank
#336 / 388 |
66.7%
Facility
66.7%
NC AVG
68
Rank
#142 / 240 | -2% | - | -26% | - | $8.6k
Facility
$8.6k
NC AVG
$74.6k
Rank
#56 / 105 | 8
Facility
8
NC AVG
20.9
Rank
#31 / 101 | 2.7
Facility
2.7
NC AVG
5.0
Rank
#29 / 101 | 2 | 4 | - |
30
Facility
30
NC AVG
33
Rank
#309 / 573 | Charlotte Sp Senior Housing Jv Opco, LLC | $19.6MFiscal year ending 09/2023
Facility
$19.6MFiscal year ending 09/2023
NC AVG
$13.2M
Rank
#30 / 104 | $9.5MFiscal year ending 09/2023
Facility
$9.5MFiscal year ending 09/2023
NC AVG
$4.9M
Rank
#29 / 104 | 48.5%Fiscal year ending 09/2023
Facility
48.5%Fiscal year ending 09/2023
NC AVG
39.8%
Rank
#50 / 104 | 345578 | ||||
| Peak Resources Charlotte | NH AL HOS IL MC RC SNF | Charlotte (Country Club Heights) | 142
Facility
142
NC AVG
72
Rank
#15 / 388 |
84.1%
Facility
84.1%
NC AVG
68
Rank
#80 / 240 | +24% | 3.17
Facility
3.17
NC AVG
3.98
Rank
#89 / 97 | -62% | -20% | $14.1k
Facility
$14.1k
NC AVG
$74.6k
Rank
#61 / 105 | 23
Facility
23
NC AVG
20.9
Rank
#72 / 101 | 3.8
Facility
3.8
NC AVG
5.0
Rank
#46 / 101 | 5 | 119 | - |
64
Facility
64
NC AVG
33
Rank
#46 / 573 | Peak Resources Inc | $13.1MFiscal year ending 09/2023
Facility
$13.1MFiscal year ending 09/2023
NC AVG
$13.2M
Rank
#72 / 104 | $4.8MFiscal year ending 09/2023
Facility
$4.8MFiscal year ending 09/2023
NC AVG
$4.9M
Rank
#90 / 104 | 36.5%Fiscal year ending 09/2023
Facility
36.5%Fiscal year ending 09/2023
NC AVG
39.8%
Rank
#79 / 104 | 345013 | ||||
| Accordius Health at Charlotte | NH AL | Charlotte (Yorkmount) | 116
Facility
116
NC AVG
72
Rank
#52 / 388 |
81.0%
Facility
81.0%
NC AVG
68
Rank
#97 / 240 | +19% | 3.42
Facility
3.42
NC AVG
3.98
Rank
#76 / 97 | +30% | -14% | $7.7k
Facility
$7.7k
NC AVG
$74.6k
Rank
#53 / 105 | 13
Facility
13
NC AVG
20.9
Rank
#49 / 101 | 4.3
Facility
4.3
NC AVG
5.0
Rank
#52 / 101 | - | 94 | A+ |
13
Facility
13
NC AVG
33
Rank
#433 / 573 | Fred Collins | $11.6MFiscal year ending 12/2023
Facility
$11.6MFiscal year ending 12/2023
NC AVG
$13.2M
Rank
#77 / 104 | $4.7MFiscal year ending 12/2023
Facility
$4.7MFiscal year ending 12/2023
NC AVG
$4.9M
Rank
#81 / 104 | 40.7%Fiscal year ending 12/2023
Facility
40.7%Fiscal year ending 12/2023
NC AVG
39.8%
Rank
#46 / 104 | 345243 |
Peak Resources Charlotte is located in Charlotte, North Carolina.
Here are the financial assistance programs available to residents in North Carolina.
Peak Resources Charlotte is in the Country Club Heights neighborhood of Charlotte.
Peak Resources Charlotte has a walk score of 64. Moderately walkable. Some errands can be accomplished on foot, with a mix of nearby amenities.
Peak Resources Charlotte's occupancy is 76.6%.
No, Peak Resources Charlotte has a no-pet policy.
Peak Resources Charlotte is registered as a for-profit in NC.
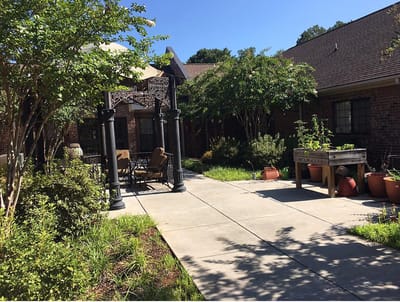
Yes — there are 3 photos of Peak Resources Charlotte in the photo gallery on this page.
Peak Resources Charlotte is located at 3223 Central Ave, Charlotte, NC 28205.
Care Cost Calculator: See Prices in Your Area
Nursing Home Data Explorer
Don’t Wait Too Long: 7 Red Flag Signs Your Parent Needs Assisted Living Now
The True Cost of Assisted Living in 2025 – And How Families Are Paying For It
Understanding Senior Living Costs: Pricing Models, Discounts & Financial Assistance


