The Sharon at SouthPark
Nursing Home, Assisted Living, Independent Living & Memory Care · Charlotte, NC
CMS overall rating Info CMS (the Centers for Medicare & Medicaid Services) is the federal agency that rates nursing home quality. Its Overall Rating runs from 1 to 5 stars, combining health inspections, staffing, and quality measures, with inspections weighted most heavily.

The Sharon at SouthPark

Nursing Home, Assisted Living, Independent Living & Memory Care · Charlotte, NC
CMS overall rating Info CMS (the Centers for Medicare & Medicaid Services) is the federal agency that rates nursing home quality. Its Overall Rating runs from 1 to 5 stars, combining health inspections, staffing, and quality measures, with inspections weighted most heavily.
Calculator: See prices in your area
The Sharon at SouthPark accepts Medicare and private pay.

Overview of The Sharon at Southpark

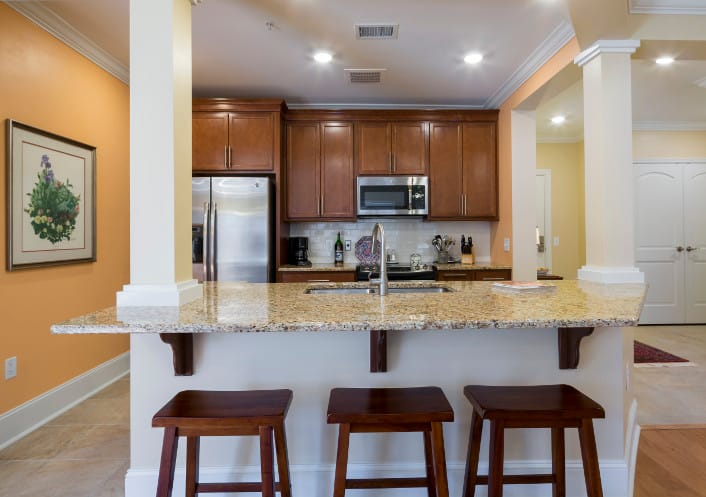
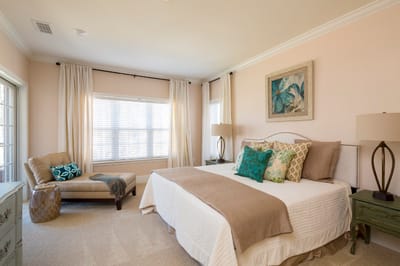
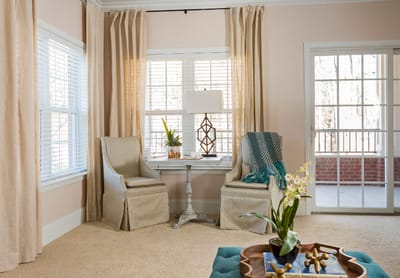
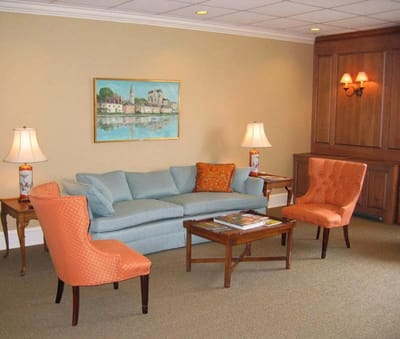
Make your dream retirement come true with The Sharon at Southpark, a compassionate community in Charlotte, NC, offering a continuum of care. Residents here have access to independent living, assisted living, and skilled nursing care provided by a team of kind and compassionate care experts. Their relaxing community is peacefully set amidst a 28-acre campus with easy access to shops, recreational amenities, and entertainment options in the area.

In addition to convenient services like housekeeping, laundry, and maintenance, the community provides access to a wide selection of hotel-like amenities, including gathering venues, recreational spaces, and wellness & fitness areas. Multiple dining areas and diverse menus are also available to ensure residents’ cravings and nutritional needs are met. Whatever your interests and passions are, The Sharon at Southpark provides the opportunities and spaces you need to enjoy them while receiving compassionate care and assistance.

(704) 553-1670

Quality ratings

Measured by Centers for Medicare & Medicaid Services (CMS)

Overall rating Info The Overall CMS Rating combines results from health inspections, staffing levels and quality measures. Health inspections carry the most weight. Staffing and quality scores can increase or decrease the final rating based on performance compared to state and national standards.
▲ 43.1% Above NC avg. ▲ 43.1% Above NC avg.NC average: 2.8Click the badge to see the full State ranking.Click here to see the full State ranking.
Health Inspection Info Based on the results of the facility's three most recent standard inspections and any complaint investigations. CMS reviews the number, scope, and severity of deficiencies, with more recent findings weighted more heavily.
▲ 41.6% Above NC avg. ▲ 41.6% Above NC avg.NC average: 2.8Click the badge to see the full State ranking.Click here to see the full State ranking.
Staffing Info Measures average nursing staff hours per resident per day, including Registered Nurses (RNs) and total nursing staff. Ratings are adjusted based on the level of care residents require and are compared to state and national benchmarks.
▲ 50.4% Above NC avg. ▲ 50.4% Above NC avg.NC average: 2.7Click the badge to see the full State ranking.Click here to see the full State ranking.
Quality Measures Info Based on clinical and physical health indicators reported to CMS, such as hospital readmissions, falls, pressure ulcers, and improvements in mobility. These measures reflect how well residents' health needs are being managed.
▼ 5.5% Below NC avg. ▼ 5.5% Below NC avg.NC average: 3.2Click the badge to see the full State ranking.Click here to see the full State ranking.

Staffing hours breakdown

Info Daily nursing hours per resident by staff type, reported to CMS. Higher is generally better — compare this facility to state and national averages to see where staffing stands.

Hours per resident per day — compared to North Carolina state averages

Staff typeHours / Day / Residentvs state avg
Registered Nurse (RN) Info RNs hold the highest nursing license and can assess residents, interpret test results, and direct care plans. More RN hours per day often signals stronger clinical oversight and faster response to health changes. 5h 47m per day ▲ 893% State avg: 35m per day · National avg: 41m per day
LPN / LVN Info Licensed Practical Nurses (LPNs) or Licensed Vocational Nurses (LVNs) deliver routine hands-on care — medication administration, wound dressing, and monitoring vital signs. They work under RN supervision and make up a large share of daily bedside care. 5h 23m per day ▲ 520% State avg: 52m per day · National avg: 52m per day
Nurse Aide Info Certified Nurse Aides (CNAs) provide the most direct day-to-day assistance: bathing, dressing, feeding, and mobility. Nurse aide hours are typically the largest staffing category and directly affect residents' quality of life. 5h 3m per day ▲ 118% State avg: 2h 19m per day · National avg: 2h 21m per day
Weekend Total Nursing Info Combined nursing hours (RN + LPN + Nurse Aide) per resident per day on weekends. Staffing often drops on weekends — this figure reveals whether the facility maintains adequate coverage outside of weekday hours. 11h 1m per day ▲ 231% State avg: 3h 20m per day · National avg: 3h 26m per day
Physical Therapist Info Hours per resident per day provided by licensed Physical Therapists (PTs) or PT Assistants. PT services help residents recover mobility after injury or illness and are especially important for post-acute (short-stay) rehabilitation. 1h 59m per day ▲ 2276% State avg: 5m per day · National avg: 4m per day
Weekend RN Info Registered nurse hours specifically on weekends. Facilities sometimes reduce RN presence on Saturdays and Sundays — a low weekend RN figure compared to weekday hours can indicate reduced clinical oversight when most administrative staff are absent. 2h 47m per day ▲ 626% State avg: 23m per day · National avg: 29m per day

Capacity and availability

This home usually has availability

Lower occupancy than the North Carolina average: 76.4%
Occupancy rate
65.6% Rank #174 / 271Occupancy rate — State benchmarkedThis home is ranked 174th out of 271 homes in North Carolina. Shows this facility's occupancy rate versus the North Carolina average, with its Statewide rank out of 271. Higher occupancy signals strong local demand and financial stability.Rankings are based only on facilities in North Carolina that report data for that category. Facilities without available data are excluded from the ranking.Click the rank badge to see the full State ranking.Click here to see the full State ranking.
Avg. Length of Stay
22 days
Bed community size
19-bed community Rank #336 / 390Bed count — State benchmarkedThis home is ranked 336th out of 390 homes in North Carolina. Shows this facility's certified or reported bed count compared to other North Carolina facilities. Larger communities may offer more amenities, programs, and on-site services for residents and families.Rankings are based only on facilities in North Carolina that report data for that category. Facilities without available data are excluded from the ranking.Click the rank badge to see the full State ranking.Click here to see the full State ranking.
A smaller, more intimate setting that may offer a quieter environment and closer staff-resident interactions.
Walk Score
Walk Score: 49 / 100 Rank #161 / 572Walk Score — State benchmarkedThis home is ranked 161st out of 572 homes in North Carolina. Shows how walkable this facility's neighborhood is compared to the average Walk Score across North Carolina facilities. Higher scores benefit residents, families, and staff.Rankings are based only on facilities in North Carolina that report data for that category. Facilities without available data are excluded from the ranking.Click the rank badge to see the full State ranking.Click here to see the full State ranking.
Somewhat walkable. A few nearby services may be reachable on foot, but most trips require transportation.

Contact The Sharon at SouthPark

Penalties and fines

Federal penalties imposed by CMS for regulatory violations, including civil money penalties (fines) and denials of payment for new Medicare/Medicaid admissions.

Source: CMS Penalties Database

No penalties in the past 3 years

No civil money penalties or payment denials were reported in the last 3 years.

Quality of care over time

These measures show how residents usually do over time at this home, based on health outcomes and preventive care.

Short-stay resident measures
Average North Carolina avg: 2.9 Info CMS star rating based on short-stay quality measure performance. 5 stars = much above average, 1 star = much below average.
Pneumococcal Vaccine Info Percent of short-stay residents assessed and appropriately given the pneumococcal vaccine 98.8%
24% better than North Carolina average

North Carolina average: 79.9%

Antipsychotic medication increase Info Percent of short-stay residents who newly received an antipsychotic medication 0.3%
80% better than North Carolina average

North Carolina average: 1.5%

Influenza Vaccine Info Percent of short-stay residents assessed and appropriately given the seasonal influenza vaccine 97.9%
25% better than North Carolina average

North Carolina average: 78.1%

Re-hospitalized after SNF stay Info Percentage of short-stay residents who were re-hospitalized after their nursing home admission. 22.0%
In line with North Carolina average

North Carolina average: 22.9%

Emergency department visits Info Percentage of short-stay residents who had an outpatient emergency department visit. 13.9%
5% worse than North Carolina average

North Carolina average: 13.2%

Falls with major injury Info Percentage of SNF residents who experience falls with major injury during their stay. 2.0%
165% worse than North Carolina average

North Carolina average: 0.8%

Ability to care for self at discharge Info Percentage of residents at or above expected ability to care for themselves at discharge. 58.2%
8% better than North Carolina average

North Carolina average: 53.7%

Successful return to home or community Info Rate of successful return to home or community from a skilled nursing facility. 53.9%
7% better than North Carolina average

North Carolina average: 50.6%

Breakdown by payment type

Medicare

52% of new residents, usually for short-term rehab.

Typical stay 20 days

Private pay

48% of new residents, often for short stays.

Typical stay 10 - 11 months

Facility Characteristics

Source: CMS Long-Term Care Facility Characteristics (Data as of Jan 2026)

Total residents 10
Medicare
10
100% of residents
Programs & Services
Residents Group

Residents meet regularly to discuss policies, care quality, and activities

CCRC

Part of a Continuing Care Retirement Community offering multiple care levels

Active Resident Council

Organized group of residents that meets regularly to discuss facility policies, quality of life, and activities.

Finances and operations

Based on CMS SNF Cost Report for fiscal year ending in 12/2023.

Governmental community
Operated by a subsidized facility district.
Net patient revenue Info Net patient revenue — what the home actually collects for resident care, after contractual allowances, bad debt and discounts are subtracted from its gross charges (CMS cost report, Worksheet G-3). It covers resident care only; money the home earns from other sources is shown separately as "Other income."
$10.6M
Net patient income Info Net patient income: net patient revenue minus the home's total operating expenses. A positive figure means it earns more from resident care than it spends to deliver it; a negative figure means the opposite. It excludes non-operating "other income."
-$24.4M
Governmental community Operated by a subsidized facility district.
Net patient revenue Info Net patient revenue — what the home actually collects for resident care, after contractual allowances, bad debt and discounts are subtracted from its gross charges (CMS cost report, Worksheet G-3). It covers resident care only; money the home earns from other sources is shown separately as "Other income."
$10.6M Rank #12 / 104Revenue — State benchmarkedThis home is ranked 12th out of 104 homes in North Carolina. Shows this facility's annual revenue compared to the North Carolina average. Higher revenue generally means more resources for staffing and capital — read alongside Payroll %.Rankings are based only on facilities in North Carolina that report data for that category. Facilities without available data are excluded from the ranking.Click the rank badge to see the full State ranking.Click here to see the full State ranking.
Net patient income Info Net patient income: net patient revenue minus the home's total operating expenses. A positive figure means it earns more from resident care than it spends to deliver it; a negative figure means the opposite. It excludes non-operating "other income."
-$24.4M
Other income Info Money the home earns outside of resident care — such as investments, grants, rentals and other non-operating sources (CMS cost report, Worksheet G-3). It is tracked separately from net patient revenue: it is not part of that figure, and it is not included in net patient income.
$28.4M
Payroll costs Info Staff salaries plus wage-related costs — benefits such as payroll taxes, health insurance and retirement — from the home's own accounting records (CMS cost report, Worksheet A). Contract or agency labor is counted separately, under other operating costs. Rank #16 / 104Payroll — State benchmarkedThis home is ranked 16th out of 104 homes in North Carolina. Shows total annual staff payroll benchmarked to the North Carolina average. Higher payroll investment relative to peers often signals better staffing and less reliance on cheaper contract labor.Rankings are based only on facilities in North Carolina that report data for that category. Facilities without available data are excluded from the ranking.Click the rank badge to see the full State ranking.Click here to see the full State ranking.
$13.4M 127% of net patient revenue Info Payroll as a share of revenue: staff salaries and wage-related benefits divided by net patient revenue. A higher figure means more of each revenue dollar goes to staff pay. Rank #82 / 104Payroll % — State benchmarkedThis home is ranked 82nd out of 104 homes in North Carolina. Shows payroll as a percentage of revenue versus the North Carolina average. Well-run North Carolina facilities typically land around 49–62% — the top third Statewide. Below 25% may signal understaffing or heavy agency use — read with Staffing ratings.Rankings are based only on facilities in North Carolina that report data for that category. Facilities without available data are excluded from the ranking.Click the rank badge to see the full State ranking.Click here to see the full State ranking.
Other operating costs Info Everything it costs to run the home apart from payroll — food, utilities, supplies, maintenance, contract labor and administration. Calculated as total operating expense minus payroll (staff salaries and wage-related benefits).
$21.5M
Total costs Info The home's total operating expense for the year — all the costs of running it, salaries included (CMS cost report, Worksheet G-3).
$34.9M

What does this home offer?

Pets allowed icon
Pets allowed icon

Pets Allowed

Room sizes icon
Room sizes icon

Room Sizes: 1000 - 2200 sq. ft

Housing options icon

Housing Options: Studio / 1 Bed / 2 Bed

Building type icon
Building type icon

Building Type: 3-story

Beauty services icon

Beauty Services

Transportation services icon

Transportation Services

Housekeeping icon
Housekeeping icon

Housekeeping Services

Recreational activities icon

Recreational Activities

Exercise program icon

Exercise Programs

Health Programs icon

Health Programs

Who this home usually serves

TYPE OF STAY

Mostly short-term rehab stays

Most residents typically stay for a few weeks or months before returning home or moving on.

Most new residents arrive under Medicare (52% of admissions), and a typical Medicare stay runs around 20 days.

Admissions
195 total

Coverage residents most often arrive under.

Medicare 52%
Private pay 48%
Discharges
196 total

Coverage residents most often leave under.

Medicare 51%
Private pay 49%

Places of interest near The Sharon at SouthPark

Address 7.1 miles from city center Info Estimated distance in miles from Charlotte's city center to The Sharon at SouthPark's address, calculated via Google Maps.

Calculate Travel Distance to The Sharon at SouthPark

Add your location

Address

Compare Nursing Homes around Charlotte

The information below is reported by the North Carolina Department of Health and Human Services, Division of Health Service Regulation.

5 facilities compared · CMS & NC Dept. of Health data

The Sharon at SouthPark
NH
AL
IL
MC
Charlotte (Beverly Woods)
19
Facility 19
NC AVG 72
Rank #336 / 390
65.6%
Facility 65.6%
NC AVG 76.4%
Rank #174 / 271
-14%- --
$0
Facility $0
NC AVG $74.6k
Rank #1 / 105
10
Facility 10
NC AVG 20.9
Rank #37 / 101
5.0
Facility 5.0
NC AVG 5.0
Rank #67 / 101
-5-
49
Facility 49
NC AVG 33
Rank #161 / 572
Katherine Richards
$10.6M
Facility $10.6M
NC AVG $13.2M
Rank #12 / 104
$13.4M
Facility $13.4M
NC AVG $4.9M
Rank #16 / 104
127%
Facility 127%
NC AVG 39.8%
Rank #82 / 104
345564
Brookdale Carriage Club Providence
NH
AL
IL
MC
Charlotte (Olde Providence North)
77
Facility 77
NC AVG 72
Rank #168 / 390
71.5%
Facility 71.5%
NC AVG 76.4%
Rank #145 / 271
-6%
8.12
Facility 8.12
NC AVG 3.98
Rank #4 / 97
+78%+104%
$0
Facility $0
NC AVG $74.6k
Rank #1 / 105
11
Facility 11
NC AVG 20.9
Rank #39 / 101
3.7
Facility 3.7
NC AVG 5.0
Rank #43 / 101
-7A+
12
Facility 12
NC AVG 33
Rank #440 / 572
Bkd Fm Holding Company LLC
$19.6M
Facility $19.6M
NC AVG $13.2M
Rank #99 / 104
$8.1M
Facility $8.1M
NC AVG $4.9M
Rank #39 / 104
41.6%
Facility 41.6%
NC AVG 39.8%
Rank #1 / 104
345482
White Oak Manor Charlotte
NH
AL
IL
MC
NC
Charlotte (Cotswold)
180
Facility 180
NC AVG 72
Rank #4 / 390
75.9%
Facility 75.9%
NC AVG 76.4%
Rank #128 / 271
-1%
3.91
Facility 3.91
NC AVG 3.98
Rank #52 / 97
-29%-2%
$85.7k
Facility $85.7k
NC AVG $74.6k
Rank #91 / 105
17
Facility 17
NC AVG 20.9
Rank #62 / 101
4.3
Facility 4.3
NC AVG 5.0
Rank #52 / 101
1147A+
24
Facility 24
NC AVG 33
Rank #349 / 572
Hayden Keziah
$14.6M
Facility $14.6M
NC AVG $13.2M
Rank #48 / 104
$9.3M
Facility $9.3M
NC AVG $4.9M
Rank #31 / 104
63.7%
Facility 63.7%
NC AVG 39.8%
Rank #12 / 104
345238
University Place Nursing & Rehabilitation
NH
MC
Charlotte (University City North)
207
Facility 207
NC AVG 72
Rank #3 / 390
68.1%
Facility 68.1%
NC AVG 76.4%
Rank #158 / 271
-11%
4.12
Facility 4.12
NC AVG 3.98
Rank #39 / 97
-37%+4%
$276.4k
Facility $276.4k
NC AVG $74.6k
Rank #103 / 105
35
Facility 35
NC AVG 20.9
Rank #87 / 101
5.0
Facility 5.0
NC AVG 5.0
Rank #67 / 101
2158A+
29
Facility 29
NC AVG 33
Rank #321 / 572
-
$17.2M
Facility $17.2M
NC AVG $13.2M
Rank #40 / 104
$7.1M
Facility $7.1M
NC AVG $4.9M
Rank #32 / 104
41.5%
Facility 41.5%
NC AVG 39.8%
Rank #21 / 104
345142
The Cypress of Charlotte
NH
AL
HC
IL
MC
Charlotte (Beverly Woods)
65
Facility 65
NC AVG 72
Rank #210 / 390
78.2%
Facility 78.2%
NC AVG 76.4%
Rank #121 / 271
+2%- +26%-
$58.0k
Facility $58.0k
NC AVG $74.6k
Rank #83 / 105
14
Facility 14
NC AVG 20.9
Rank #50 / 101
4.7
Facility 4.7
NC AVG 5.0
Rank #58 / 101
258-
15
Facility 15
NC AVG 33
Rank #414 / 572
The Cypress Of Charlotte LLC
$7.3M
Facility $7.3M
NC AVG $13.2M
Rank #14 / 104
$14.1M
Facility $14.1M
NC AVG $4.9M
Rank #20 / 104
194.2%
Facility 194.2%
NC AVG 39.8%
Rank #79 / 104
345495

Financial Assistance for
Nursing Home in North Carolina

The Sharon at SouthPark is located in Charlotte, North Carolina.
Here are the financial assistance programs available to residents in North Carolina.

Get Financial aid guidance

Community Alternatives Program for Disabled Adults

NC Medicaid CAP/DA

Age 65+ or disabled
General North Carolina resident, Medicaid- eligible, nursing home-level care need.
Income Limits (2025) ~$2,829/month 300% FBR, individual
Asset Limits $2,000 (individual), $3,000 (couple).
NC

High demand; waitlists common in urban areas.

Benefits
Personal care (5-7 hours/day) Respite (240 hours/year) Adult day care ($60/day) Home modifications ($1,500 avg.)

North Carolina Senior Care Options

NC SCO (via NFCSP)

Age Caregiver of someone 60+ (or with dementia)
General North Carolina resident.
Income Limits No strict limit; prioritizes low-income.
Asset Limits Not applicable.
NC

Limited slots; rural/urban balance.

Benefits
In-home respite (4-6 hours/day) Adult day care (~$60/day) Short-term facility care (up to 5 days)

Program of All-Inclusive Care for the Elderly (PACE)

North Carolina PACE (e.g., PACE of the Triad)

Age 55+
General NC resident (specific counties), NFLOC, safe with PACE support.
Income Limits (2025) ~$2,829/month (Medicaid-eligible); private pay option available.
Asset Limits $2,000 (individual), $3,000 (couple) for Medicaid enrollees.
NC

Available in 10+ counties (e.g., Guilford, Wake); multiple providers (e.g., PACE of the Southern Piedmont).

Benefits
Personal care (5-7 hours/day) Medical care Meals Transportation Respite Therapies

In-Home Aide Services

North Carolina In-Home Aide Services

Age 60+
General NC resident, unable to perform 1+ ADL, at risk of nursing home placement.
Income Limits (2025) No strict cap; prioritizes low-income ~$24,980/year
Asset Limits Not assessed; need-based.
NC

Family can be aides; varies by county funding.

Benefits
Personal care (5-20 hours/week) Meal prep Respite (~5 days/year) Errands

Medicare Savings Program (MSP)

North Carolina Medicare Savings Program

Age 65+ or disabled
General NC resident, Medicare Part A/B.
Income Limits (2025) ~$2,510/month (QMB), ~$3,380/month (SLMB), ~$3,598/month (QI)—individual.
Asset Limits $9,430 (individual), $14,130 (couple).
NC

Three tiers; no waitlist; includes Extra Help for Part D.

Benefits
Covers Part B premiums ($174.70/month) Deductibles ($240/year) Copays (~20%)

VA Aid and Attendance (A&A) and Housebound Benefits

North Carolina VA Aid and Attendance/Housebound

Age 65+ or disabled veteran/spouse
General NC resident, wartime service, need for ADL help (A&A) or homebound.
Income Limits (2025) Net income < ~$1,984/month (veteran with dependent, A&A); pension offsets income.
Asset Limits ~$155,356 net worth limit
NC

High veteran demand in rural/urban areas.

Benefits
Cash (~$1,433-$2,642/month veteran, ~$951-$1,318 spouse) for care costs (e.g., in-home, assisted living)

Urgent Repair Program (URP)

North Carolina Urgent Repair Program

Age 60+ prioritized
General NC resident, homeowner, low-income.
Income Limits (2025) ~$30,258/year 50% AMI, varies by county
Asset Limits Not strictly assessed; home value considered.
NC

Forgivable at $2,000/year; statewide via local partners.

Benefits
Repairs (~$8,000-$12,000 avg.) for safety (e.g., roofs, heating, accessibility)

State/County Special Assistance (SA)

North Carolina Special Assistance

Age 65+ (or disabled)
General NC resident, in licensed adult care home, low-income.
Income Limits (2025) ~$1,255/month (individual, 100% FPL); varies by facility rate.
Asset Limits $2,000 individual
NC

Covers assisted living; counties supplement state funds.

Benefits
Cash (~$1,200-$1,500/month) for room/board; Medicaid covers care services

Frequently Asked Questions about The Sharon at SouthPark

What neighborhood is The Sharon at SouthPark in?

The Sharon at SouthPark is in the Beverly Woods neighborhood.

Is The Sharon at SouthPark in a walkable area?

The Sharon at SouthPark has a walk score of 49. Somewhat walkable. A few nearby services may be reachable on foot, but most trips require transportation.

What is the occupancy rate at The Sharon at SouthPark?

The Sharon at SouthPark's occupancy is 65.6%.

Are there photos of The Sharon at SouthPark?

Yes — there are 4 photos of The Sharon at SouthPark in the photo gallery on this page.

What is the address of The Sharon at SouthPark?

The Sharon at SouthPark is located at 5100 Sharon Rd, Charlotte, NC 28210.

What is the phone number of The Sharon at SouthPark?

(704) 553-1670 will put you in contact with the team at The Sharon at SouthPark.

Is The Sharon at SouthPark Medicare or Medicaid certified?

Yes — The Sharon at SouthPark is a CMS-certified provider of Medicare and Medicaid.

Guides for Better Senior Living

Care Cost Calculator: See Prices in Your Area

Nursing Home Data Explorer

Don’t Wait Too Long: 7 Red Flag Signs Your Parent Needs Assisted Living Now

The True Cost of Assisted Living in 2025 – And How Families Are Paying For It

Understanding Senior Living Costs: Pricing Models, Discounts & Financial Assistance