


Total health inspections
4
Maryland average 3.9
Last Health inspection on Sep 2025
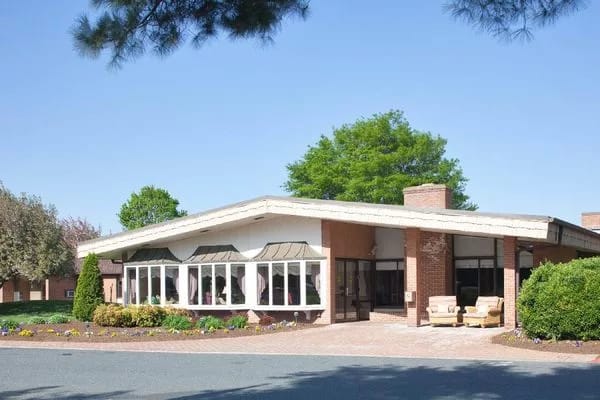

Discover The Pines Nursing and Rehab—a senior living community nestled in Easton, Maryland—offering a comprehensive range of skilled nursing, medical, and rehabilitative care services. With a capacious capacity of 195 beds, this facility is committed to providing hospice care and ensuring the well-being of its residents.
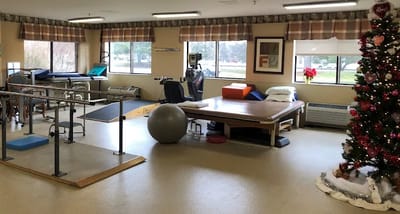
Established as a for-profit corporation certified since October 1, 2020, The Pines stands distinguished by its adept medical professionals who vigilantly oversee patient care, ensuring timely assessments and seamless progress updates. The devoted physical therapy team mirrors the facility’s commitment, extending professionalism and invaluable support. Recognized for its impeccable cleanliness and pleasant ambiance, The Pines fosters an environment of encouragement and support, a testament to the dedicated staff’s commitment to ensuring residents’ comfort and well-being.
| Staff type | Hours / Day / Resident | vs state avg |
|---|---|---|
|
Registered Nurse (RN)
| 32m per day | ▼ 36% State avg: 50m per day · National avg: 41m per day |
|
LPN / LVN
| 38m per day | ▼ 30% State avg: 54m per day · National avg: 52m per day |
|
Nurse Aide
| 2h 7m per day | ■ Avg State avg: 2h 10m per day · National avg: 2h 21m per day |
|
Weekend Total Nursing
| 2h 59m per day | ▼ 14% State avg: 3h 29m per day · National avg: 3h 26m per day |
|
Physical Therapist
| 5m per day | ■ Avg State avg: 5m per day · National avg: 4m per day |
|
Weekend RN
| 28m per day | ▼ 23% State avg: 37m per day · National avg: 29m per day |
In Maryland, the Department of Health, Office of Health Care Quality is the state agency that conducts unannounced inspections and issues reports for all assisted living and nursing facilities.
Citations
| This Facility | MD Average | vs. MD Avg |
|---|---|---|---|
|
Total citations
| 110 | 4 | This facility has 2650% more total citations than a typical Maryland nursing home (110 vs. MD avg 4).↑ 2650% worse |
Maryland average 3.9
Last Health inspection on Sep 2025
Maryland average 49.9
Maryland average 12.81
Health citations are formal notices following inspections when they fail to comply with safety and care standards.
125 of 168 citations resulted from standard inspections; 38 of 168 resulted from complaint investigations; and 5 of 168 came from combined inspections (standard and complaint).
Maryland average: 0.5
Maryland average: 0.6
Reporting period: October 1 – December 31, 2025 (Q4 2025). Source: CMS Payroll-Based Journal report.
Manages medical care and health needs.
Assists with medical care and medications.
Helps with daily care and mobility.
| Certified Nursing Assistant | 60 | 0 | 60 | 18,075 | 92 | 100% | 8.6 |
| Registered Nurse | 9 | 0 | 9 | 4,882 | 92 | 100% | 12.6 |
| Licensed Practical Nurse | 14 | 0 | 14 | 4,511 | 92 | 100% | 9.7 |
| Medication Aide/Technician | 14 | 0 | 14 | 2,992 | 92 | 100% | 8.1 |
| RN Director of Nursing | 5 | 0 | 5 | 1,804 | 82 | 89% | 7.7 |
| Other Dietary Services Staff | 7 | 0 | 7 | 1,707 | 89 | 97% | 7.6 |
| Physical Therapy Aide | 3 | 0 | 3 | 1,129 | 68 | 74% | 7.8 |
| Speech Language Pathologist | 2 | 0 | 2 | 1,026 | 67 | 73% | 8.1 |
| Respiratory Therapy Technician | 2 | 0 | 2 | 822 | 65 | 71% | 7.7 |
| Administrator | 2 | 0 | 2 | 528 | 63 | 68% | 8 |
| Dietitian | 1 | 0 | 1 | 480 | 60 | 65% | 8 |
| Qualified Social Worker | 1 | 0 | 1 | 477 | 59 | 64% | 8.1 |
| Nurse Practitioner | 1 | 0 | 1 | 448 | 56 | 61% | 8 |
| Physical Therapy Assistant | 1 | 0 | 1 | 448 | 56 | 61% | 8 |
| Occupational Therapy Aide | 1 | 0 | 1 | 379 | 83 | 90% | 4.6 |
Includes penalties issued in 2025
Federal penalties imposed by CMS for regulatory violations, including civil money penalties (fines) and denials of payment for new Medicare/Medicaid admissions.
Source: CMS Penalties Database (Data as of Jan 2026)
Maryland average: $61K
Maryland average: 1.5
Maryland average: 0.1
Penalties are imposed by CMS for violations of federal nursing home regulations.
1 penalty in the past 3 years
Mar 19, 2025 · $24K
Last updated: Jan 2026
These measures show how residents usually do over time at this home, based on health outcomes and preventive care.
Maryland average: 12.9
Maryland average: 25.7
Maryland average: 23.7%
Maryland average: 27.7%
Maryland average: 25.9%
Maryland average: 2.3%
Maryland average: 6.5%
Maryland average: 1.6%
Maryland average: 5.8%
Maryland average: 20.2%
Maryland average: 12.9%
Maryland average: 92.0%
Maryland average: 96.6%
Maryland average: 1.32
Maryland average: 1.21
Maryland average: 78.4%
Maryland average: 1.4%
Maryland average: 80.6%
Maryland average: 21.2%
Maryland average: 9.9%
Maryland average: 0.8%
Maryland average: 53.7%
Maryland average: 50.6%
Quality measures are calculated from Minimum Data Set (MDS) assessments. For most measures, lower percentages indicate better care quality.
58% of new residents, usually for short-term rehab.
27% of new residents, often for short stays.
15% of new residents, often for long-term daily care.
Source: CMS Long-Term Care Facility Characteristics (Data as of Jan 2026)
Residents meet regularly to discuss policies, care quality, and activities
Organized group of residents that meets regularly to discuss facility policies, quality of life, and activities.
Data sourced from CMS Long-Term Care Facility Characteristics quarterly report. Payer mix reflects the current resident census by primary payment source.
Historical financial and operational data for Pines Nursing and Rehab from 2012–2022, based on CMS SNF Cost Reports.
Key figures below are for fiscal year ending in 12/2022 — the home's most recent complete cost report, an older period than most facilities report.
Based on the home's most recent complete CMS SNF Cost Report — fiscal year ending in 12/2022. This is an older period than most facilities report, so compare with that in mind.
Most residents typically stay for a few weeks or months before returning home or moving on.
Most new residents arrive under Medicare (58% of admissions), and a typical Medicare stay runs around 23 days.
Coverage residents most often arrive under.
Coverage residents most often leave under.
![]() 1.3 miles from city center
1.3 miles from city center
![]() Estimated distance in miles from Easton's city center to Pines Nursing and Rehab's address, calculated via Google Maps.
— 0.17 miles to nearest hospital (University of Maryland shore EASTON MEDICAL CENTER)
Estimated distance in miles from Easton's city center to Pines Nursing and Rehab's address, calculated via Google Maps.
— 0.17 miles to nearest hospital (University of Maryland shore EASTON MEDICAL CENTER)
Add your location
Info below is compiled from CMS reports & the MD Dept. of Health (OHCQ), senior community websites & trusted data sources such as Walk Score & BBB.
Communities are listed from highest to lowest based on our ranking methodology.
| Mallard Bay Nursing and Rehab | NH HOS RC SNF | Cambridge | 160
Facility
160
MD AVG
42
Rank
#27 / 685 |
25.0%
Facility
25.0%
MD AVG
80.3
Rank
#94 / 97 | -69% | 2.84
Facility
2.84
MD AVG
3.77
Rank
#123 / 125 | -30% | -25% | $0
Facility
$0
MD AVG
$65.0k
Rank
#1 / 127 | 55
Facility
55
MD AVG
49.9
Rank
#84 / 127 | 9.2
Facility
9.2
MD AVG
12.8
Rank
#45 / 127 | - | 40 | A+ |
33
Facility
33
MD AVG
43
Rank
#597 / 985 | Cambridge MD Opco LLC | $10.6M*Fiscal year ending 12/2021These figures are from this home's most recent complete cost report — an older period than most facilities report. Compare with that in mind.
Facility
$10.6M*Fiscal year ending 12/2021These figures are from this home's most recent complete cost report — an older period than most facilities report. Compare with that in mind.
MD AVG
$18.7M
Rank
#110 / 126 | $4.6M*Fiscal year ending 12/2021These figures are from this home's most recent complete cost report — an older period than most facilities report. Compare with that in mind.
Facility
$4.6M*Fiscal year ending 12/2021These figures are from this home's most recent complete cost report — an older period than most facilities report. Compare with that in mind.
MD AVG
$6.5M
Rank
#115 / 126 | 43.5%*Fiscal year ending 12/2021These figures are from this home's most recent complete cost report — an older period than most facilities report. Compare with that in mind.
Facility
43.5%*Fiscal year ending 12/2021These figures are from this home's most recent complete cost report — an older period than most facilities report. Compare with that in mind.
MD AVG
38.5%
Rank
#87 / 126 | 215191 | ||||
| Pines Nursing and Rehab | NH SNF | Easton (South Pennsfield) | 195
Facility
195
MD AVG
42
Rank
#12 / 685 | - | - | 3.07
Facility
3.07
MD AVG
3.77
Rank
#104 / 125 | -47% | -19% | $24.1k
Facility
$24.1k
MD AVG
$65.0k
Rank
#104 / 127 | 168
Facility
168
MD AVG
49.9
Rank
#127 / 127 | 42.0
Facility
42.0
MD AVG
12.8
Rank
#127 / 127 | 4 | 38 | - |
32
Facility
32
MD AVG
43
Rank
#609 / 985 | Md4 Holdco, LLC | $13.1M*Fiscal year ending 12/2022These figures are from this home's most recent complete cost report — an older period than most facilities report. Compare with that in mind.
Facility
$13.1M*Fiscal year ending 12/2022These figures are from this home's most recent complete cost report — an older period than most facilities report. Compare with that in mind.
MD AVG
$18.7M
Rank
#94 / 126 | $4.2M*Fiscal year ending 12/2022These figures are from this home's most recent complete cost report — an older period than most facilities report. Compare with that in mind.
Facility
$4.2M*Fiscal year ending 12/2022These figures are from this home's most recent complete cost report — an older period than most facilities report. Compare with that in mind.
MD AVG
$6.5M
Rank
#85 / 126 | 31.7%*Fiscal year ending 12/2022These figures are from this home's most recent complete cost report — an older period than most facilities report. Compare with that in mind.
Facility
31.7%*Fiscal year ending 12/2022These figures are from this home's most recent complete cost report — an older period than most facilities report. Compare with that in mind.
MD AVG
38.5%
Rank
#33 / 126 | 215010 |
Pines Nursing and Rehab is located in Easton, Maryland.
Here are the financial assistance programs available to residents in Maryland.
Pines Nursing and Rehab is in the South Pennsfield neighborhood of Easton.
Pines Nursing and Rehab has a walk score of 32. Somewhat walkable. A few nearby services may be reachable on foot, but most trips require transportation.
Pines Nursing and Rehab's occupancy is 50.7%.
No, Pines Nursing and Rehab has a no-pet policy.
Pines Nursing and Rehab is registered as a for-profit in MD.
Yes — there are 3 photos of Pines Nursing and Rehab in the photo gallery on this page.
Pines Nursing and Rehab is located at 610 Dutchmans Ln, Easton, MD 21601.
Care Cost Calculator: See Prices in Your Area
Nursing Home Data Explorer
Don’t Wait Too Long: 7 Red Flag Signs Your Parent Needs Assisted Living Now
The True Cost of Assisted Living in 2025 – And How Families Are Paying For It
Understanding Senior Living Costs: Pricing Models, Discounts & Financial Assistance


